INFOGRAPHICS: October 2022 CREB City And Region Market Reports

Sales remain stronger than pre-covid levels
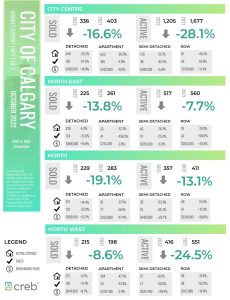
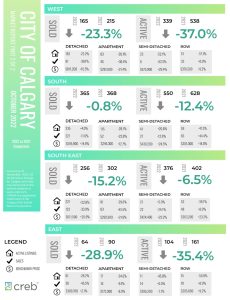
October sales eased compared to last year’s levels, mostly due to slower activity in the detached sector.
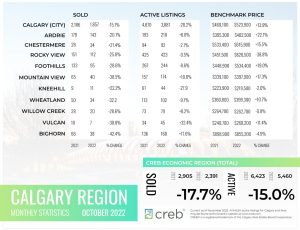
However, with 1,857 sales this month, levels are still stronger than long-term trends and activity reported prior to the pandemic. Year-to-date sales have reached 26,823 and with only two months to go, 2022 will likely post a record year in terms of sales.
“Calgary hasn’t seen the same degree of pullback in housing sales like other parts of Canada, thanks to persistently strong demand for our higher density product,” said CREB® Chief Economist Ann-Marie Lurie. “While our city is not immune to the impact that inflation and higher rates are having, strong employment growth, positive migration flows and a stronger commodity market are helping offset some of that impact.”
New listings also trended down this month causing the sales-to-new-listings ratio to rise to 85 per cent and inventories to trend down. Much of the inventory decline has been driven by product priced below $500,000.
Read the full report on the CREB website!
The following data is a comparison between October 2022 and October 2021 numbers, and is current as of November 2022. For last month’s numbers, check out our previous infographic.
Or follow this link for all our CREB Infographics!
Click on the images for a larger view!
Download Printable Version – October 2022 CREB, City of Calgary Report Part 1
Download Printable Version – October 2022 CREB, City of Calgary Report Part 2
Download Printable Version – October 2022 CREB, Calgary Region Report
Last Updated on November 28, 2023 by myRealPage


