INFOGRAPHICS: October 2025 TRREB Toronto Market Reports

GTA REALTORS Release October Stats
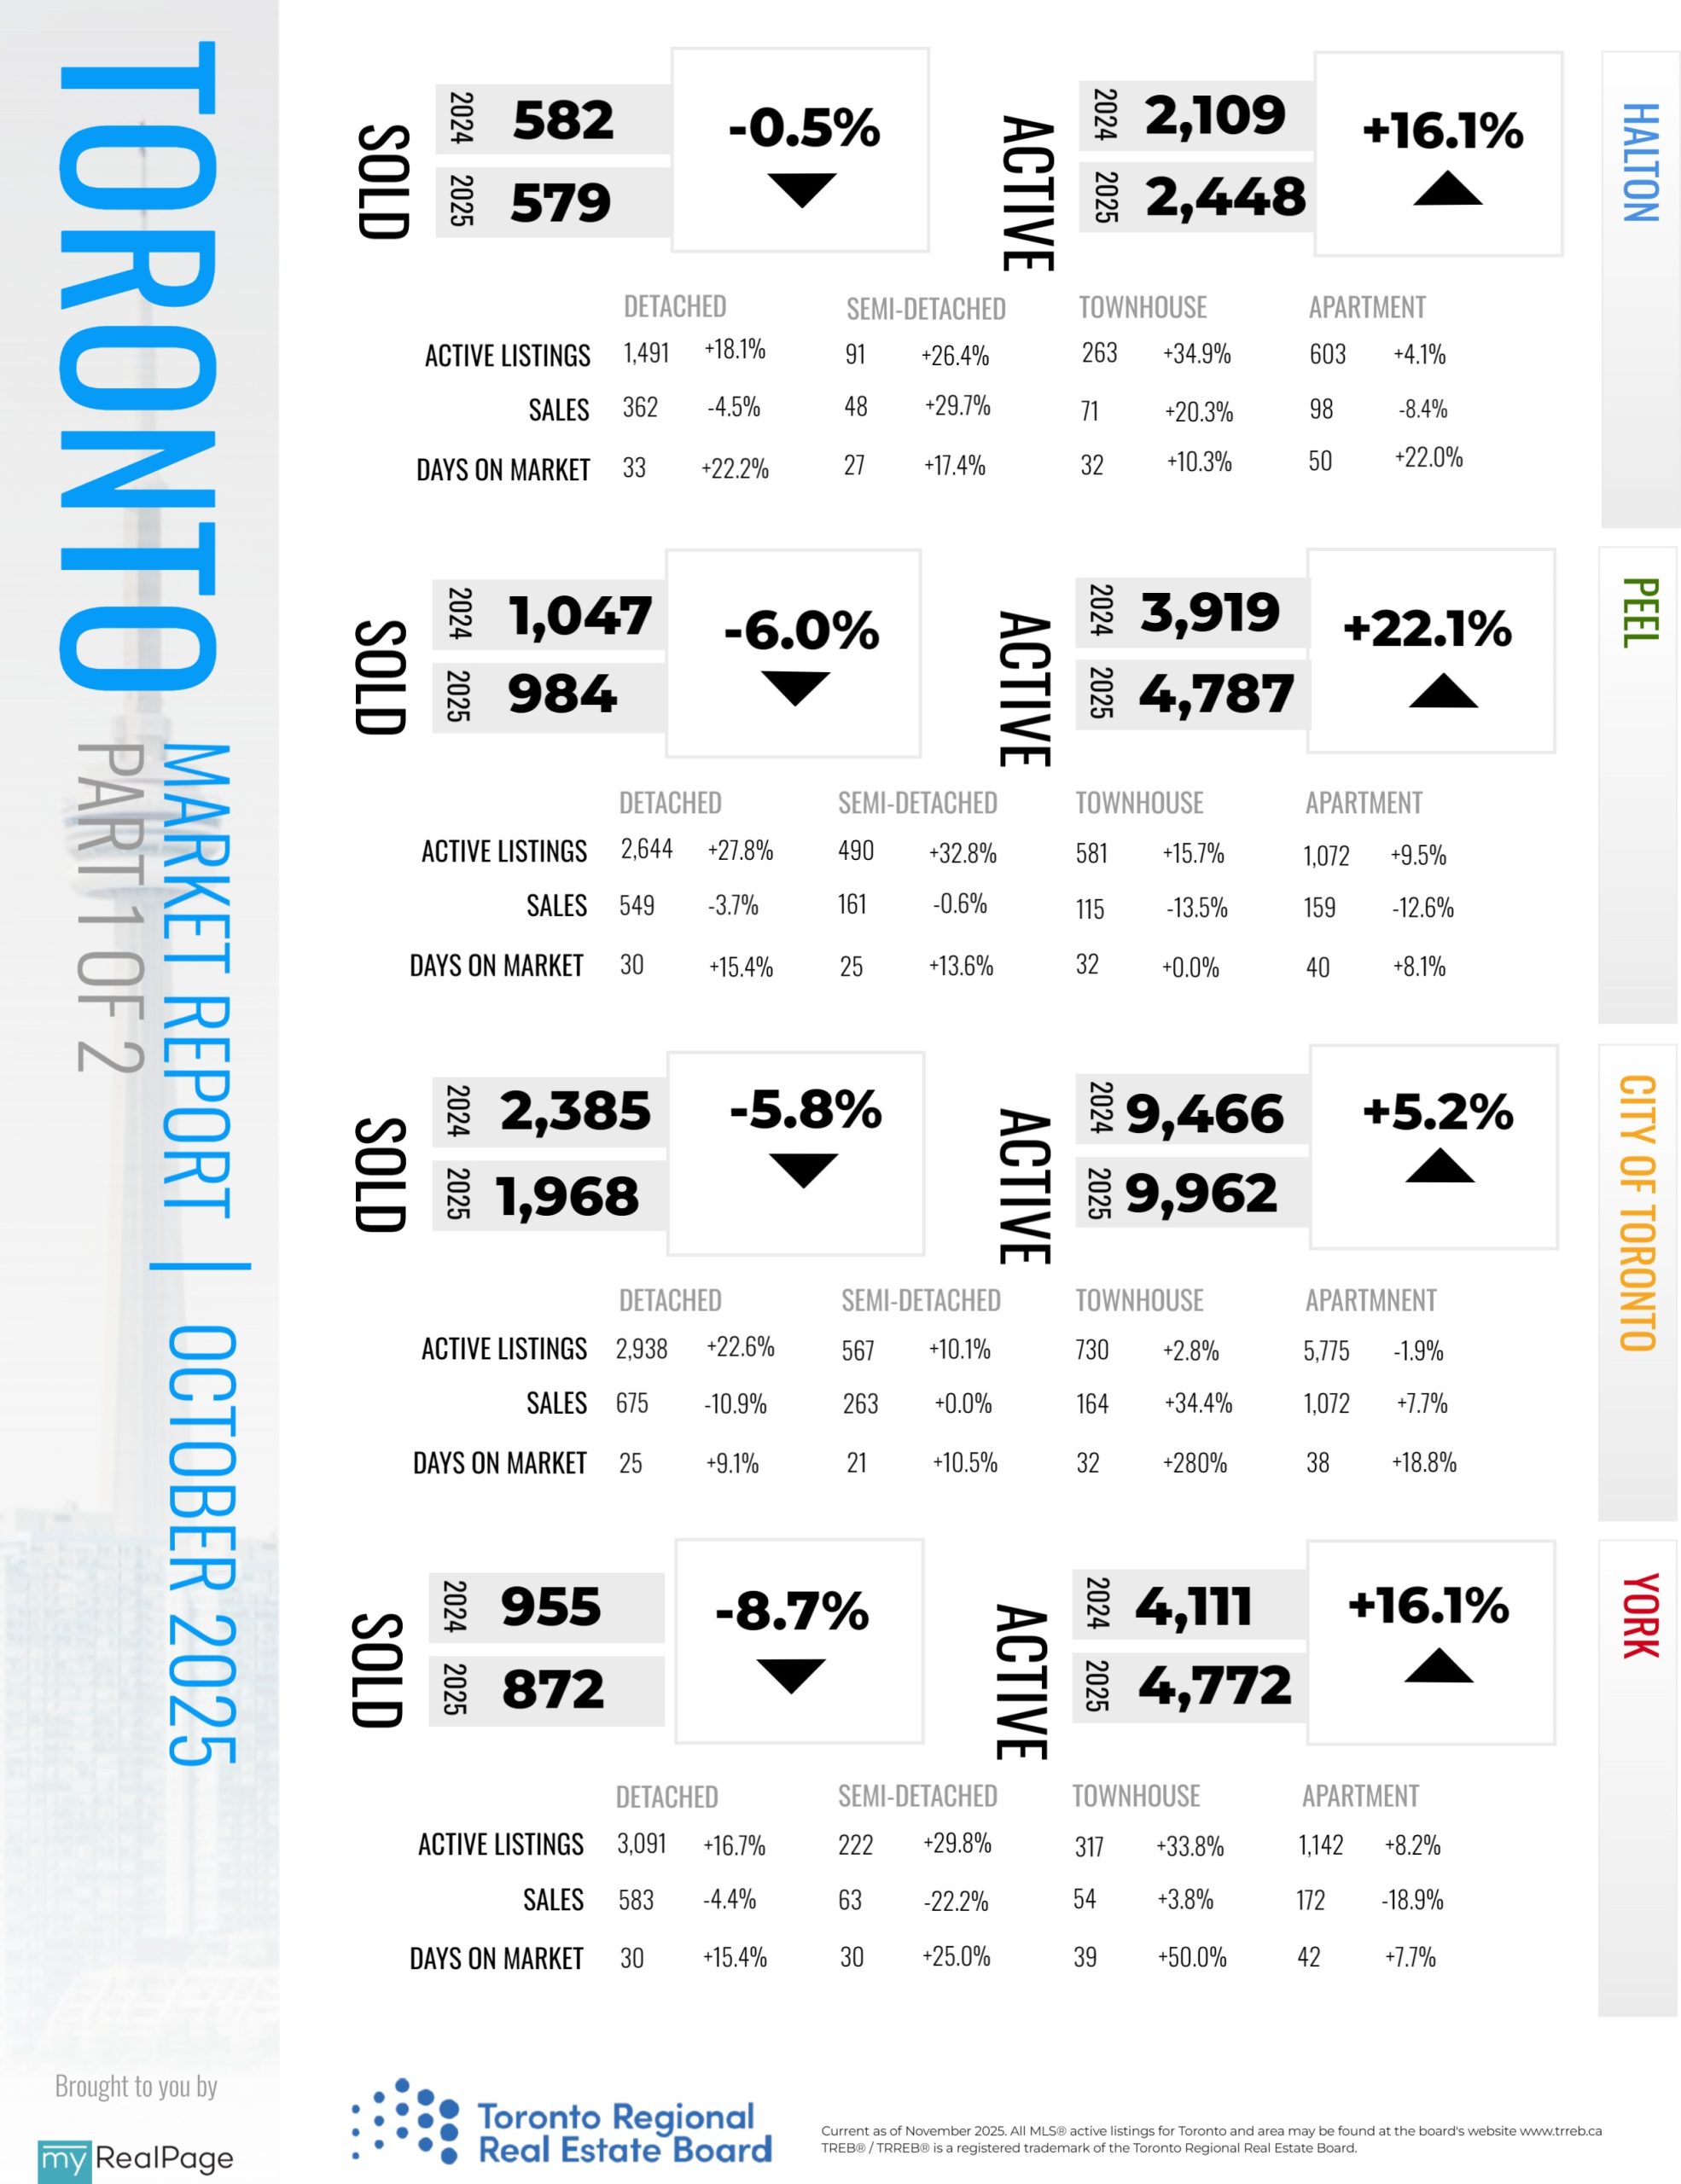
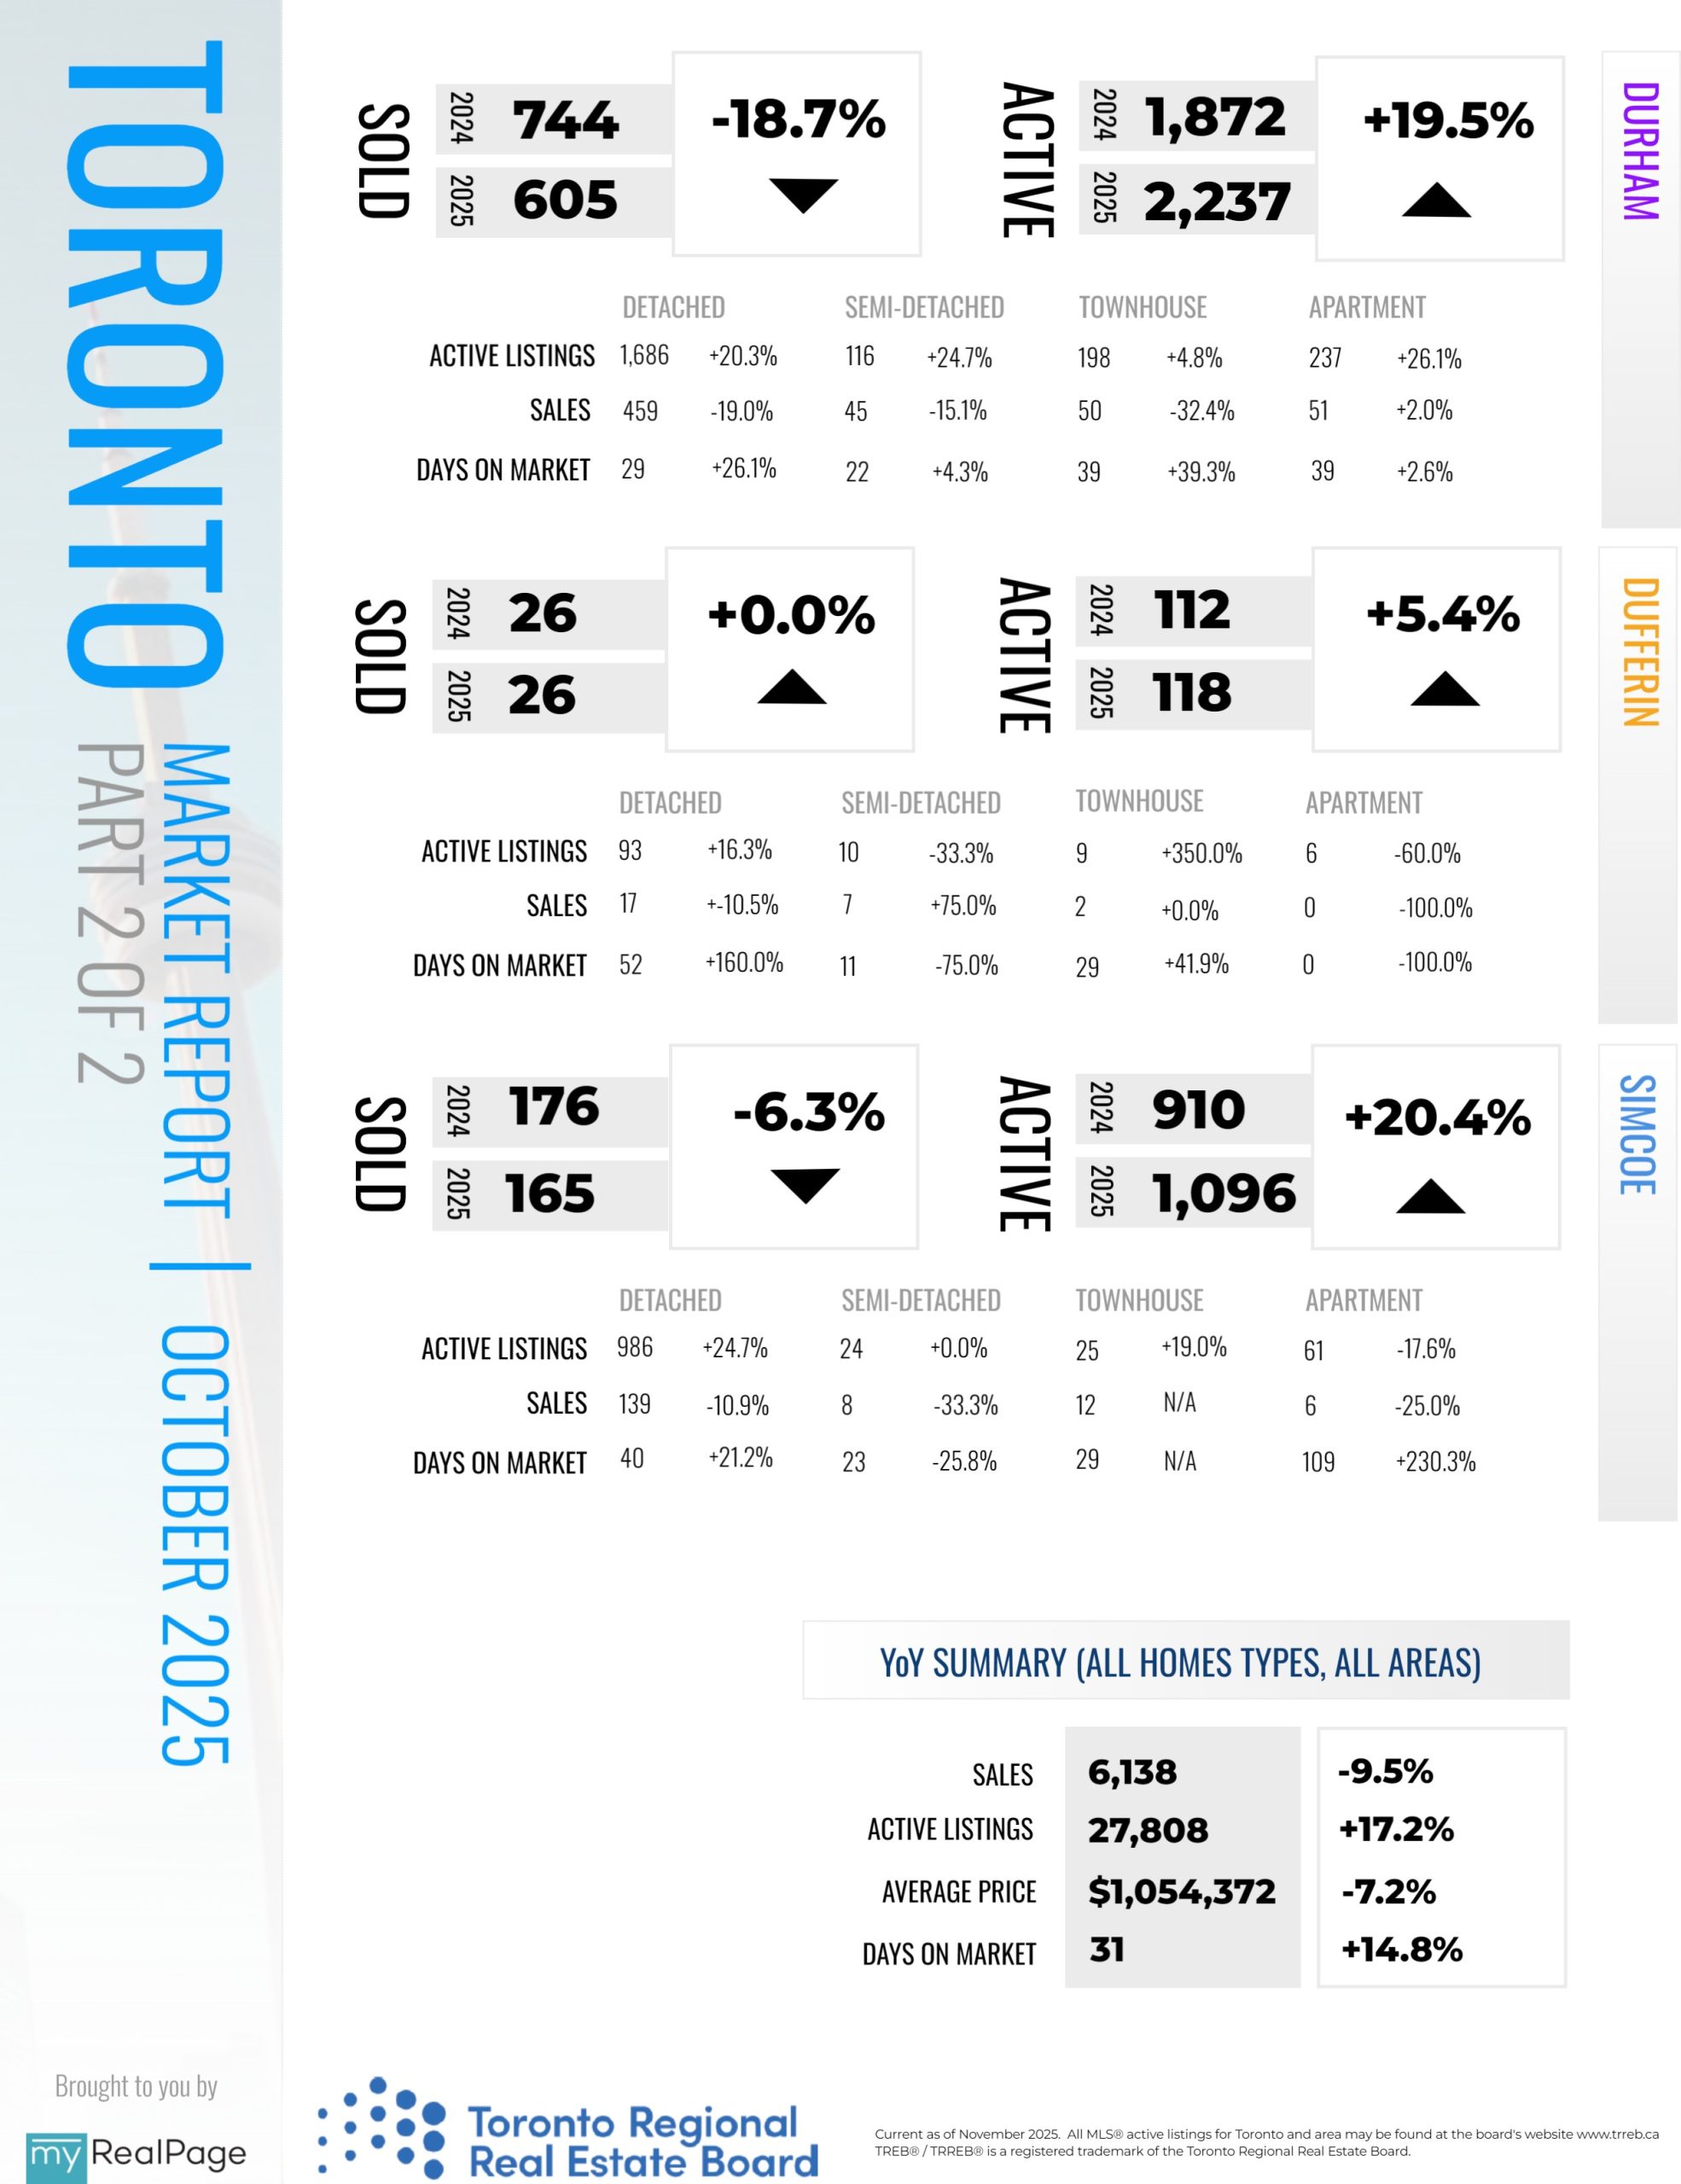
Home sales in the Greater Toronto Area (GTA) were down year-over-year in October, while new listings were up. Market conditions continued to favour homebuyers, as average selling prices were negotiated down alongside lower mortgage rates.
“Buyers who are confident in their employment situation and ability to make their mortgage payments over the long term are benefitting from affordable housing market conditions relative to the past few years. However, many intending homebuyers remain on the sidelines due to uncertainty about their economic future,” said TRREB
President Elechia Barry-Sproule.
GTA REALTORS® reported 6,138 home sales through TRREB’s MLS® System in October 2025 – down by 9.5 per cent compared to October 2024. New listings entered into the MLS® System amounted to 16,069 – up by 2.7 per cent year-over-year.
Read the full report on TRREB website!
The following data is a comparison between October 2025 and October 2024 numbers, and is current as of November of 2025. For last month’s numbers, check out our previous infographic!
Or follow this link for all our TREB / TRREB Infographics!
Download Printable Version – October 2025 TRREB, Toronto Market Report
Last Updated on November 10, 2025 by myRealPage
