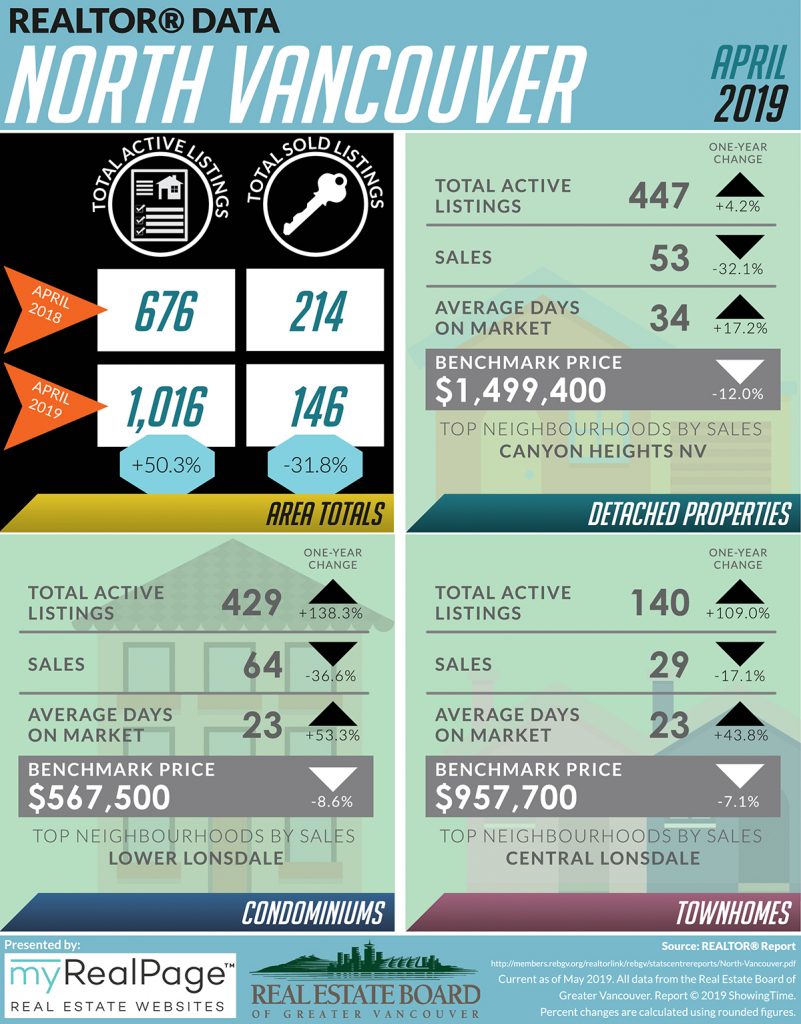
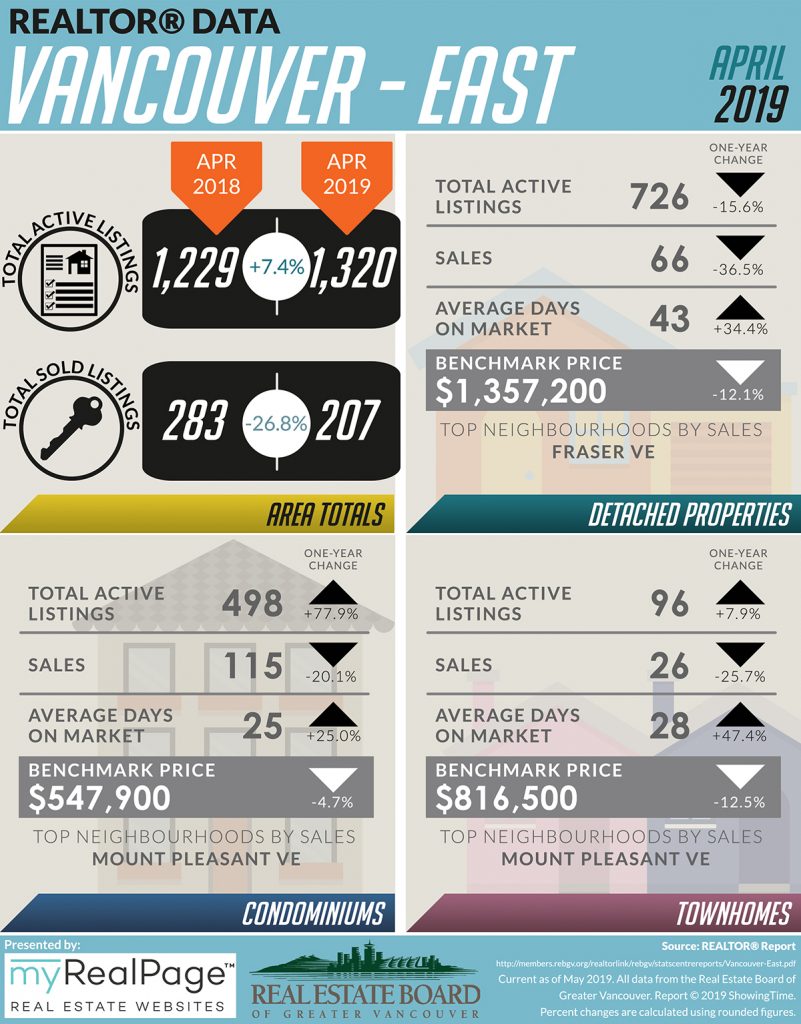
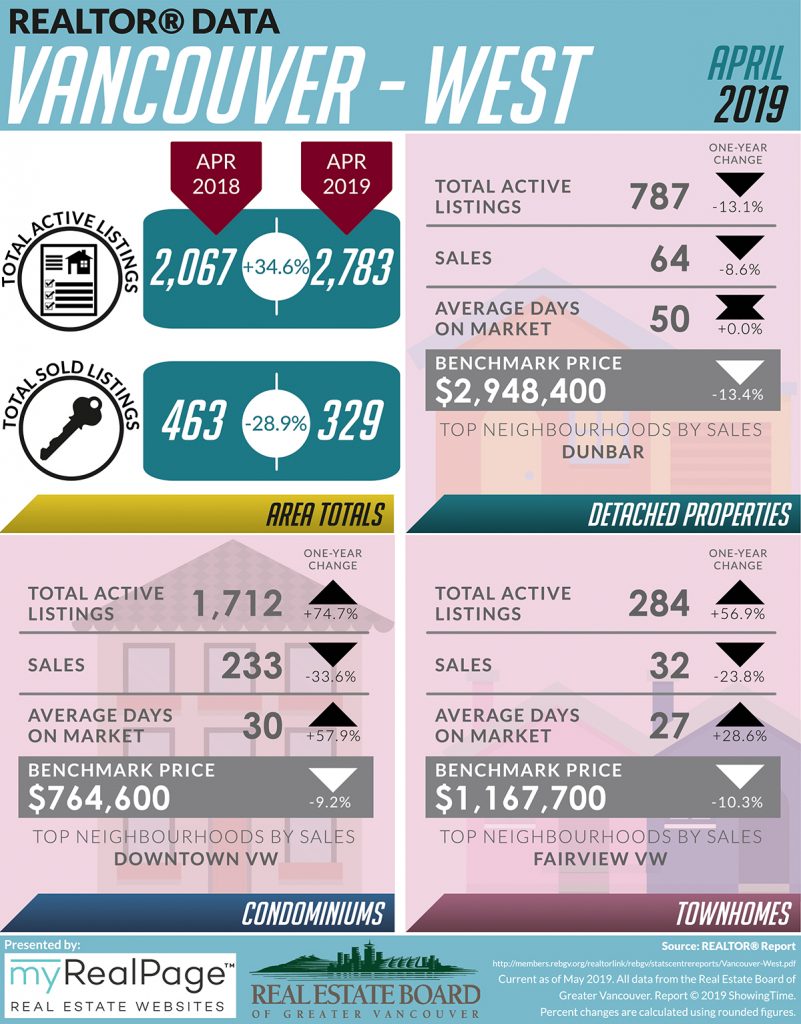
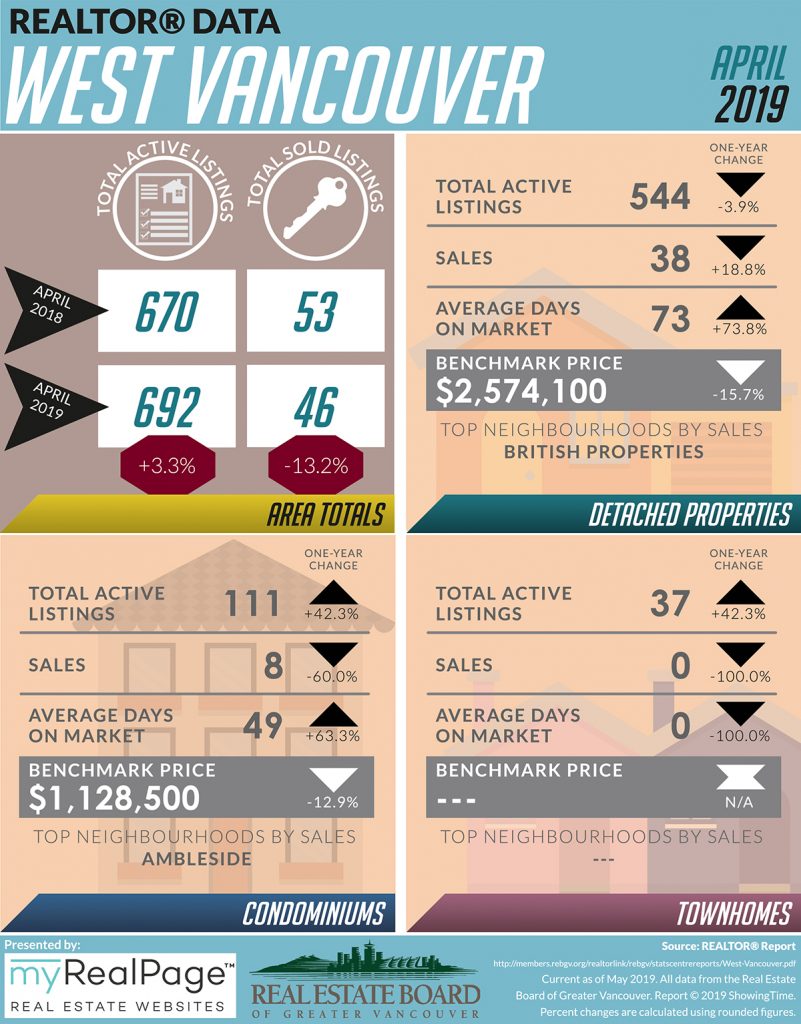
INFOGRAPHICS: April 2019 REBGV Greater Vancouver Market Reports
Holding steady for the month of May. It’s once again time for our monthly market update for areas covered by the Real Estate Board of Greater Vancouver (REBGV)!
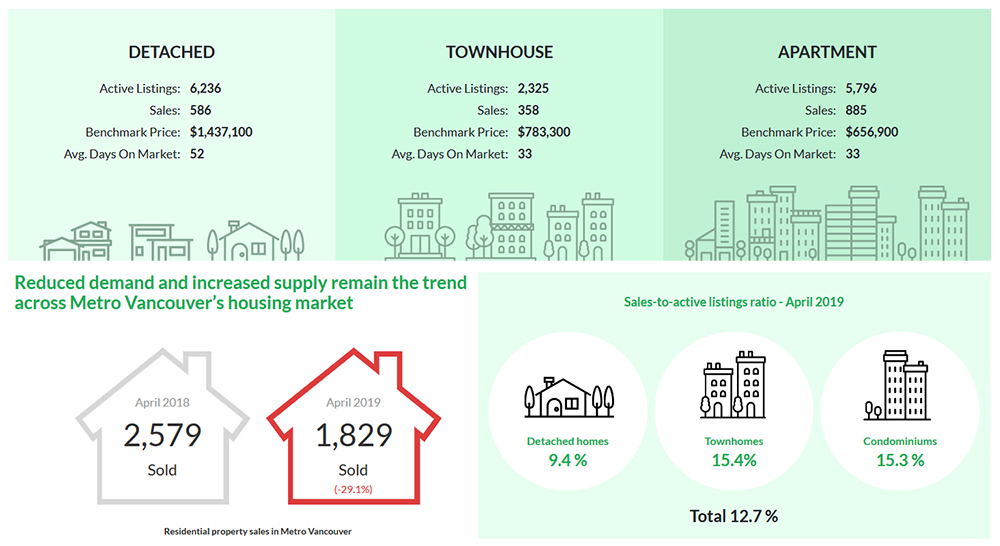
As stated in their latest media release, reduced demand and increased supply remain the trend across Metro Vancouver’s housing market.
The board reports that residential home sales in the region totaled 1,829 in April 2019, a 29.1% decrease from the 2,579 sales recorded in April 2018, and a 5.9% increase from the 1,727 homes sold in March 2019.
Last month’s sales were 43.1% below the 10-year April sales average.
As noted by Ashley Smith, REBGV President,
“Government policy continues to hinder home sale activity. The federal government’s mortgage stress test has reduced buyers’ purchasing power by about 20%, which is causing people at the entry-level side of the market to struggle to secure financing. Suppressing housing activity through government policy not only reduces home sales, it harms the job market, economic growth and creates pent-up demand.
There are more homes for sale in our market today than we’ve seen since October 2014. This trend is more about reduced demand than increased supply.
The number of new listings coming on the market each month are consistent with our long-term averages. It’s the reduced sales activity that’s allowing listings to accumulate.”
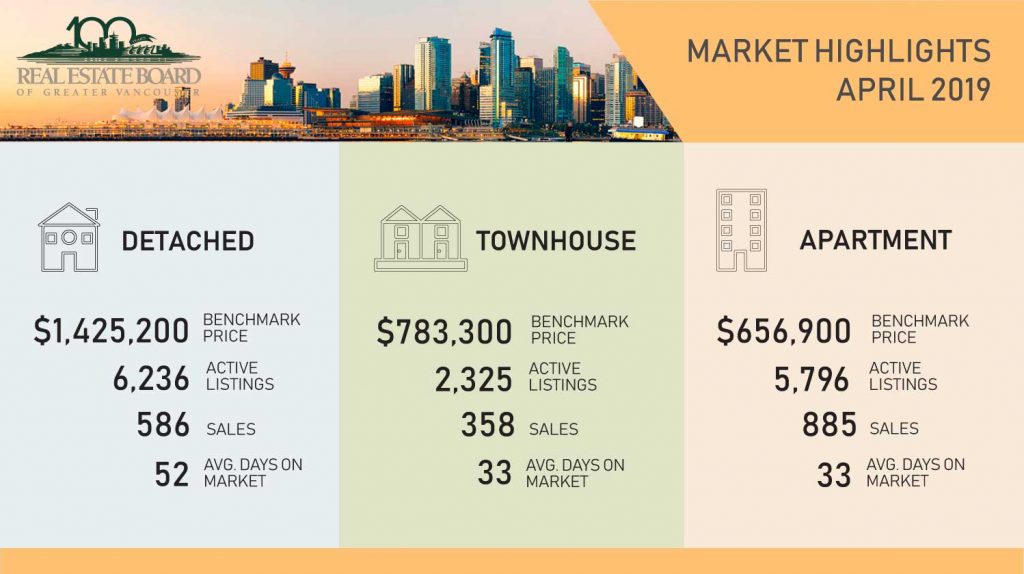
The following data is a comparison between April 2018 and April 2019 numbers, and is current as of May 2019. For last month’s update, you can check out our previous post for March 2019 data.
Or follow this link for all our REBGV Infographics!
These infographics cover current trends in North Vancouver, West Vancouver, Vancouver East, and Vancouver West.
Click on the images for a larger view!
(Protip: Make sure to grab the printable PDF versions, too! It fits best when printed on A4-sized sheets, AND we’ve added an area on the sheet where you can attach your business card! 🙂 )
Download Printable Version – REBGV April 2019 Data Infographics
(Image from: rebgv.org)
(Image Source: REBGV Twitter)
Last Updated on July 25, 2022 by myRealPage


