INFOGRAPHICS: November 2021 REBGV Greater Vancouver Market Reports

Home sales activity remains up, listings down across Metro Vancouver’s housing market
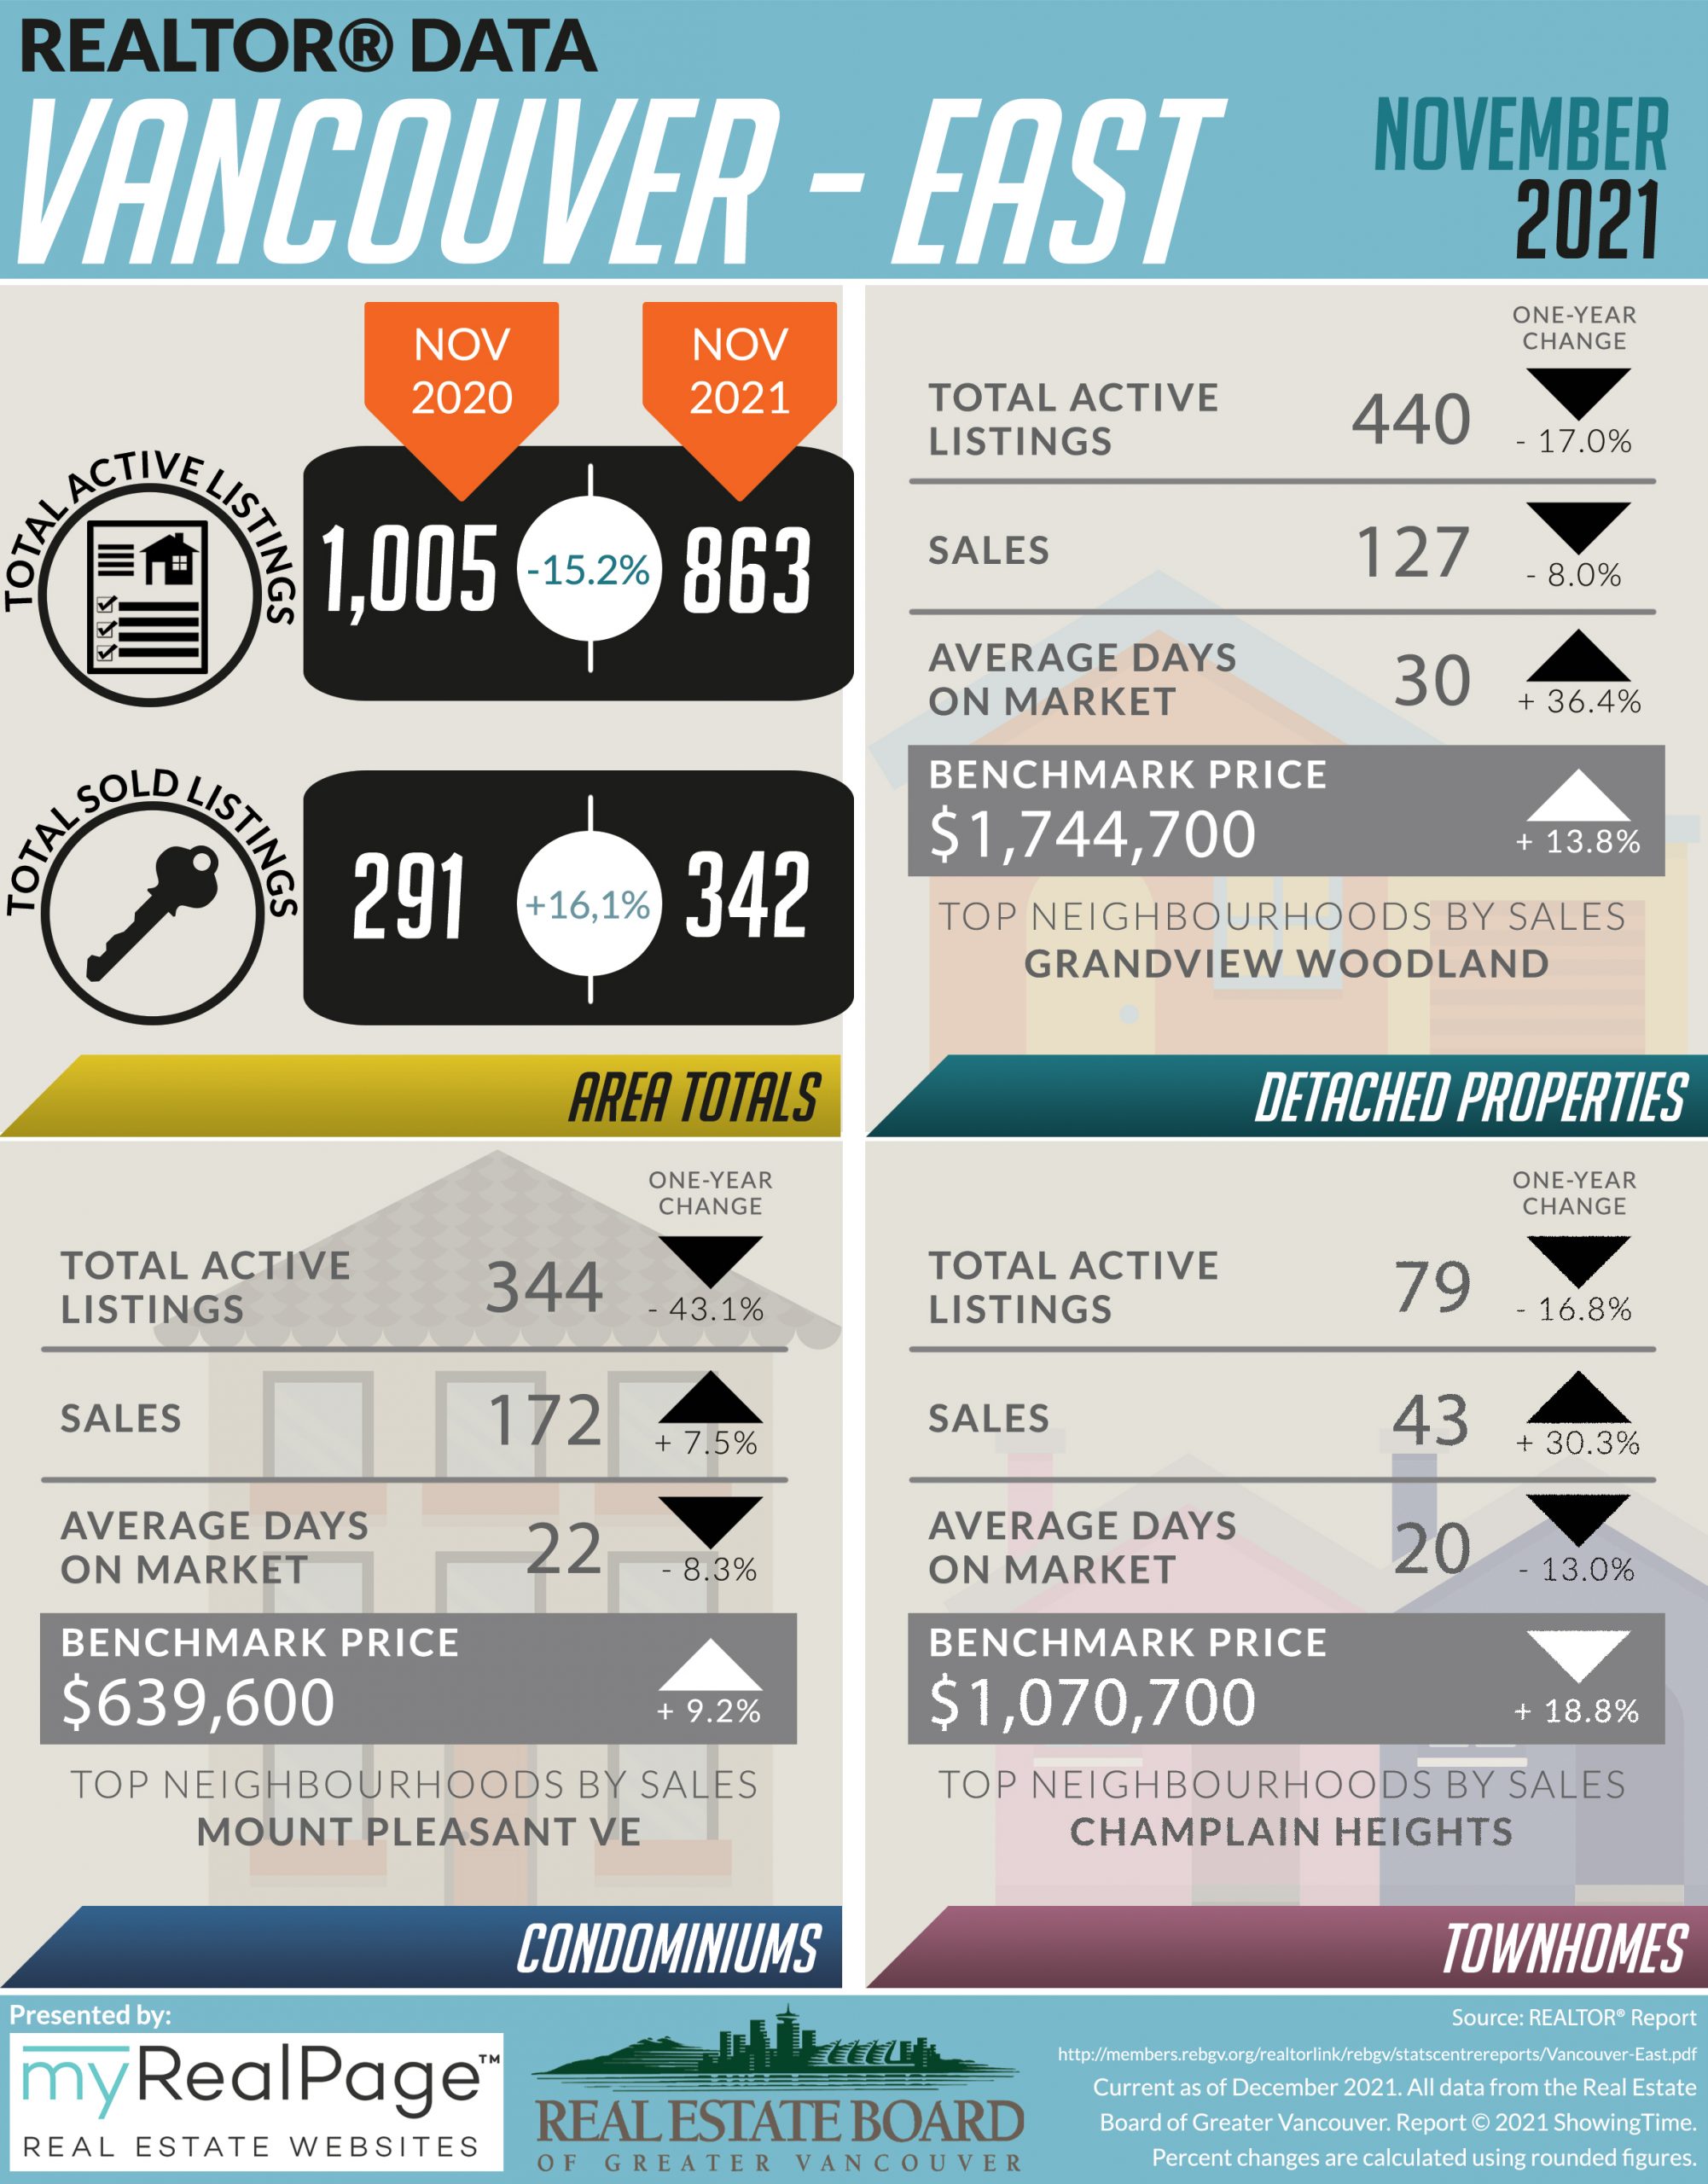
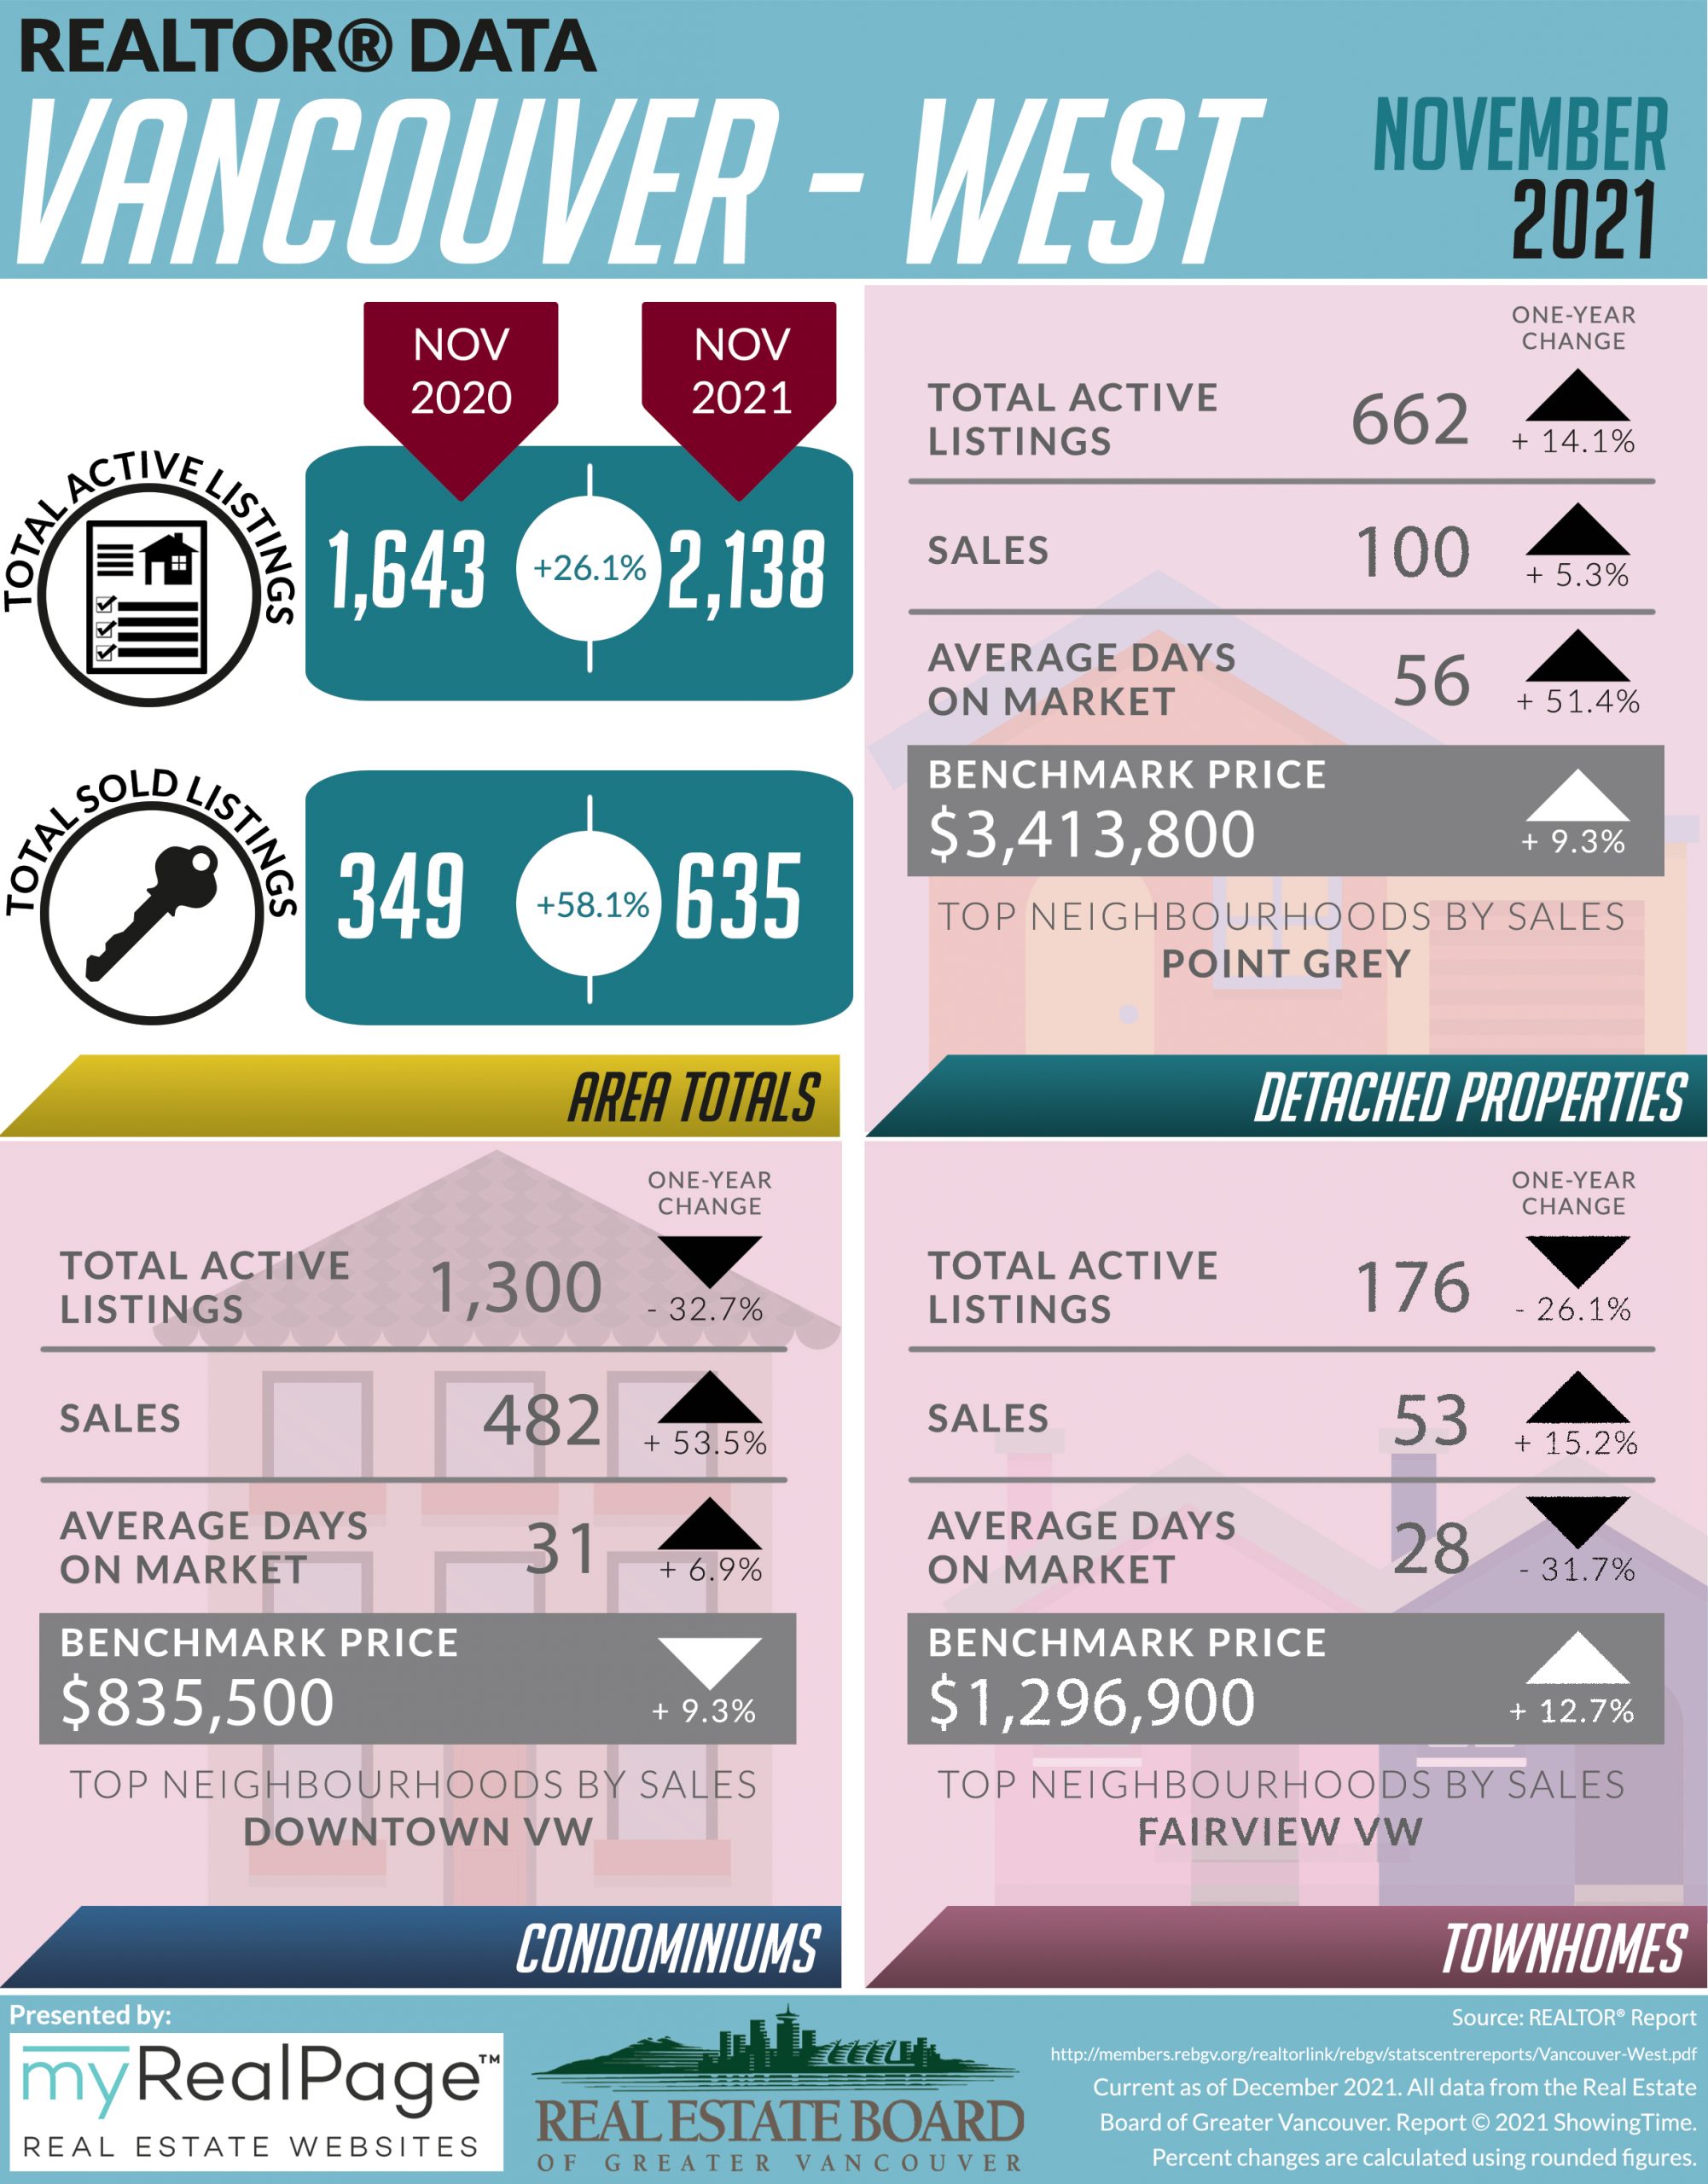
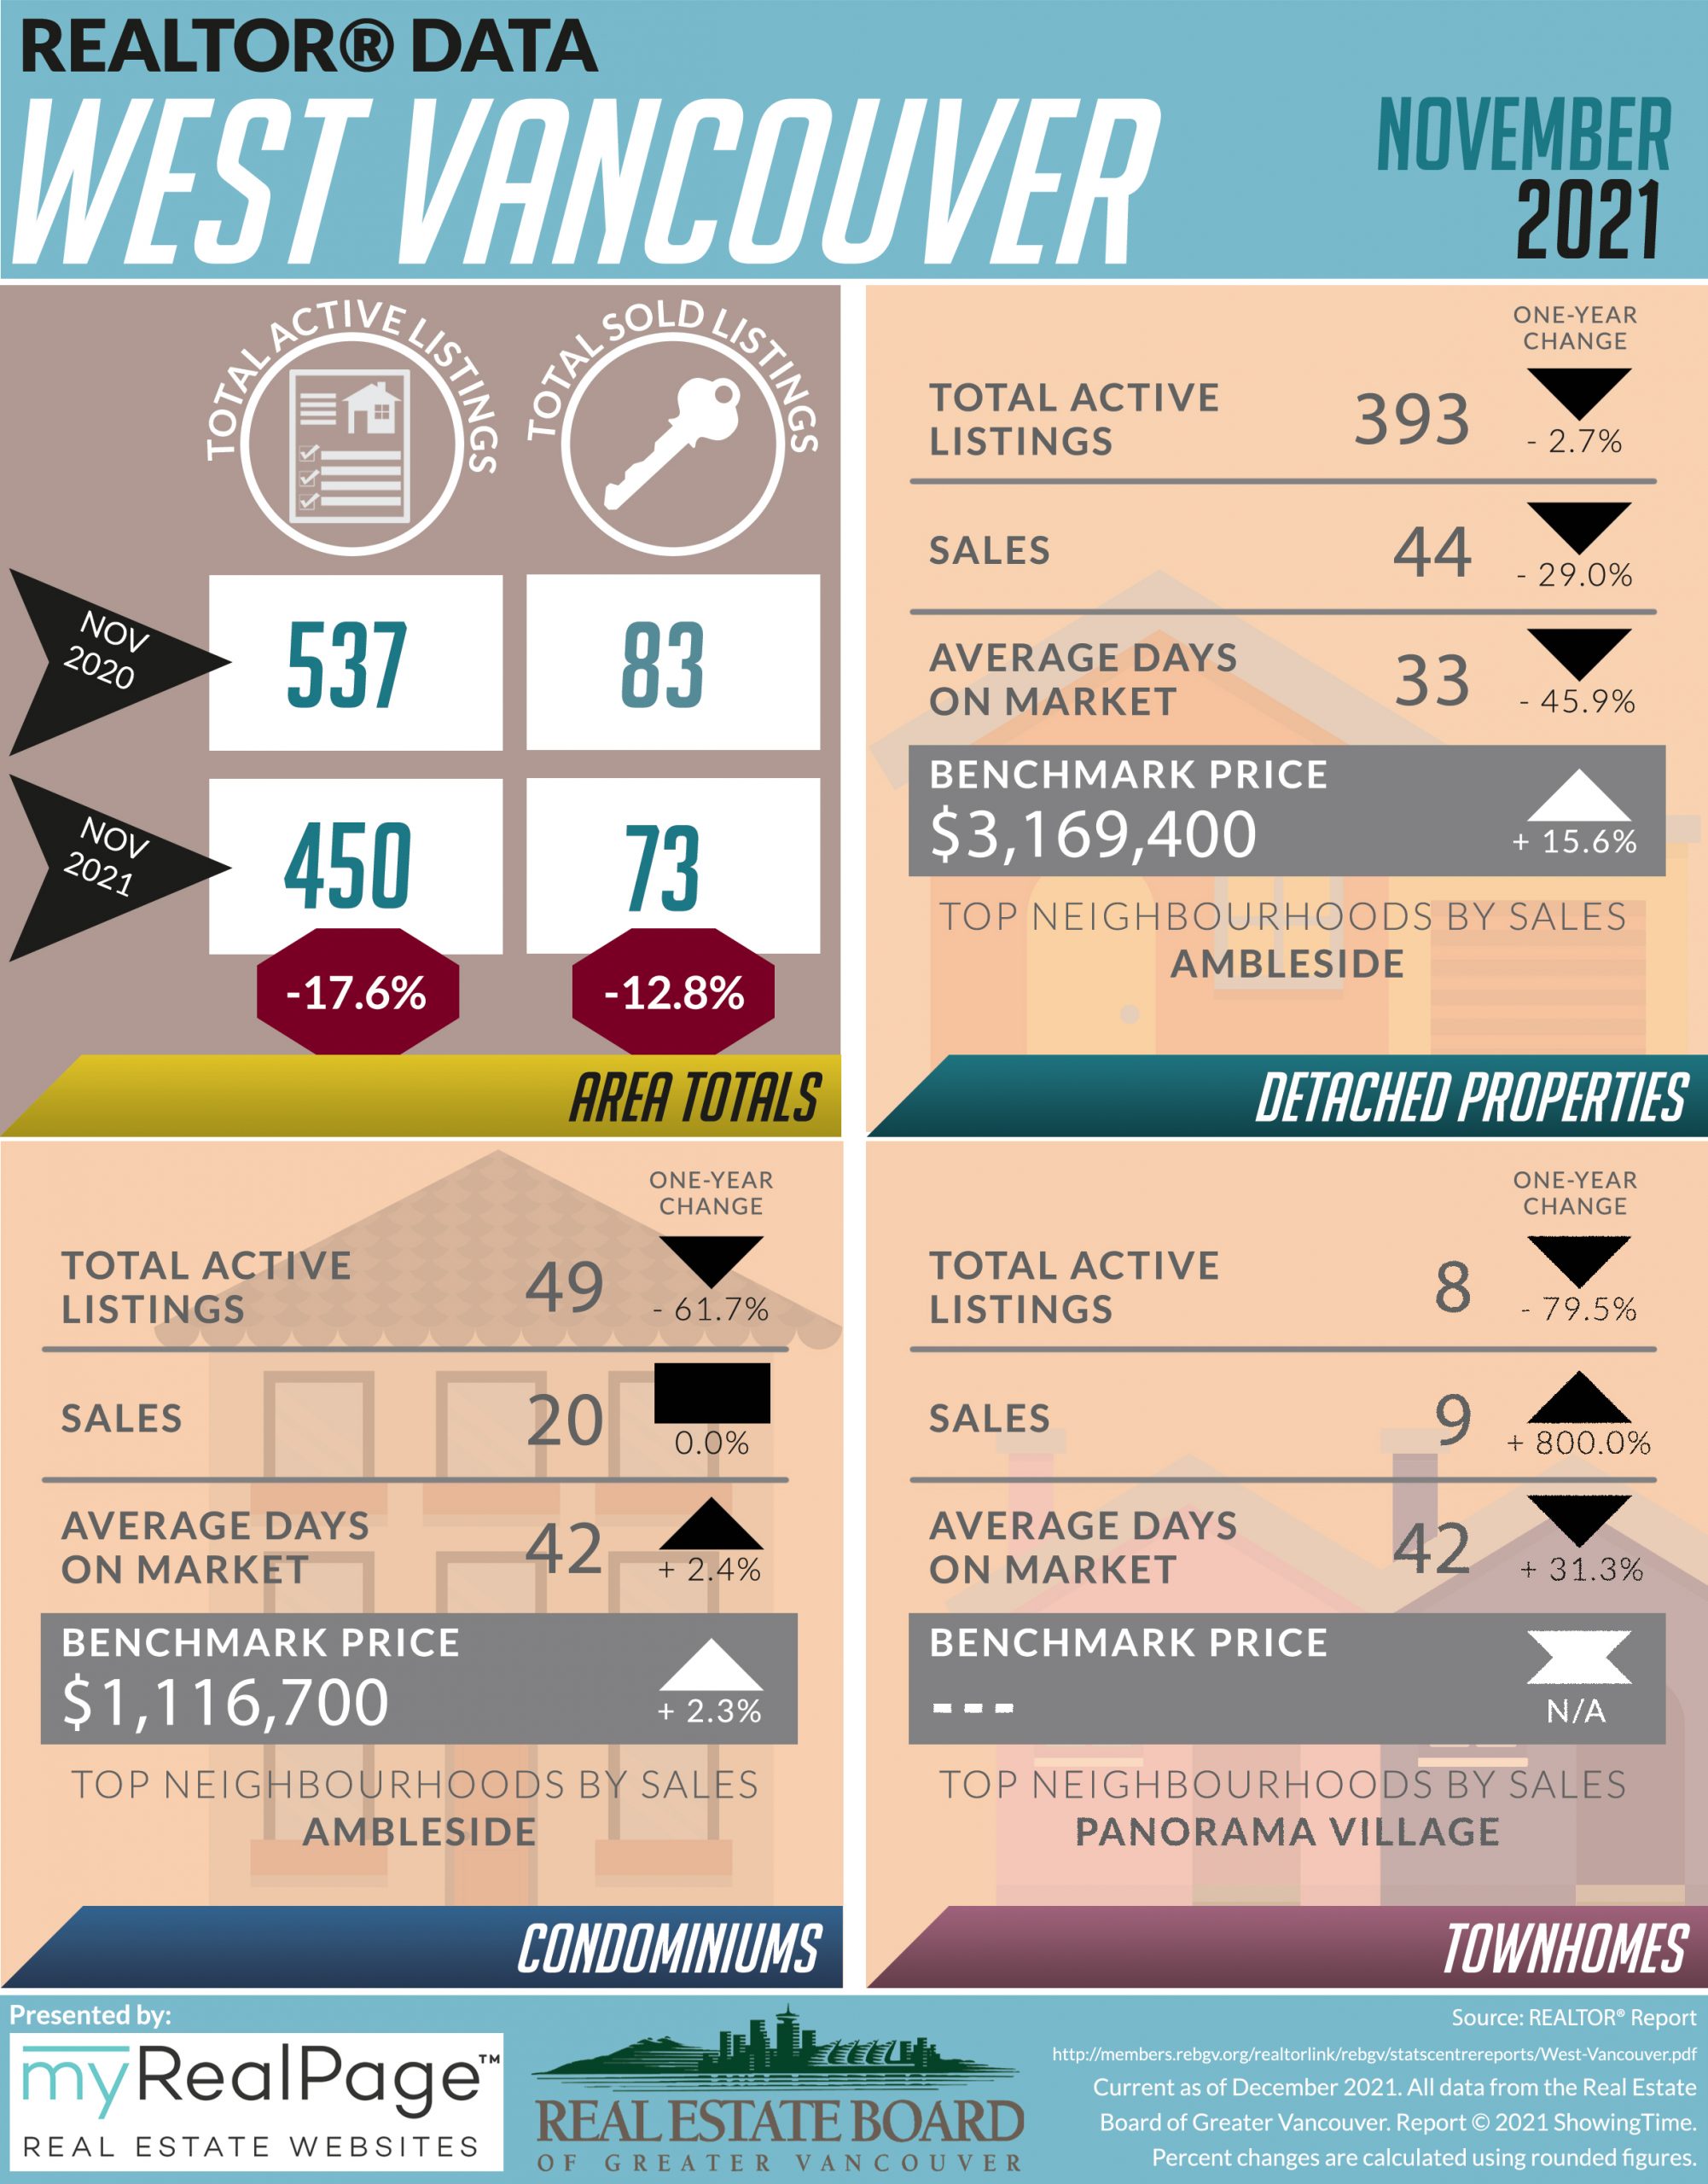
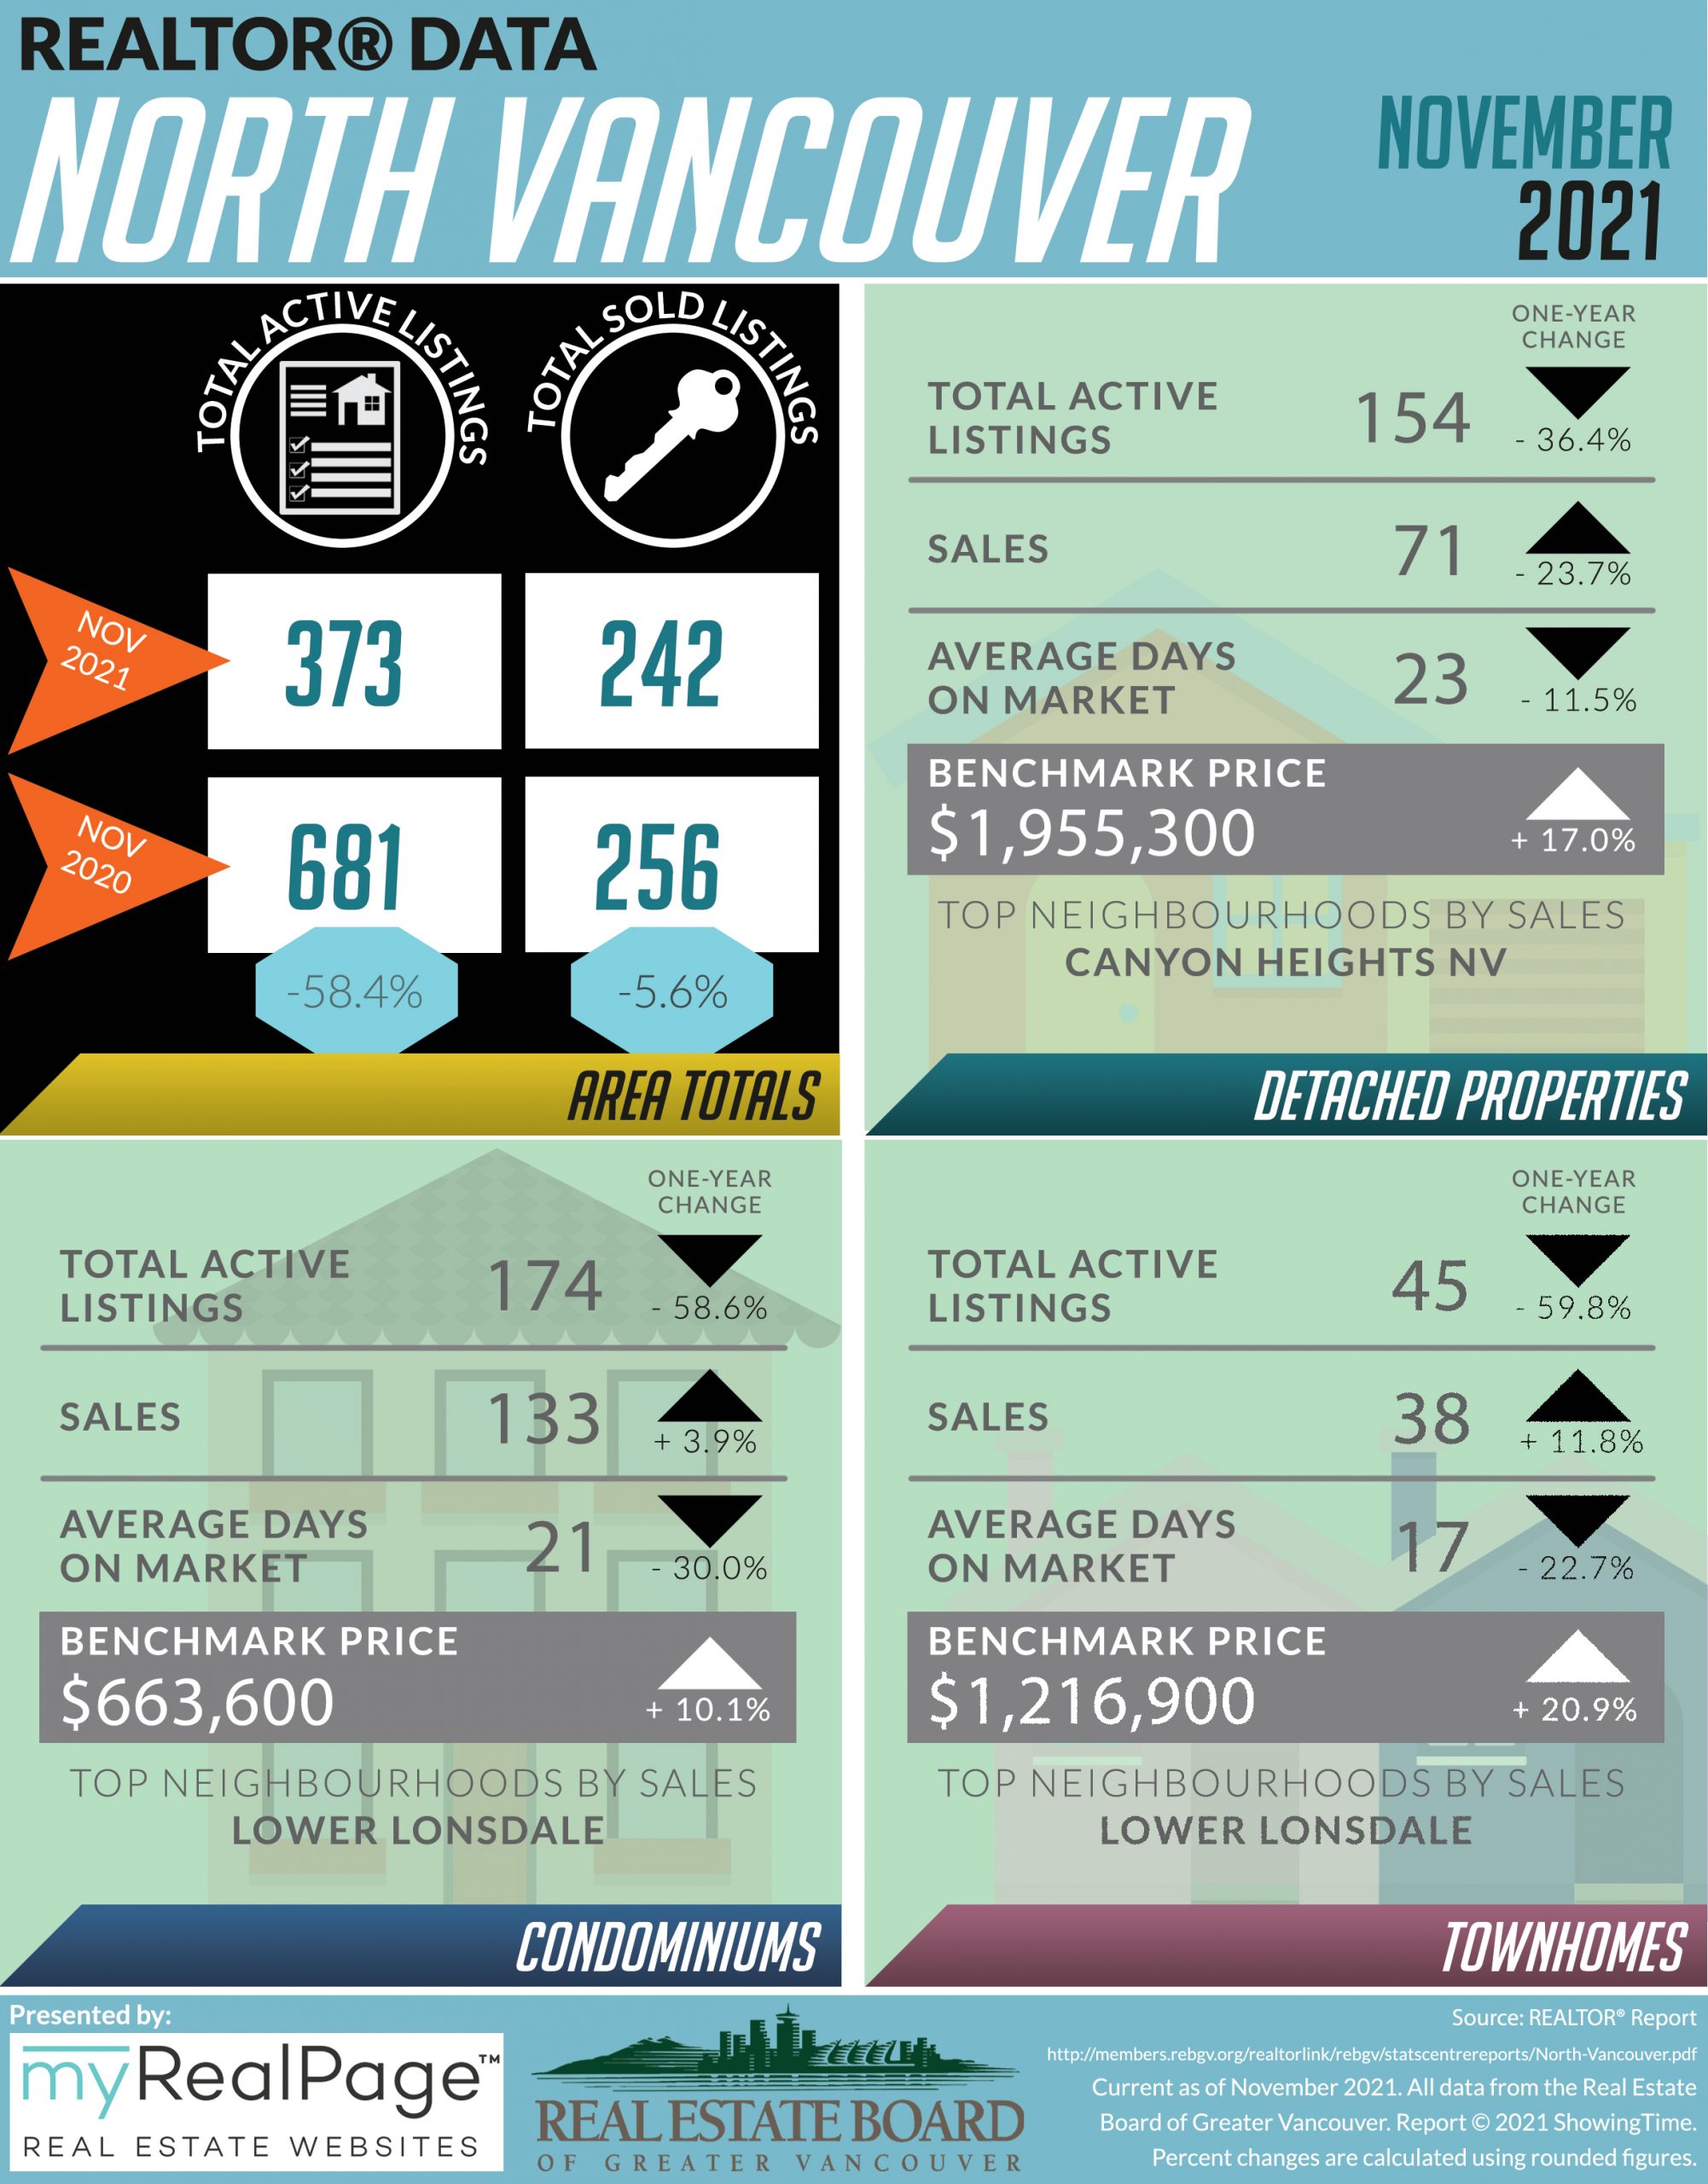
As we near the end of 2021, home buyer demand remains well in excess of long-term averages and the supply of homes for sale continues to decline across Metro Vancouver’s* housing market.
The Real Estate Board of Greater Vancouver (REBGV) reports that residential home sales in the region totalled 3,428 in November 2021, an 11.9 per cent increase from the 3,064 sales recorded in November 2020, and a 1.9 per cent decrease from the 3,494 homes sold in October 2021.
Last month’s sales were 33.6 per cent above the 10-year November sales average.
Read the full report on the REBGV website!
The following data is a comparison between November 2020 and November 2021 numbers, and is current as of December 2021. For last month’s update, you can check out our previous post!
Or follow this link for all our REBGV Infographics!
These infographics cover current trends in North Vancouver, West Vancouver, Vancouver East, and Vancouver West. Click on the images for a larger view!
Download Printable Version – REBGV November 2021 Data Infographic Report 1
Download Printable Version – REBGV November 2021 Data Infographics Report 2
Download Printable Version – REBGV November 2021 Data Infographics Report 3
Download Printable Version – REBGV November 2021 Data Infographics Report 4
Last Updated on July 25, 2022 by myRealPage
