INFOGRAPHICS: March 2026 VIREB Vancouver Island Market Reports

BALANCED MARKET, MEASURED MOMENTUM IN MARCH
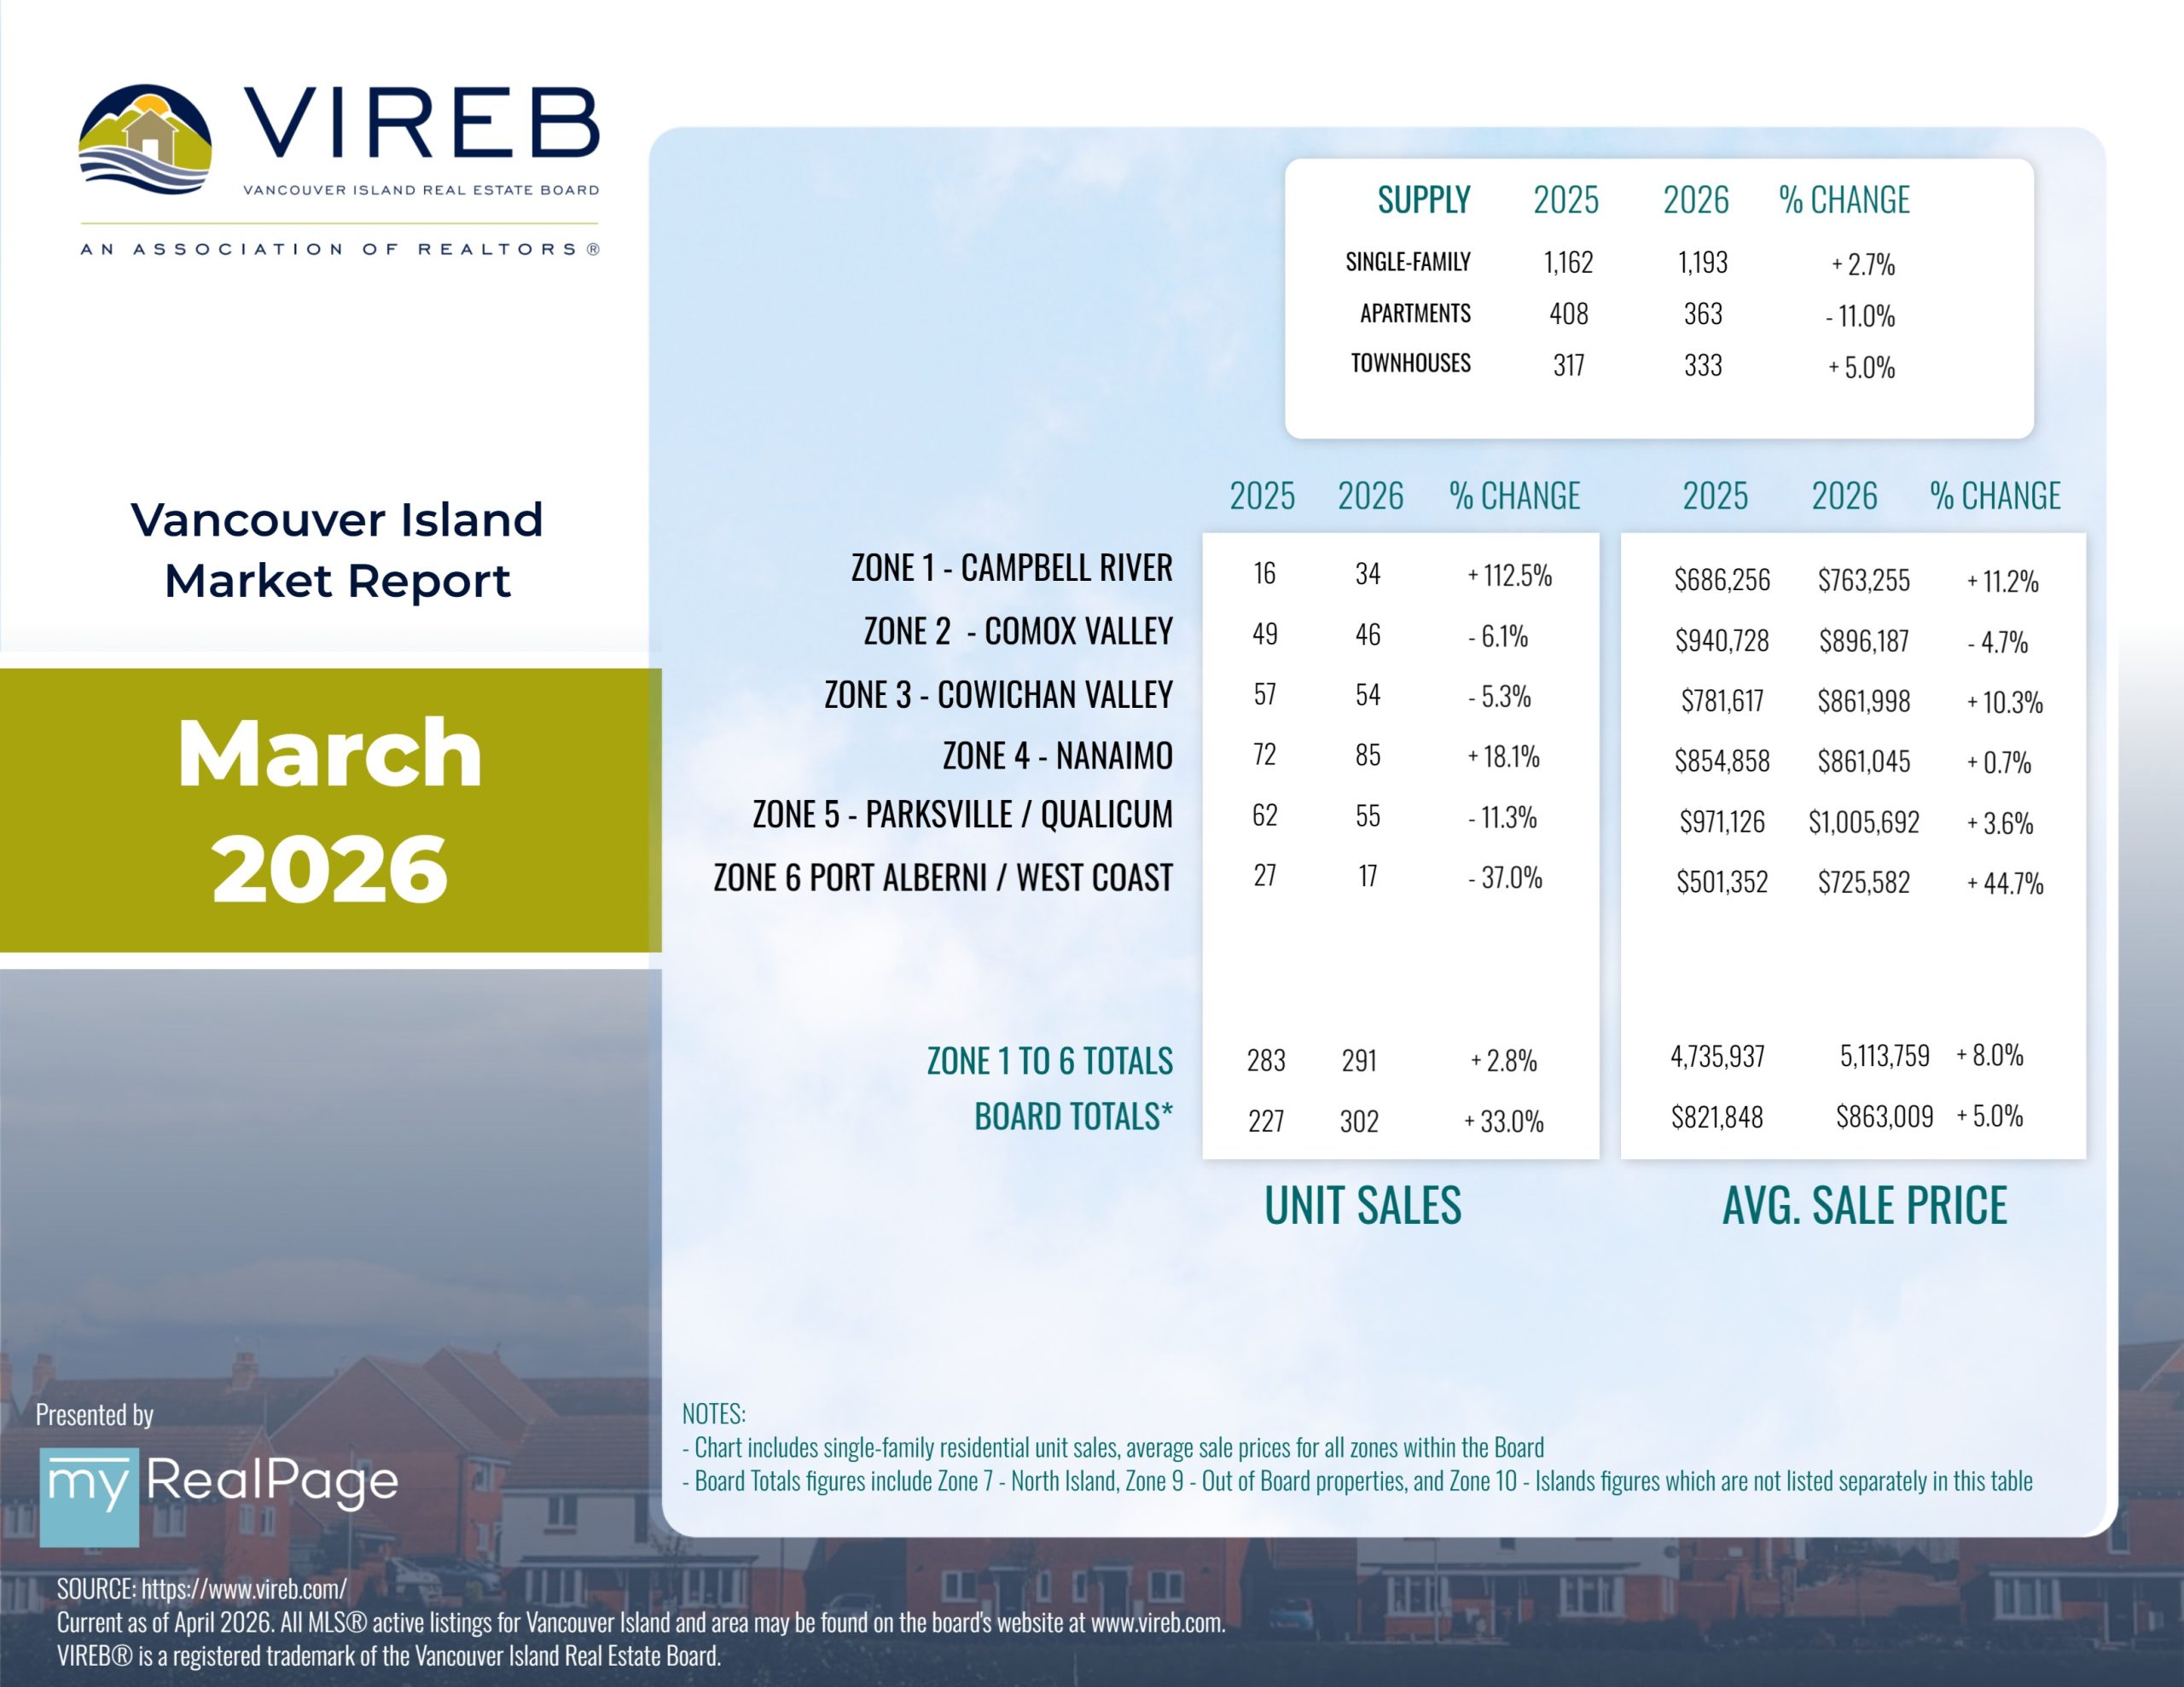
he Vancouver Island Real Estate Board (VIREB) recorded 636 unit sales (all property types) in March 2026, up one per cent from one year ago. Year-over-year active listings (all property types) were 3,776, up two per cent from the previous year.
In the single-family category (excluding acreage and waterfront), 302 homes sold in March 2026, up two per cent from one year ago and an increase of 32 per cent from February 2026. Sales of condo apartments last month came in at 72, decreasing by 15 per cent year over year and up 53 per cent from February. In the row/townhouse category, 71 units changed hands in March, down three per cent from one year ago and up 29 per cent from February.
Active listings of single-family homes were 1,193 in March, up from 1,162 one year ago. VIREB’s inventory of condo apartments was 363 last month, down from the 408 properties listed in March 2025. There were 333 row/townhouses for sale last month compared to 317 the previous year.
Read the full report on VIREB website!
The following data is a comparison between March 2026 and March 2025 numbers, and is current as of April 2026. Click here to check out last month’s infographics.
You can also view all our VIREB infographics by clicking here.
Download Printable Version – March 2026 VIREB Market Report
Last Updated on April 6, 2026 by myRealPage
