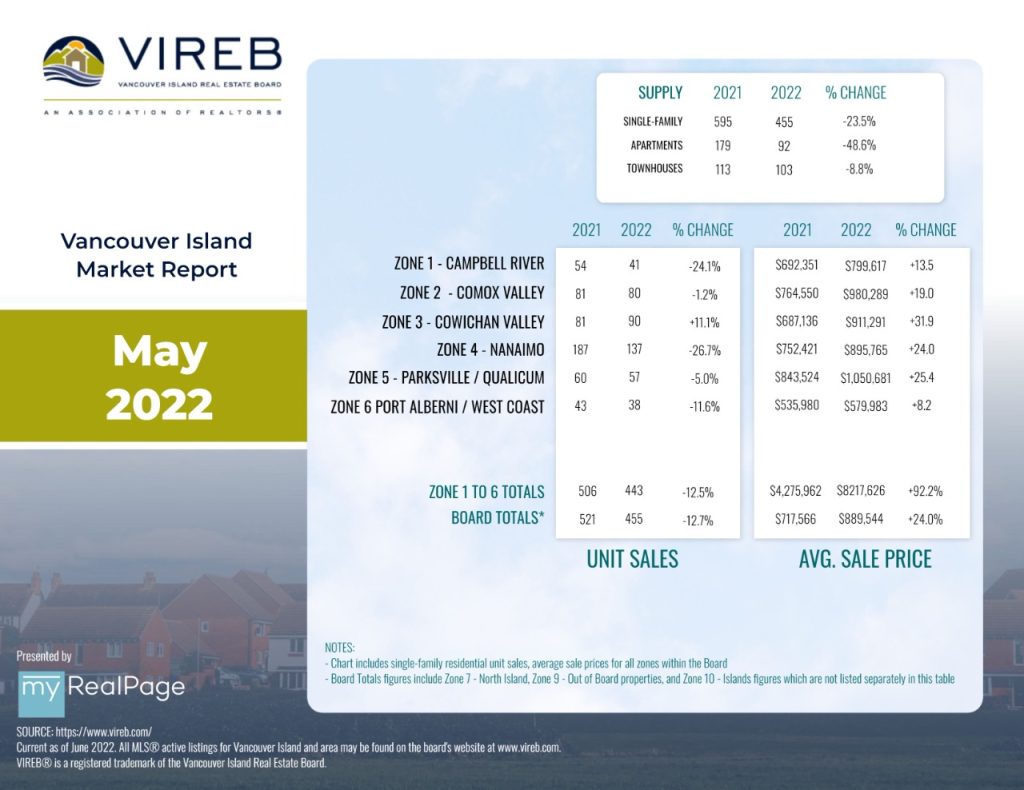
INFOGRAPHICS: May 2022 VIREB Vancouver Island Market Reports

MARKET SHIFTING AMIDST LIGHTER DEMAND AND MORE INVENTORY
The Vancouver Island Real Estate Board (VIREB) housing market appears to be shifting
amidst lighter demand and increased inventory.
Last month, active listings of single-family homes (not acreage or waterfront) climbed by 64 percent from May 2021 and 34 percent from April of this year. VIREB’s inventory of condo apartments in May was 28 per cent higher than one year ago and increased by 32 per cent from April. Row/townhouse inventory rose by 49 per cent year over year and 12 per cent from April.
The increased inventory is good news for buyers, giving them more options to choose from and easing the pressure to move too quickly when making an offer. However, the market still favours sellers, and balanced conditions seem to be some distance away. According to the British Columbia Real Estate Association (BCREA), it will take a substantial decline in demand to return active listings on Vancouver Island to a healthy state.
Read the full report on VIREB website!
The following data is a comparison between May 2022 and May 2021 numbers, and is current as of June 2022. Click here to check out last month’s infographics.
You can also view all our VIREB infographics by clicking here.
Download Printable Version – May 2022 VIREB Market Report
Last Updated on July 25, 2022 by myRealPage


