INFOGRAPHICS: February 2026 VREB Victoria Market Reports

Victoria Real Estate Market Report for February 2026
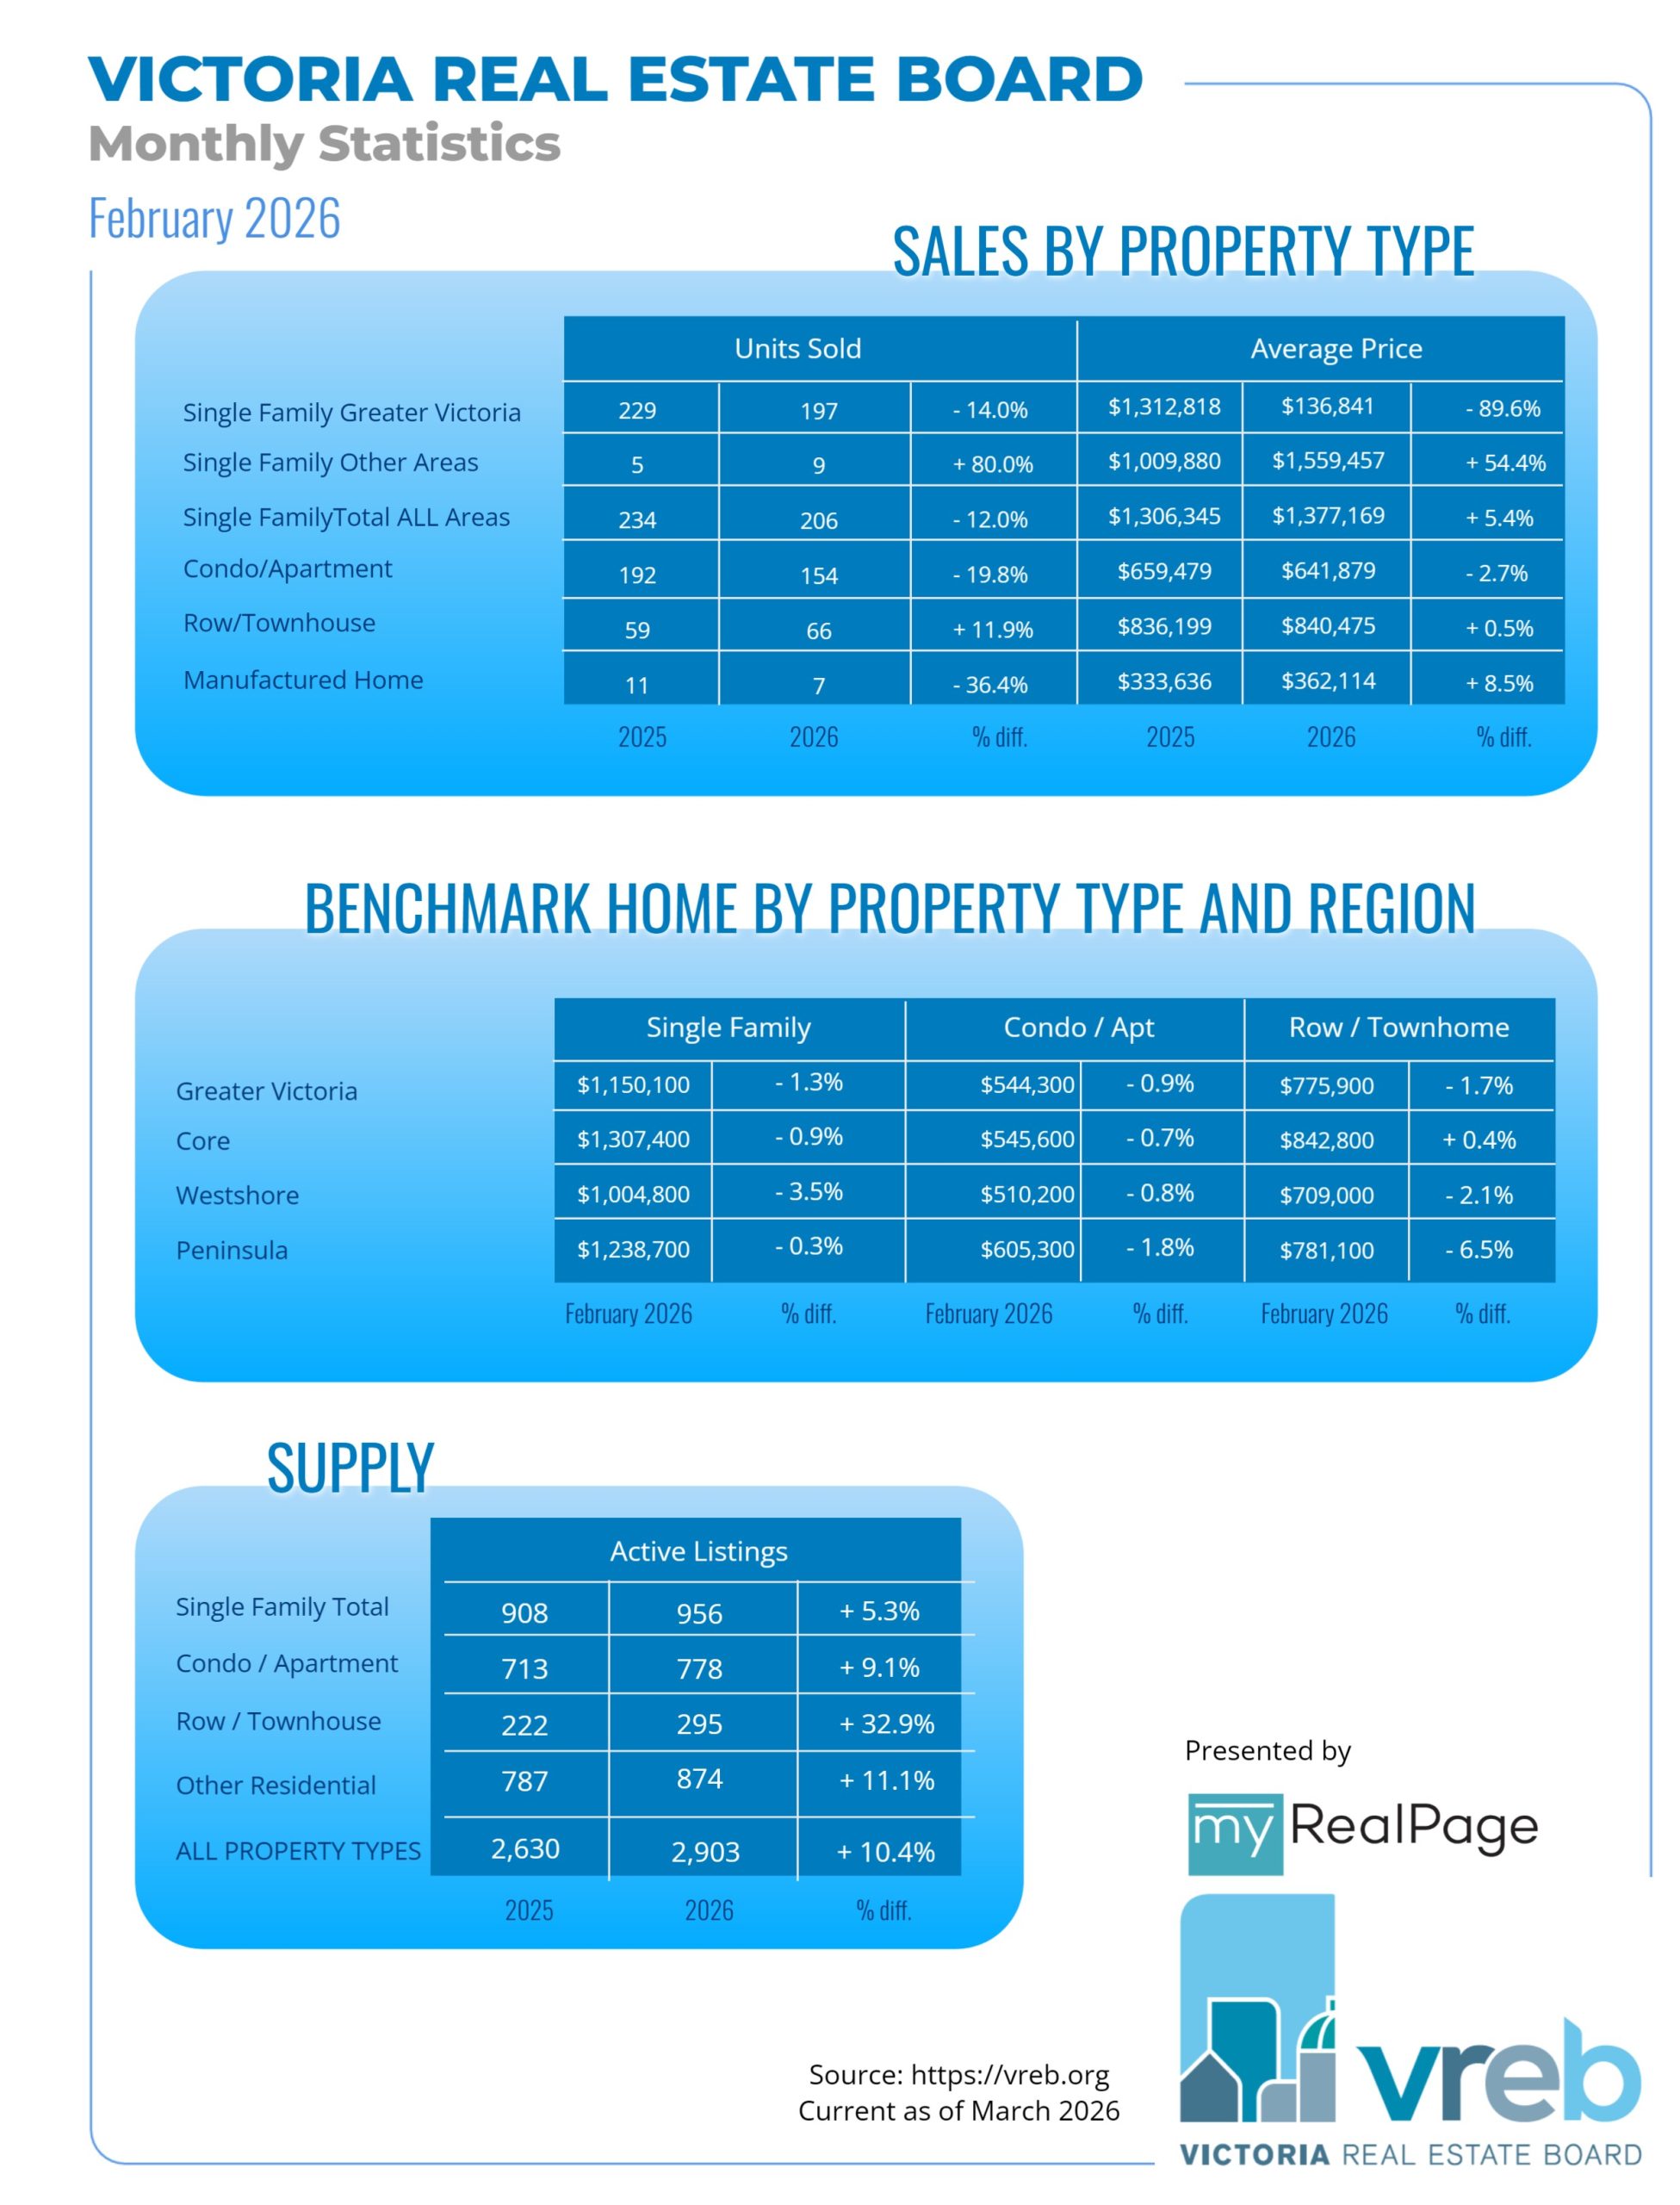
A total of 465 properties sold in the Victoria Real Estate Board region this February, 11.9 per cent fewer than the 528 properties sold in February 2025 and 37.2 per cent more than in January 2026. Sales of condominiums decreased by 19.8 per cent from February 2025 with 154 units sold. Sales of single family homes decreased by 12 per cent from February 2025 with 206 sold.
“February’s sales definitely picked up the pace compared with sales from the previous month,” said Victoria Real Estate Board Chair Fergus Kyne. “Though our sales numbers are lower than they were in 2025, with an over 35 per cent increase month over month, and a very healthy amount of inventory currently available, it will be interesting to see how our spring market unfolds in the upcoming months.”
There were 2,903 active listings for sale on the Victoria Real Estate Board Multiple Listing Service® at the end of February 2026, an increase of 10.6 per cent compared to the previous month of January and a 10.4 per cent increase from the 2,630 active listings for sale at the end of February 2025.
Read the full report on VREB website!
The following data is a comparison between February 2026 and February 2025 numbers, and is current as of March 2026. Click here to check out last month’s figures!
You can also follow this link for all our Victoria Board monthly infographics!
Click on the images for a larger view!
Download Printable Version – February 2026 VREB, Victoria Market Report
Last Updated on March 5, 2026 by myRealPage
