INFOGRAPHICS: January 2026 VREB Victoria Market Reports

VREB report for January 2026
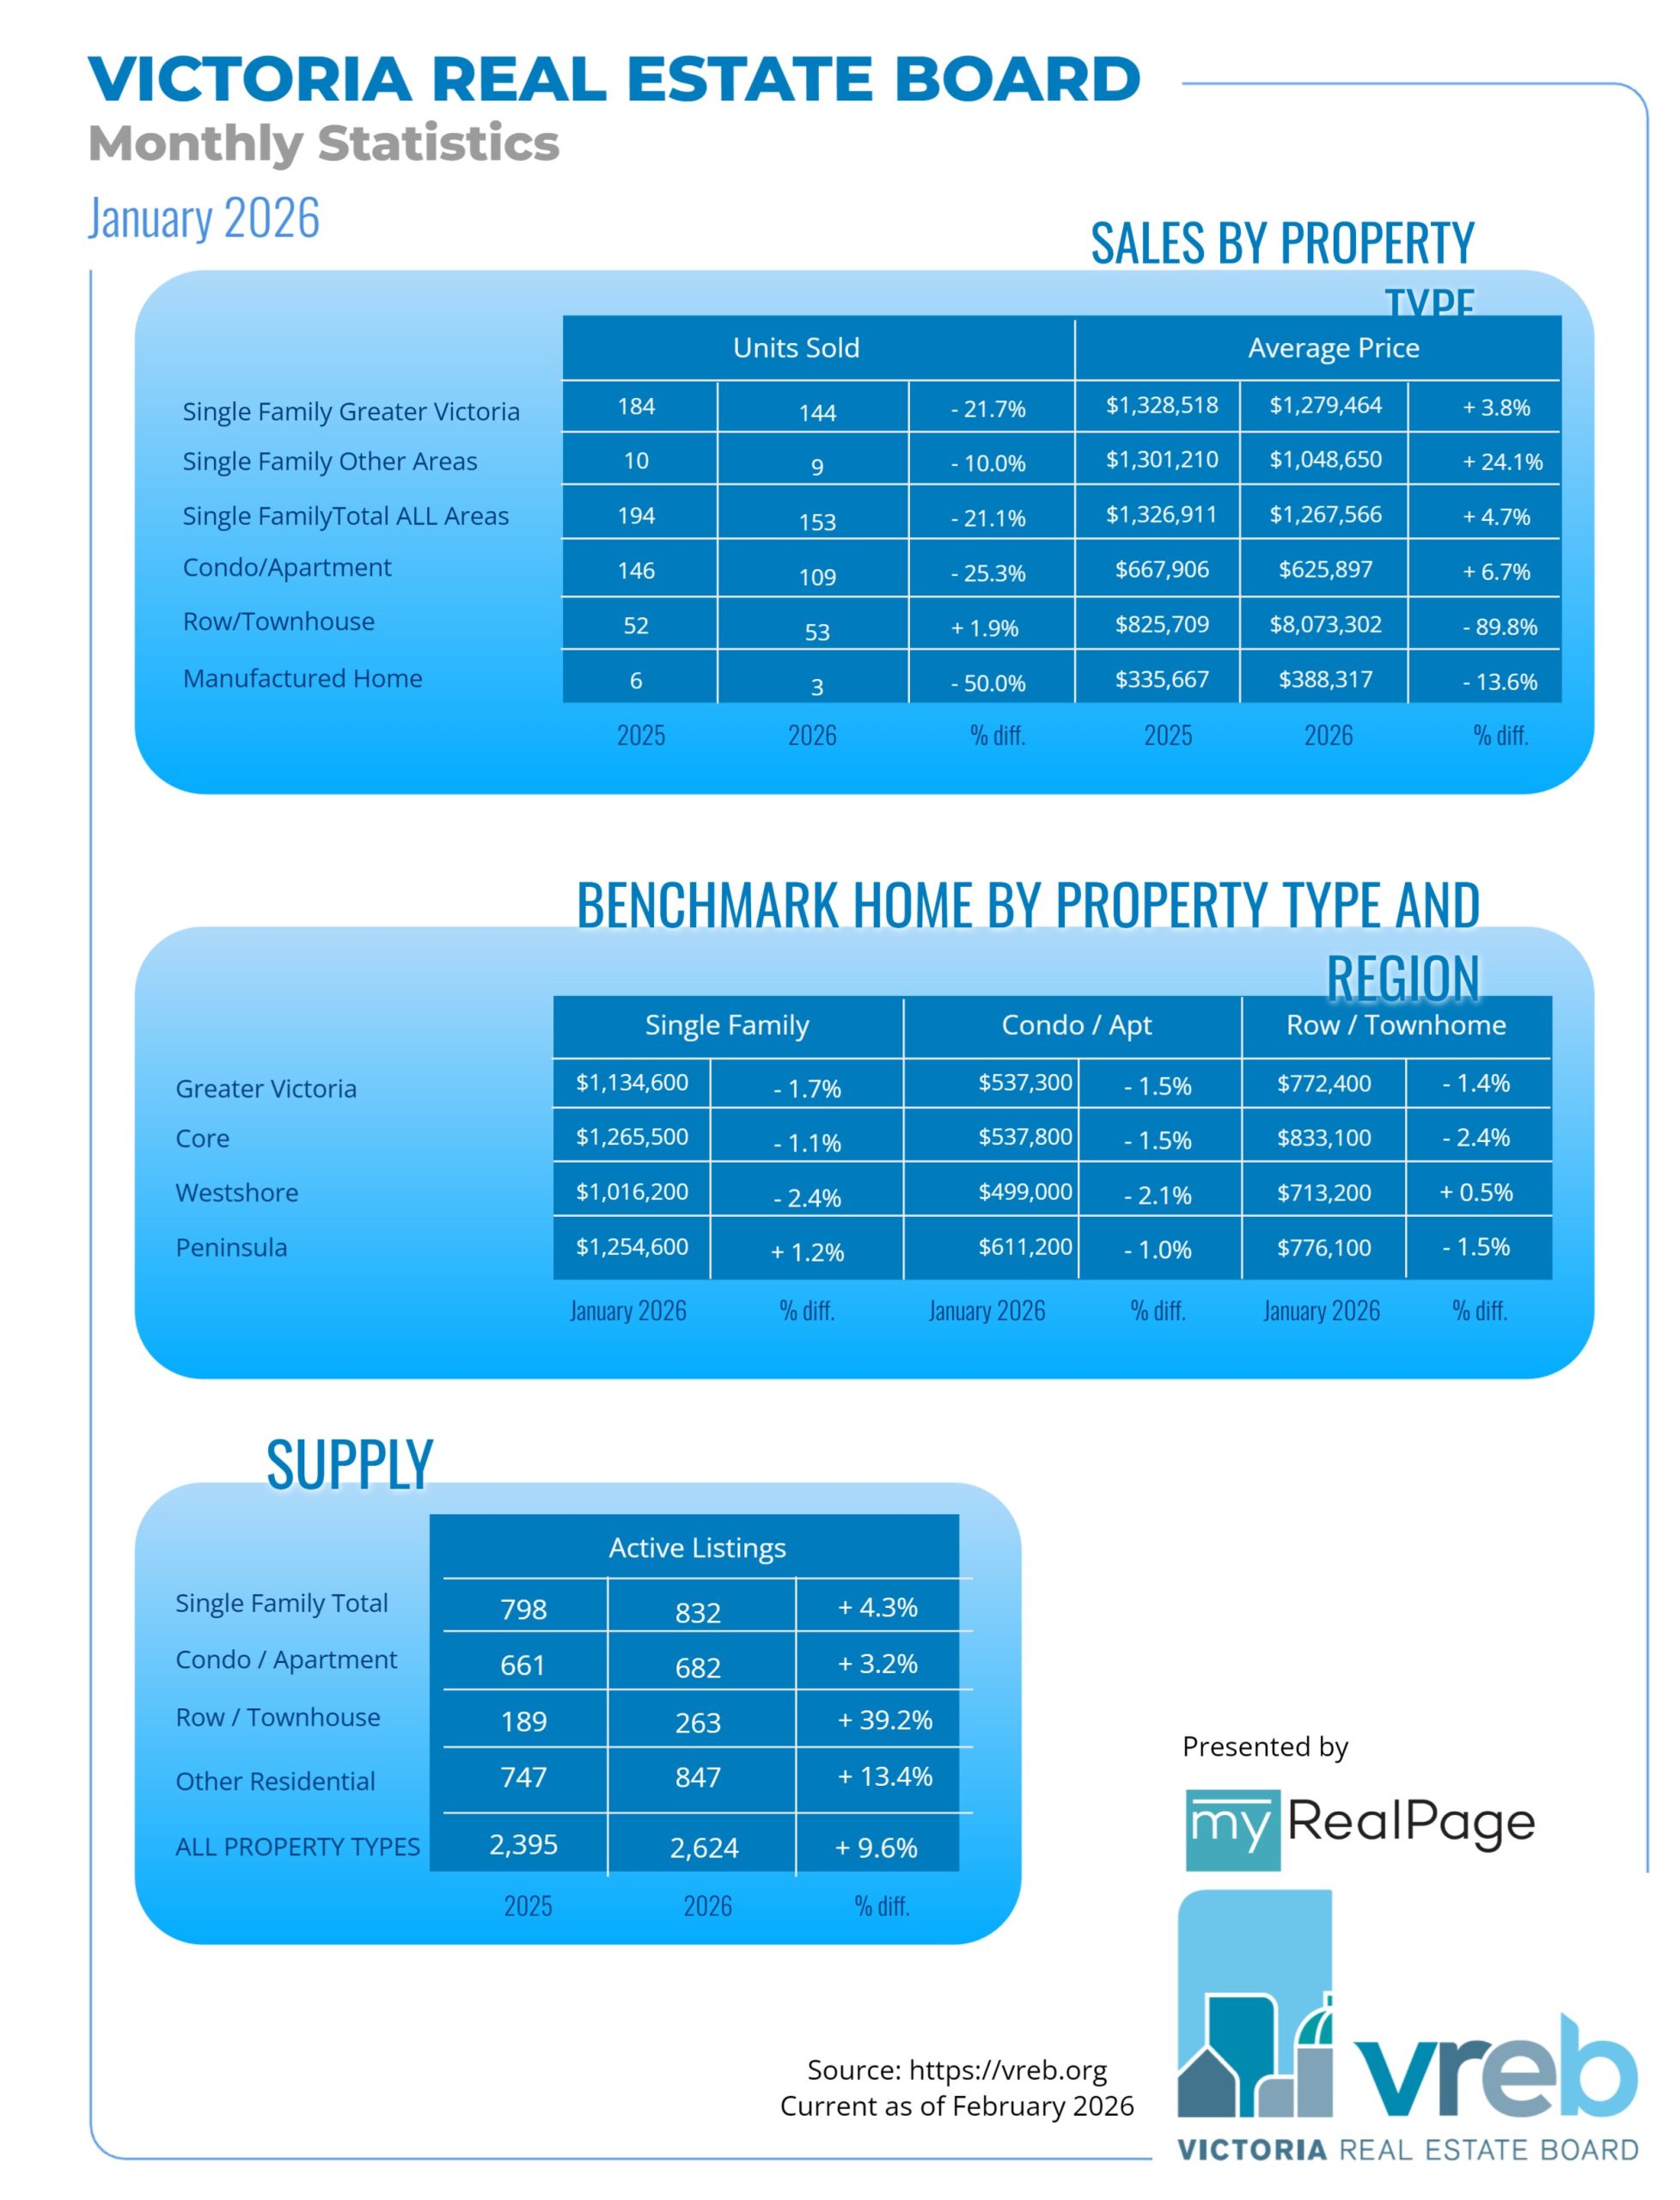
A total of 339 properties sold in the Victoria Real Estate Board region this January, 19.7 per cent fewer than the 422 properties sold in January 2025 and 7.6 per cent fewer than in December 2025. Sales of condominiums decreased by 25.3 per cent from January 2025 with 109 units sold. Sales of single family homes decreased by 21.1 per cent from January 2025 with 153 sold.
“This year kicked off with sales in a similar pattern to what we observed in 2023 and ‘24,” said Victoria Real Estate Board Chair Fergus Kyne. “Those years signalled the return to more predictable, seasonal patterns after the intense pace of the pandemic-influenced market we saw earlier in the decade. Different this year is that there is much more inventory on the market. Healthy levels of inventory that meet demand are critical to smooth out any upward pressure on pricing. As we move through the year, it may well be inventory levels and a combination of external factors like interest rates, global trade tensions, and consumer confidence that ultimately determine the course for our
market.”
There were 2,624 active listings for sale on the Victoria Real Estate Board Multiple Listing Service® at the end of January 2026, an increase of 3.1 per cent compared to the previous month of December and a 9.6 per cent increase from the 2,395 active listings for sale at the end of January 2025.
Read the full report on VREB website!
The following data is a comparison between January 2026 and January 2025 numbers, and is current as of February 2026. Click here to check out last month’s figures!
You can also follow this link for all our Victoria Board monthly infographics!
Click on the images for a larger view!
Download Printable Version – January 2026 VREB, Victoria Market Report
Last Updated on February 23, 2026 by myRealPage
