INFOGRAPHICS: November 2018 RAE Edmonton Market Reports

Here are the latest housing market numbers for areas covered by the REALTORS Association of Edmonton (RAE)!
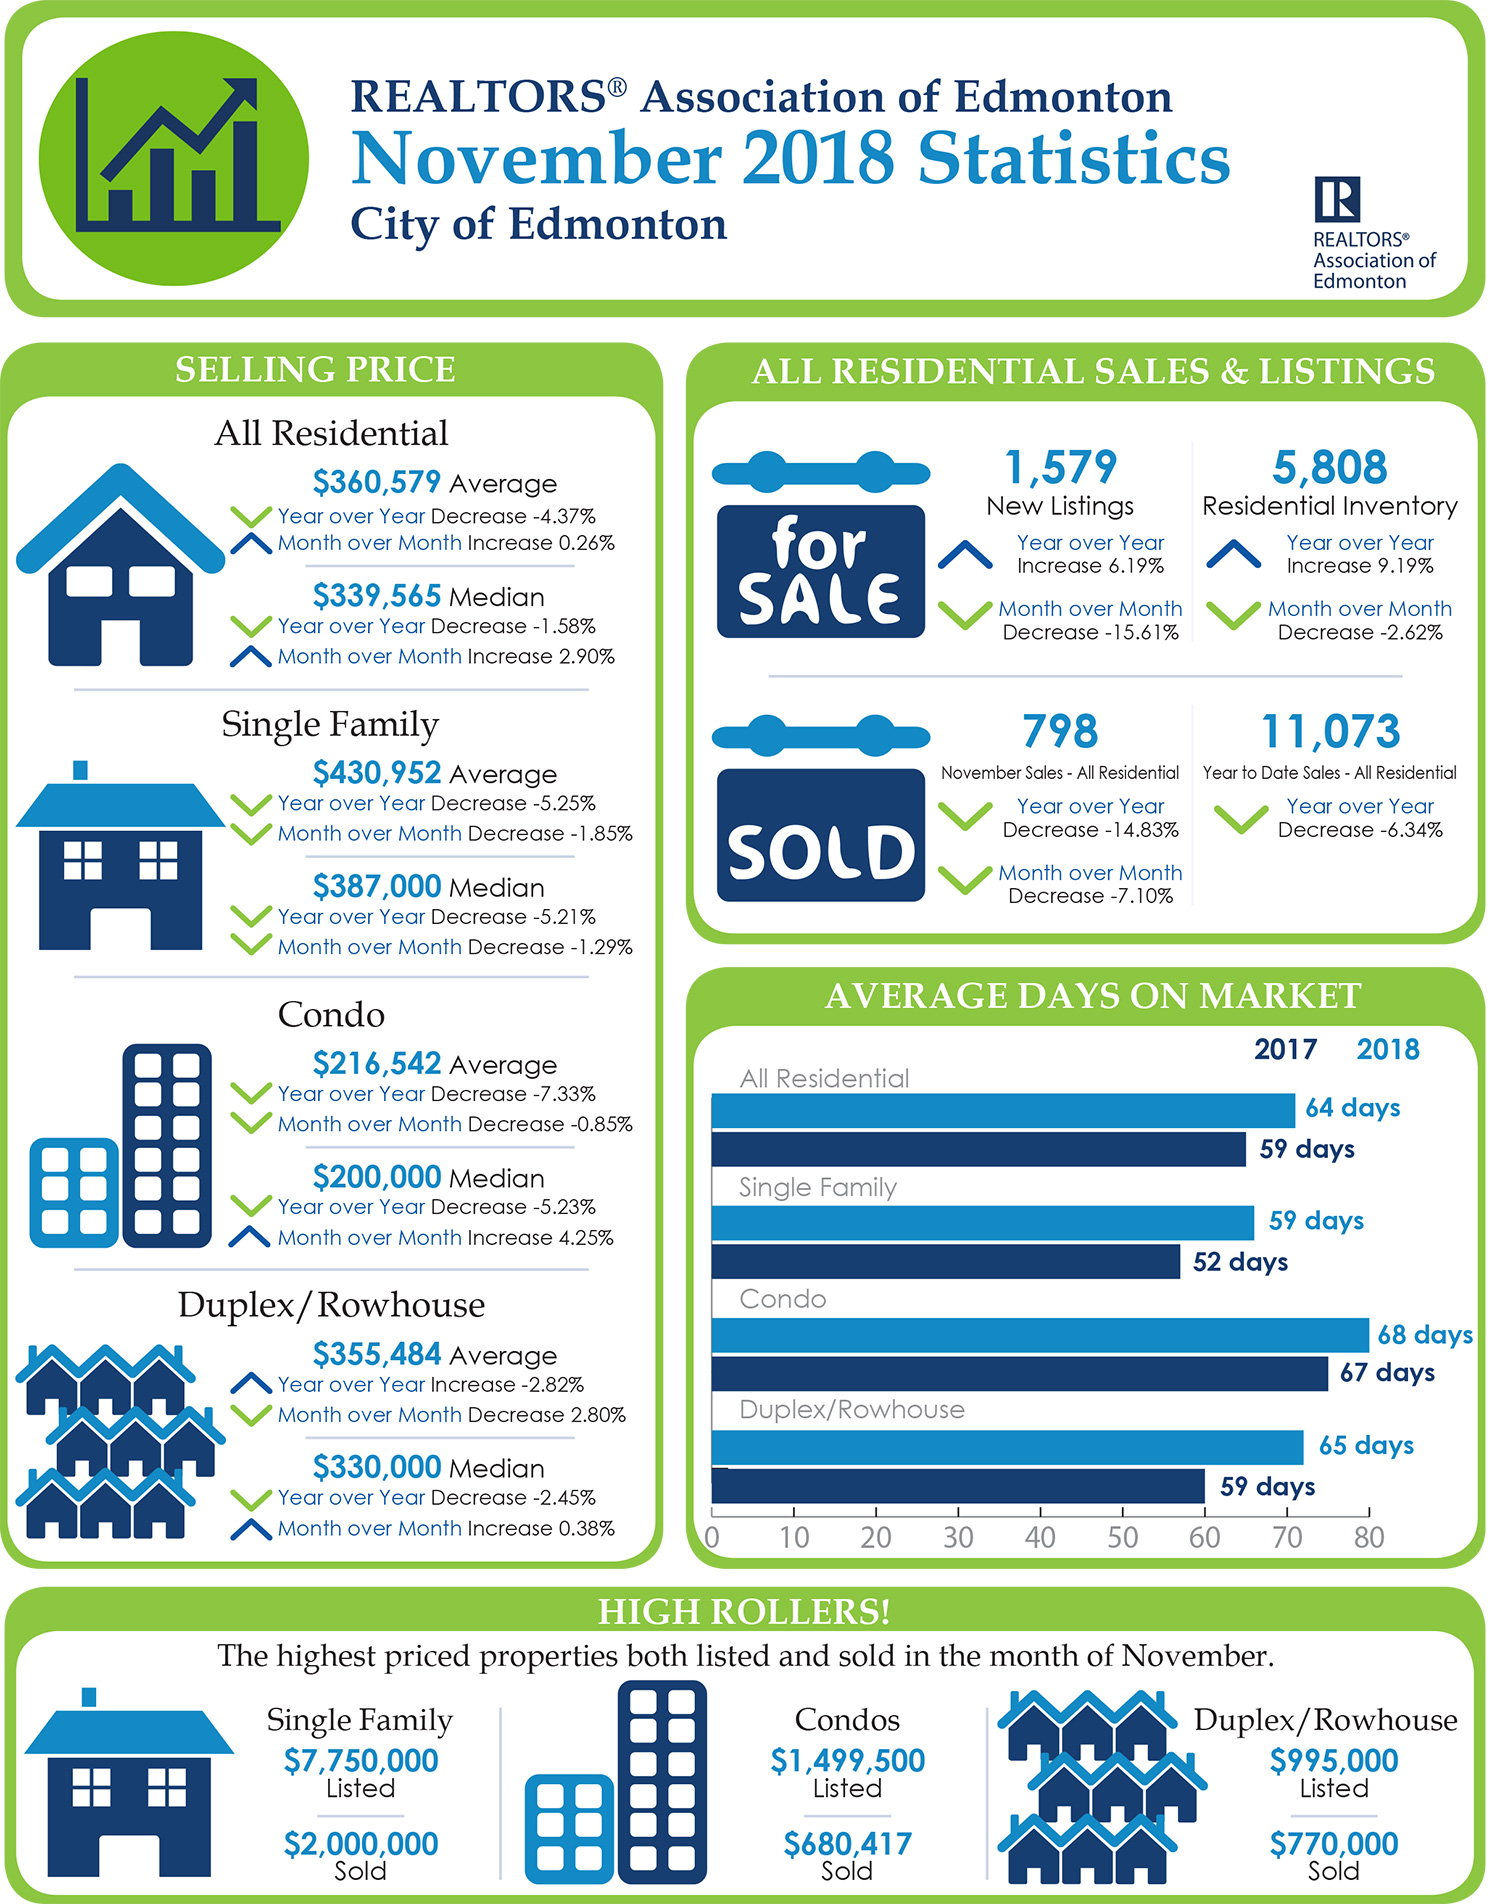
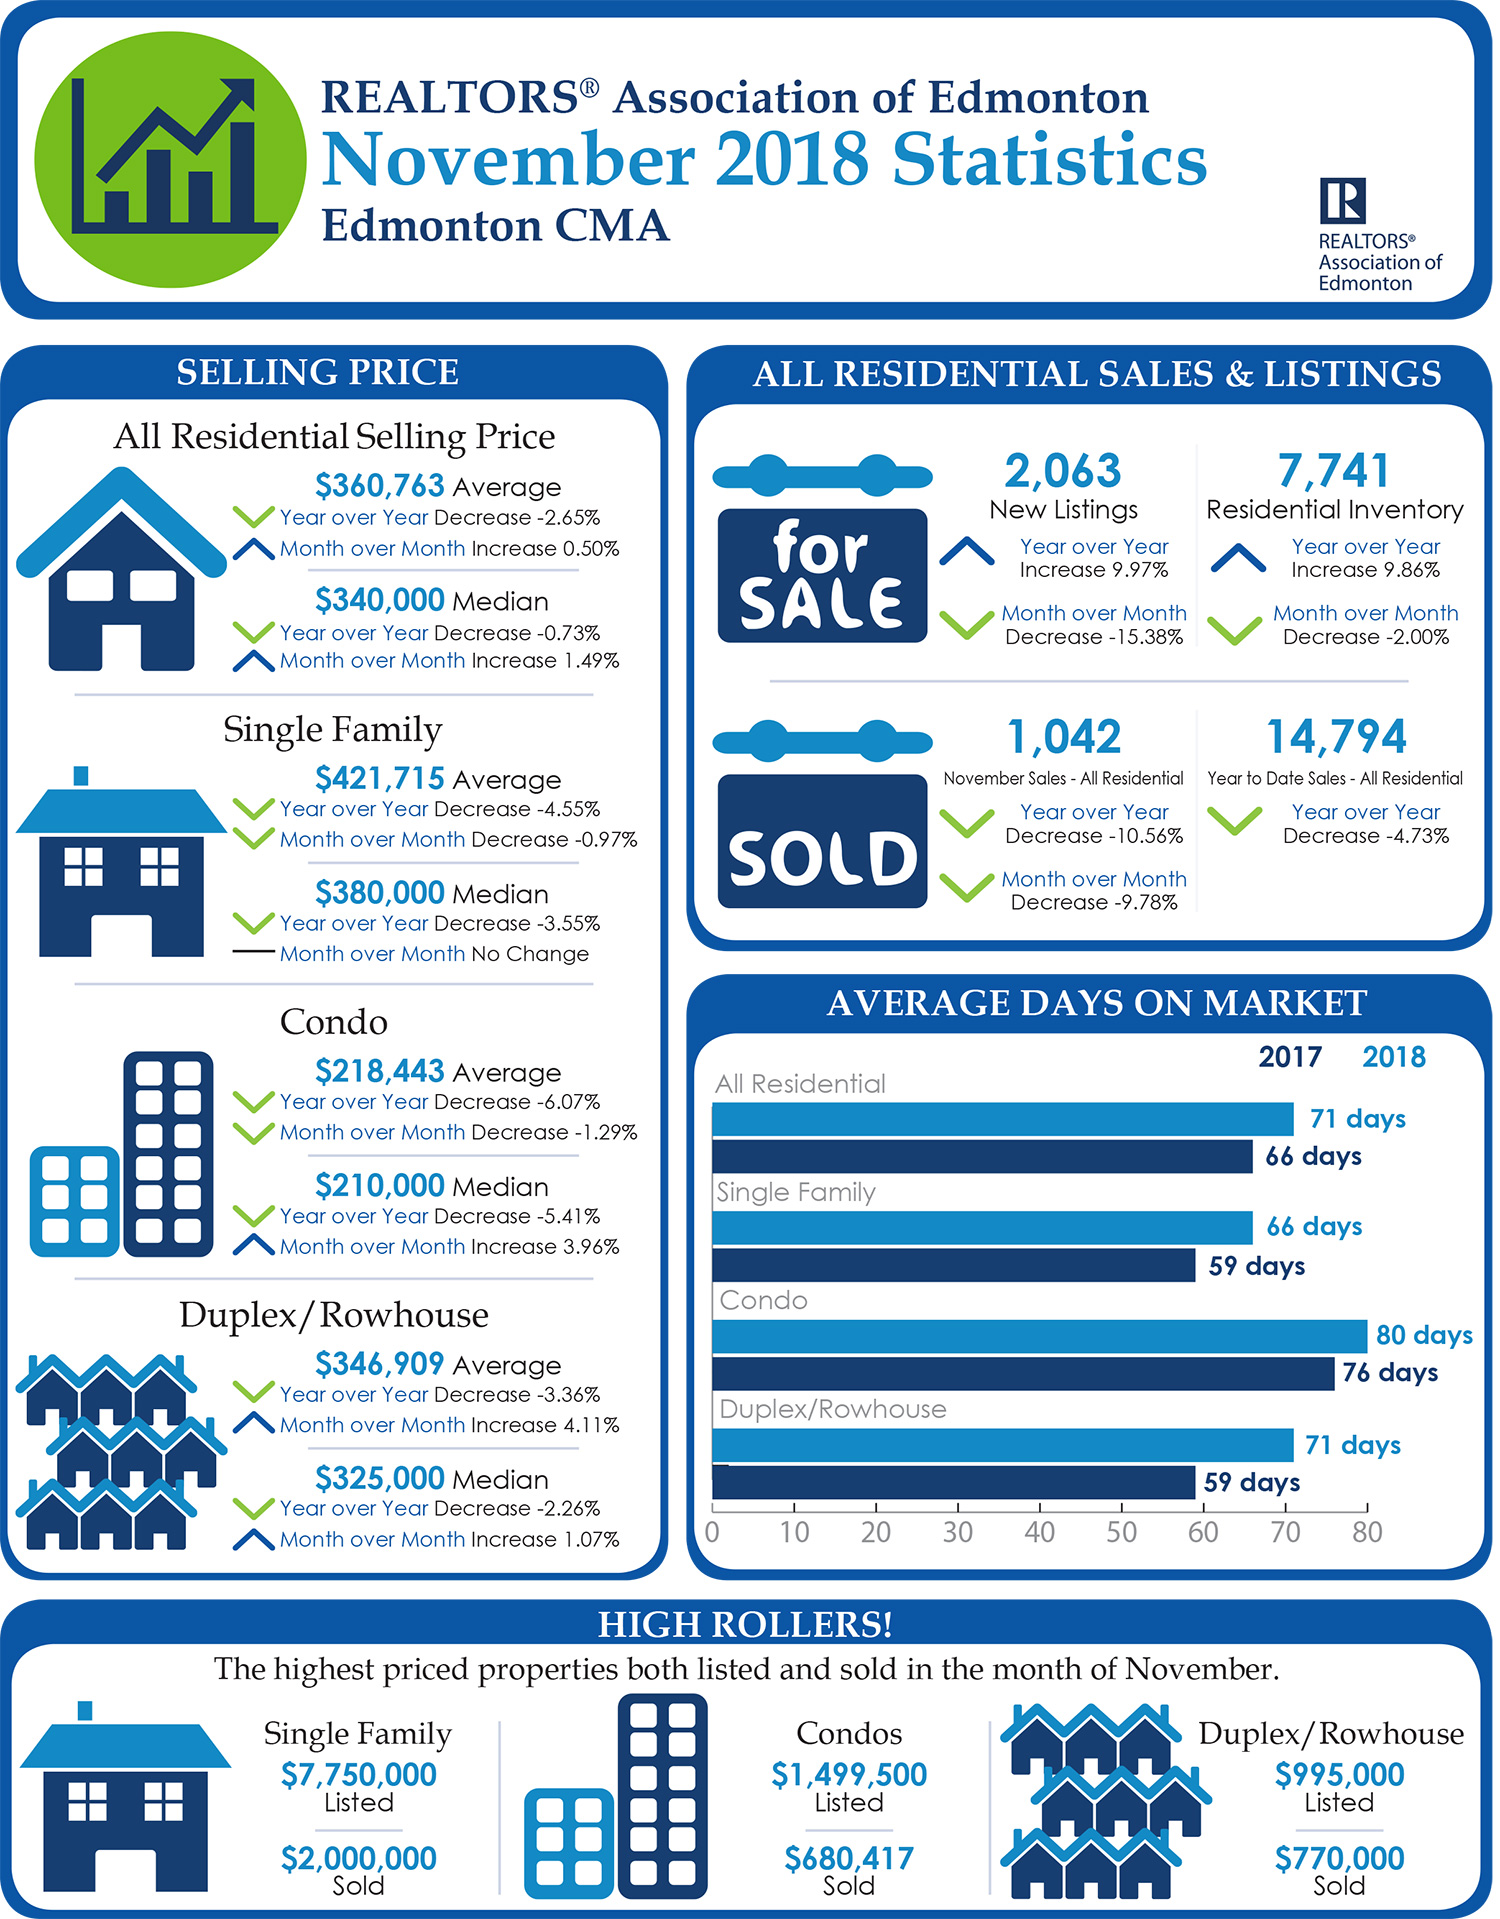
As RAE has mentioned in their most recent market update, inventory is up, while residential unit sales and prices are down within the Edmonton Census Metropolitan Area (CMA).
All residential unit sales decreased 9.78% month-over-month, and decreased 10.56% year-over-year.
Meanwhile, new listings and active inventory are both up when compared to November 2017, with new listings showing a 9.97% increase, and inventory up by 9.86%. However listings and inventory have both gone down, when compared to October 2018, showing decreases of 15.38% and 2% respectively.
According to RAE Chair Darcy Torhjelm,
“Compared to 2017, listings and inventory are increasing, which means there is plenty for buyers to choose from this year. As we close out the year, average prices are decreasing slightly, likely due to the slower winter sales season and higher inventory levels, so sellers will need to be patient and flexible when it comes time to negotiate.”
The following data is a comparison between November 2017 and November 2018 numbers, and is current as of December 2018.
Please note that the numbers in these infographics do not include residential properties in other categories such as vacant lots, parking spaces, mobile homes, etc.
For last month’s numbers, check out our previous RAE infographic!
You can also click here to view all our Edmonton inforgraphics.
Click on the images for a larger view!
(Protip: Make sure to grab the printable PDF versions, too! It fits best when printed on A4-sized sheets, AND we’ve added an area on the sheet where you can attach your business card! 🙂 )
Download Printable Version – November 2018 RAE, Edmonton Report

(Image Source: RAE Website)
(Image Source: RAE Website)
Last Updated on July 25, 2022 by myRealPage
