INFOGRAPHICS: October 2018 RAE Edmonton Market Reports

You asked for it, so you got it. 🙂
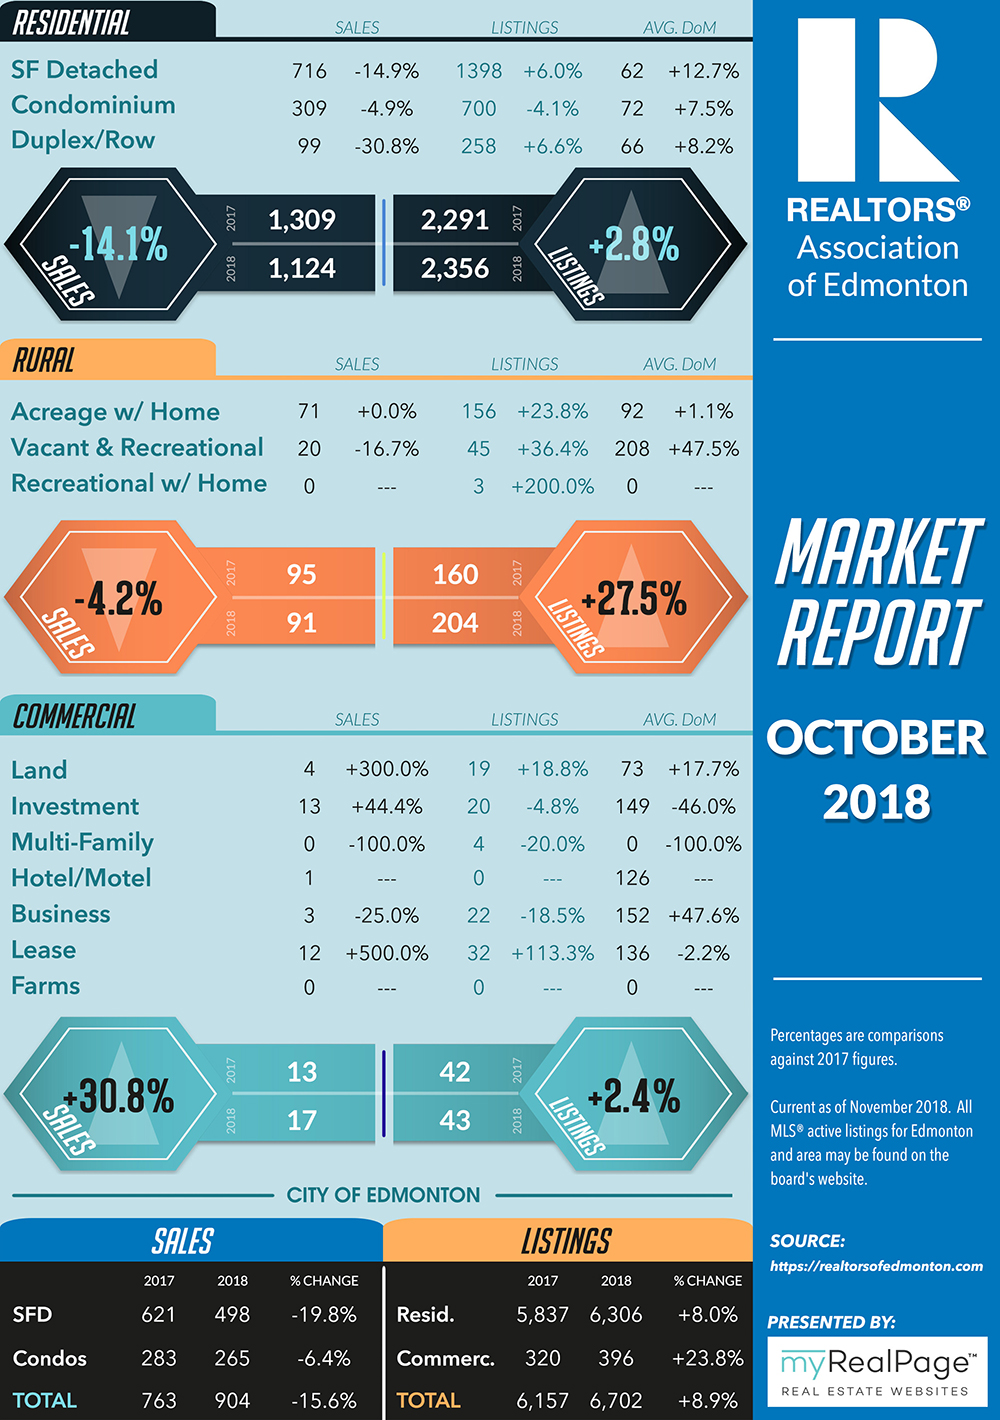
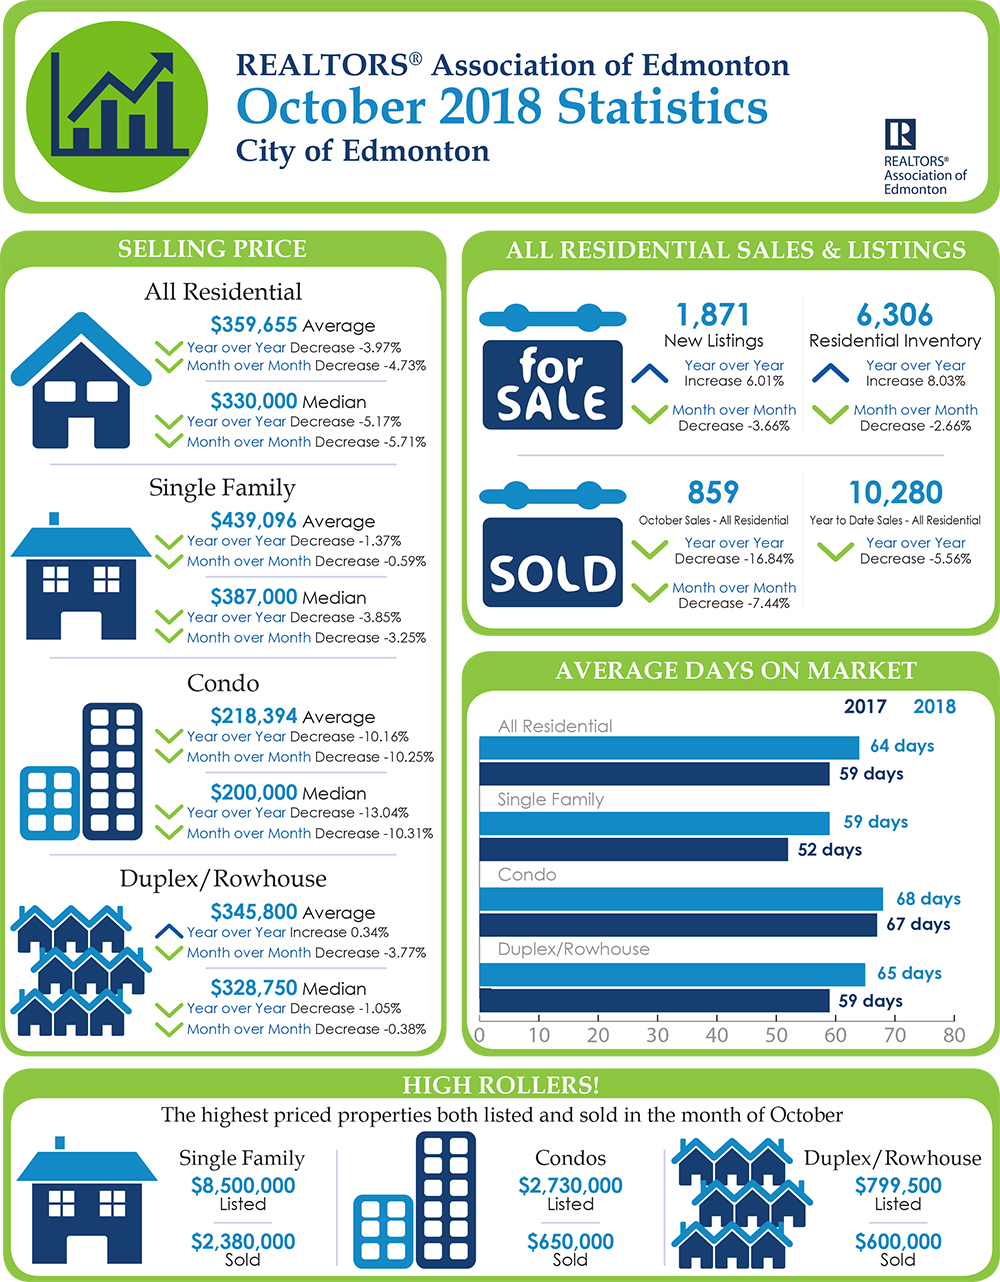
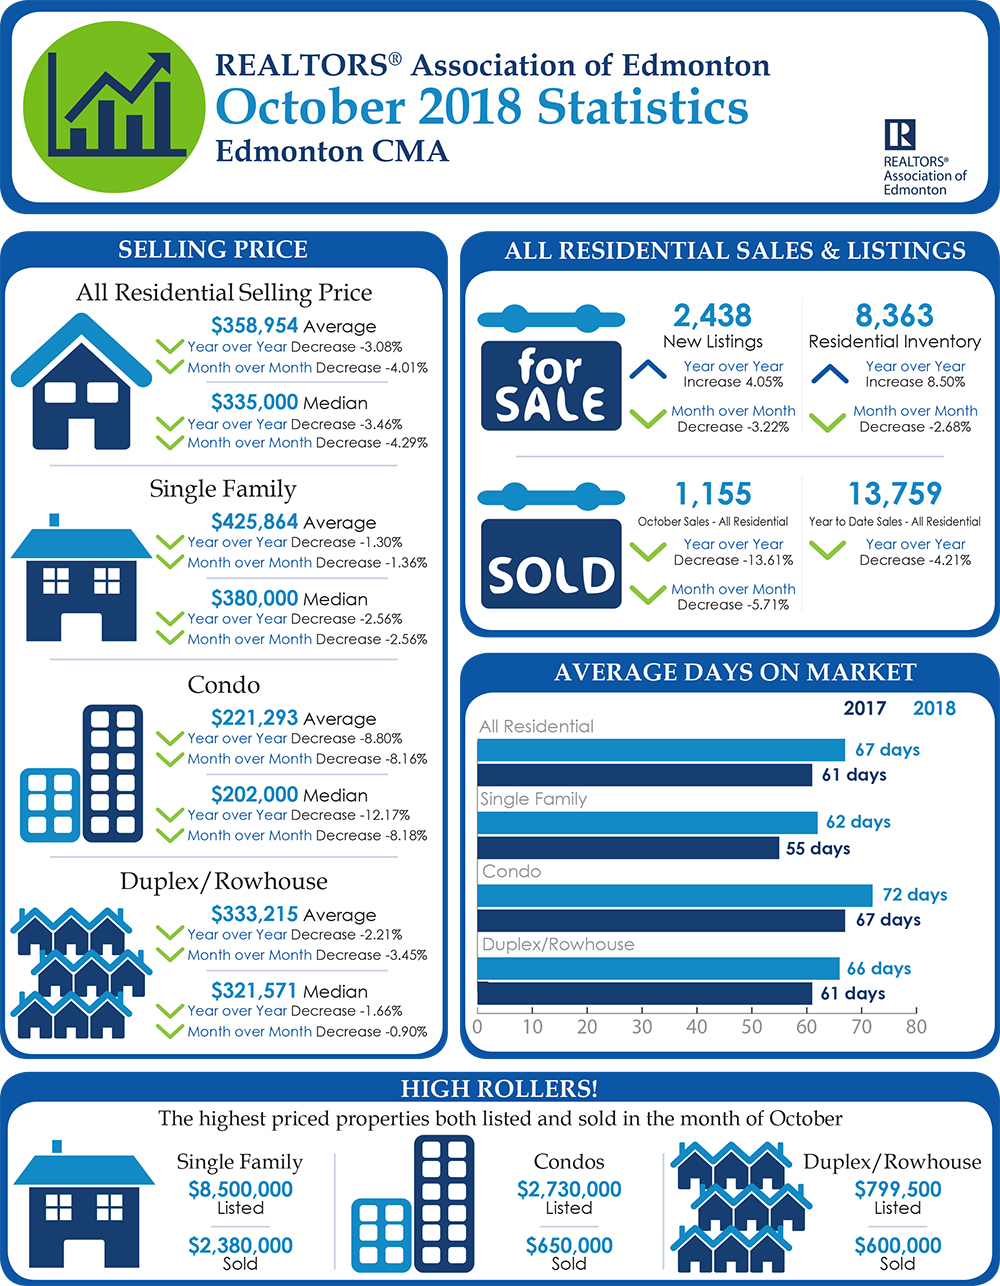
Here’s the October 2018 Market Report for areas covered by the Realtors Associations of Edmonton (RAE).
According to their most recent press release, year over year residential unit sales, as well as average prices have decreased in the past month.
In a statement by RAE Chair Darcy Torhjelm,
“Some of the market decreases are a result of slower sales coupled with higher inventory and listings, as well, it is also common for both prices and sales to begin to decrease at this time of year due to seasonal market fluctuations. As we move towards the end of the year, we will likely see average days on market grow with inventory remaining higher.”
The following data is a comparison between October 2017 and October 2018 numbers, and is current as of November 2018.
Please note that the numbers in these infographics do not include residential properties in other categories such as vacant lots, parking spaces, mobile homes, etc.
Click here to view all our Edmonton inforgraphics.
Click on the images for a larger view!
(Protip: Make sure to grab the printable PDF versions, too! It fits best when printed on A4-sized sheets, AND we’ve added an area on the sheet where you can attach your business card! 🙂 )
Download Printable Version – October 2018 RAE, Edmonton Report
(Image Source: https://realtorsofedmonton.com)
(Image Source: https://realtorsofedmonton.com)
Last Updated on July 25, 2022 by myRealPage
