INFOGRAPHICS: March 2024 GVR Greater Vancouver Market Reports

Increased seller activity is giving buyers more choice this spring
The number of Metro Vancouver homes listed for sale on the MLS® rose nearly 23 per cent year-over-year, providing more opportunity for buyers looking for a home this spring.
The Greater Vancouver REALTORS® (GVR) reports that residential sales in the region totalled 2,415 in March 2024, a 4.7 per cent decrease from the 2,535 sales recorded in March 2023. This was 31.2 per cent below the 10-year seasonal average (3,512).
“If you’re finding the weather a little chillier than last spring, you may find some comfort in knowing that the market isn’t quite as hot as it was last spring either, particularly if you’re a buyer. Despite the welcome increase in inventory, the overall market balance continues inching deeper into sellers’ market territory, which suggests demand remains strong for well-priced and well-located properties.” Andrew Lis, GVR director of economics and data analytics
Read the full report on the REBGV website!
The following data is a comparison between March 2024 and March 2023 numbers, and is current as of April 2024. For last month’s update, you can check out our previous post!
Or follow this link for all our GVR Infographics!
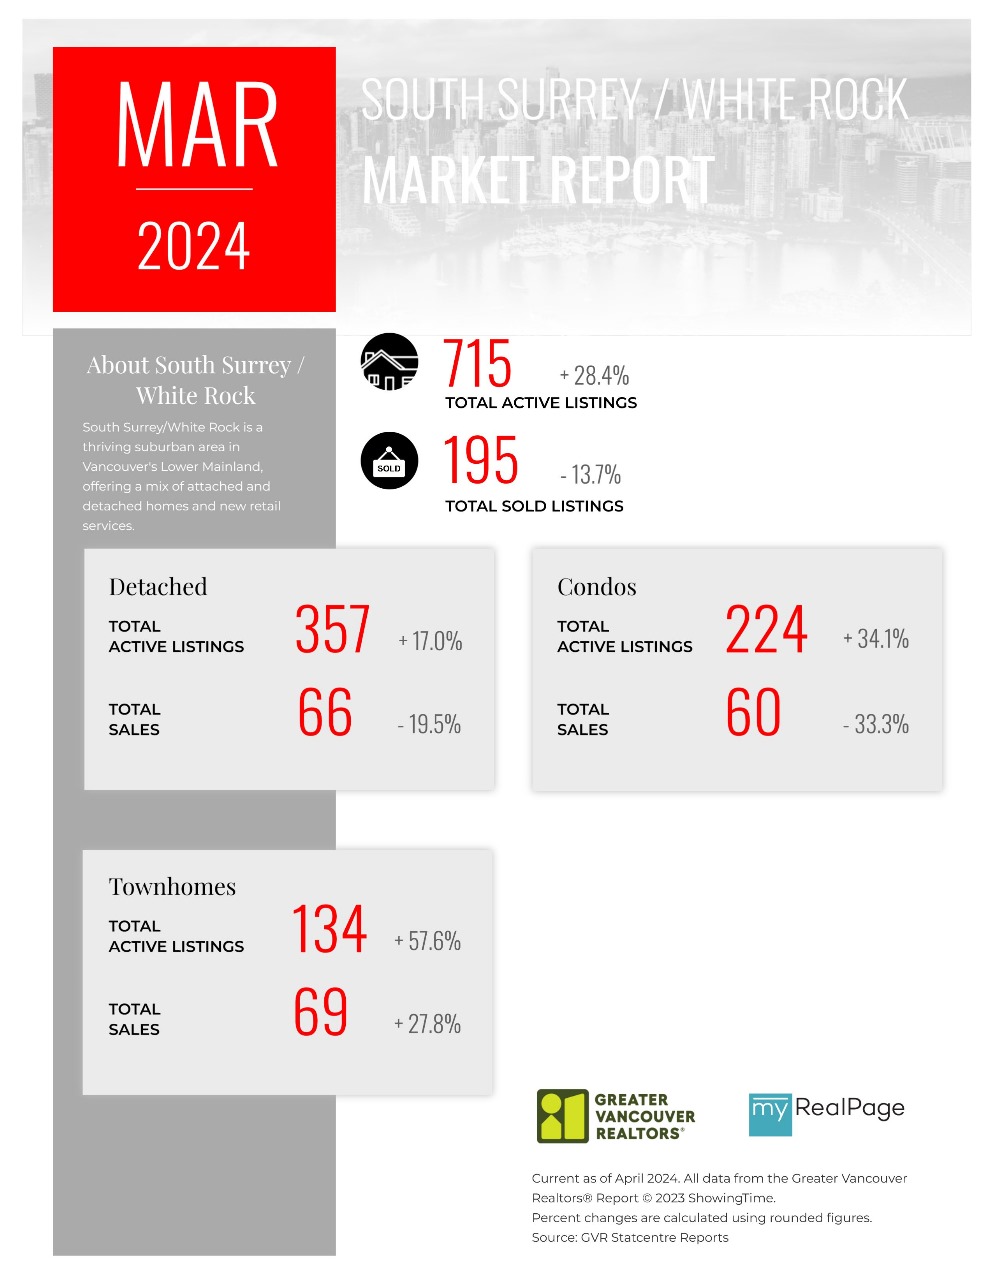
These infographics cover current trends in several areas within the Greater Vancouver region. Click on the images for a larger view!
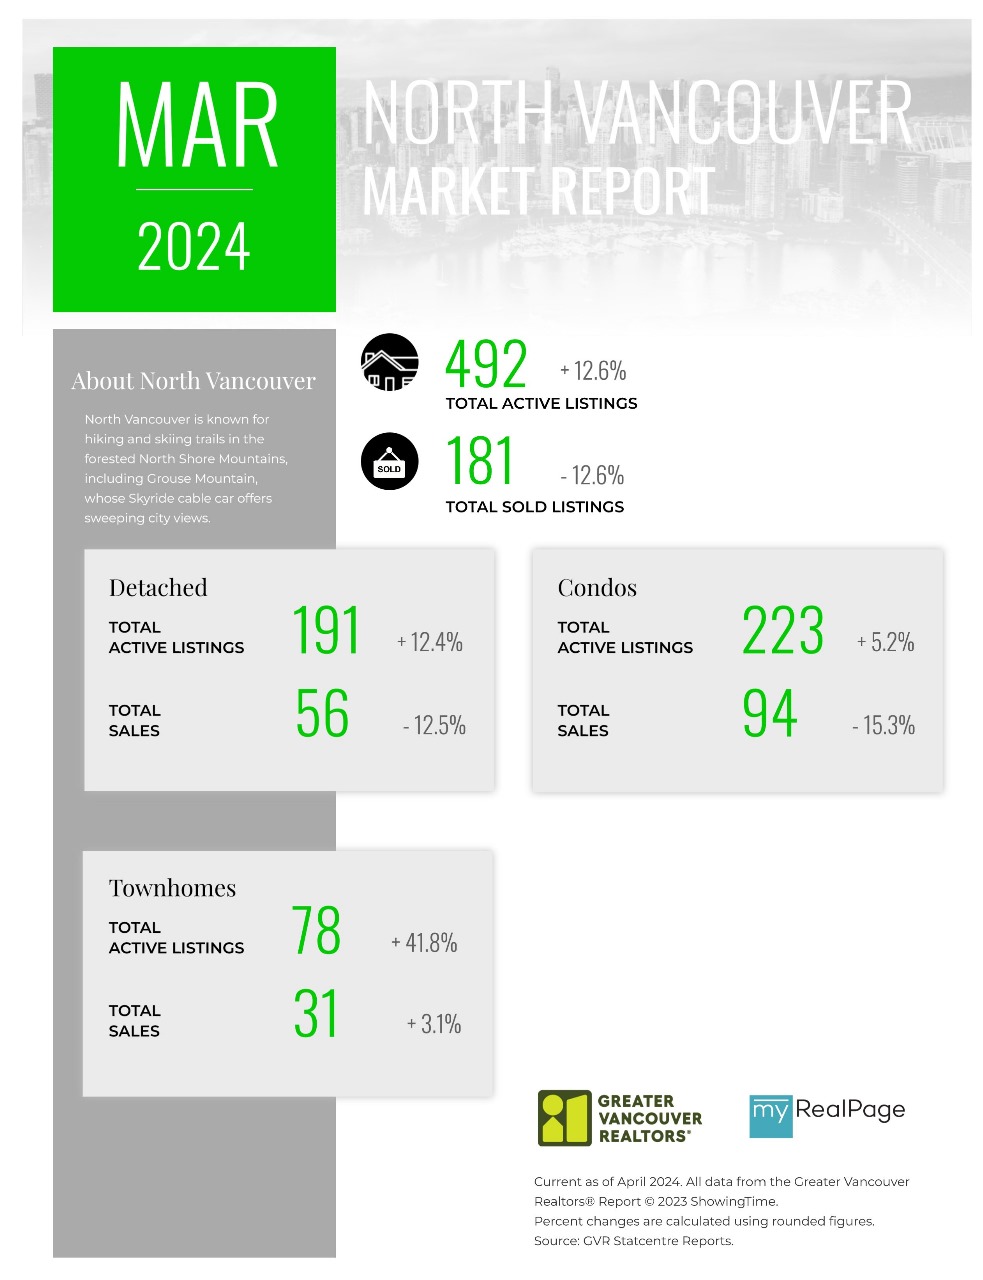
Printable Version – GVR March 2024 Data Infographic Report North Vancouver
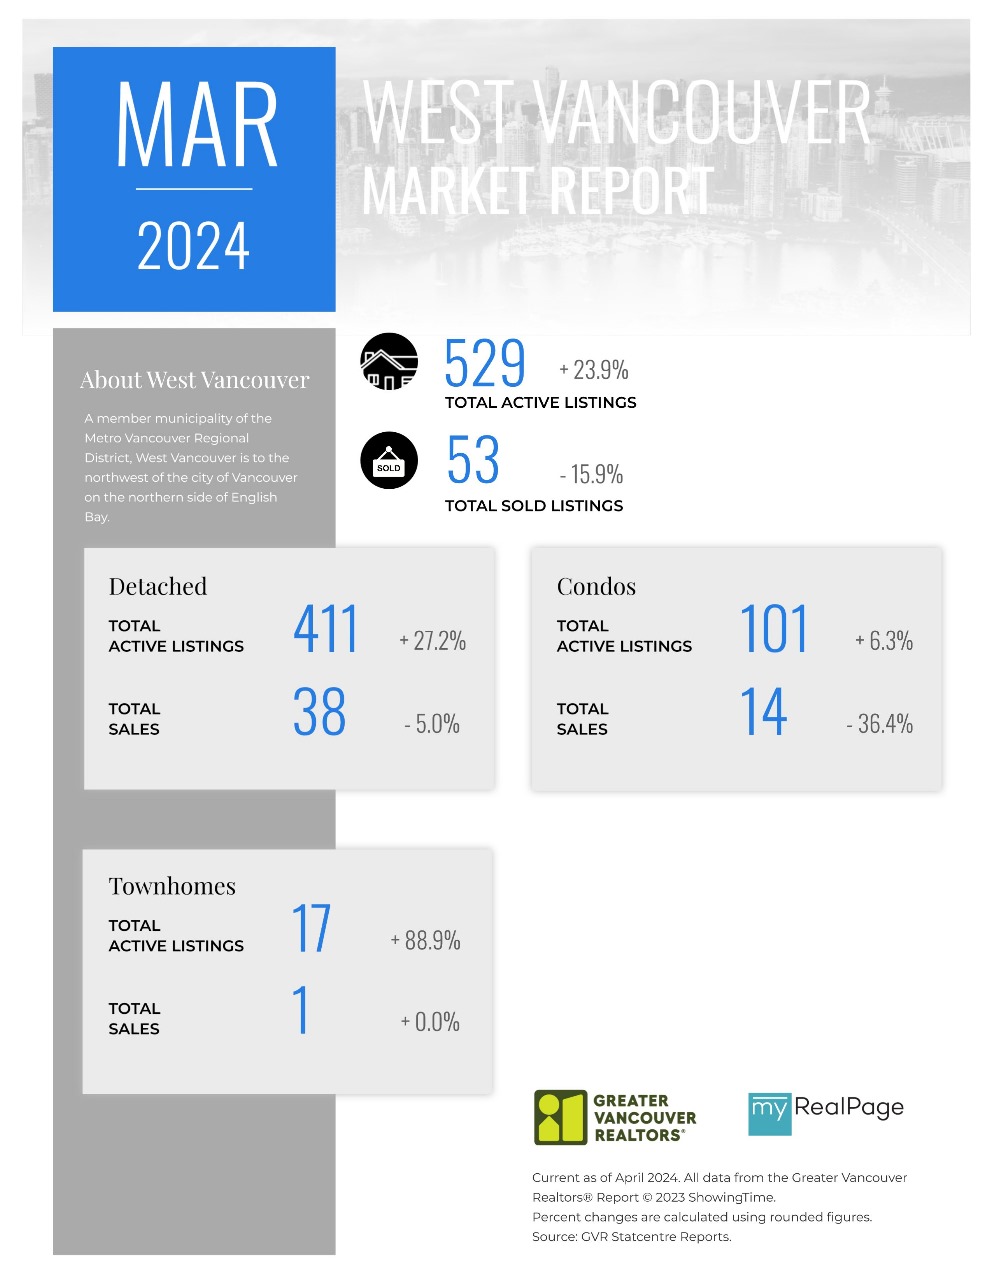
Printable Version – GVR March 2024 Data Infographics Report West Vancouver
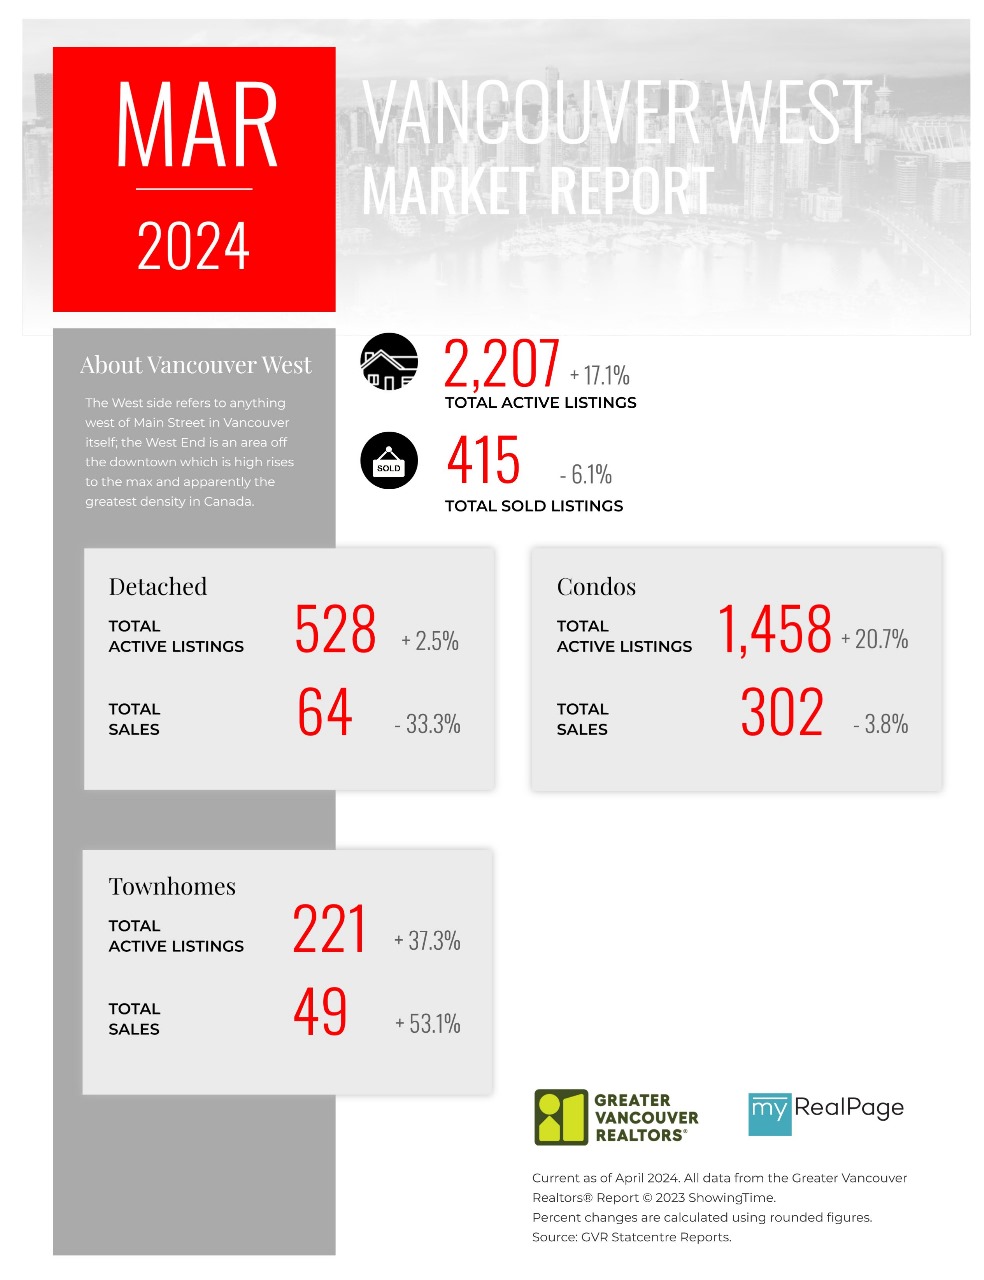
Printable Version – GVR March 2024 Data Infographics Report Vancouver West
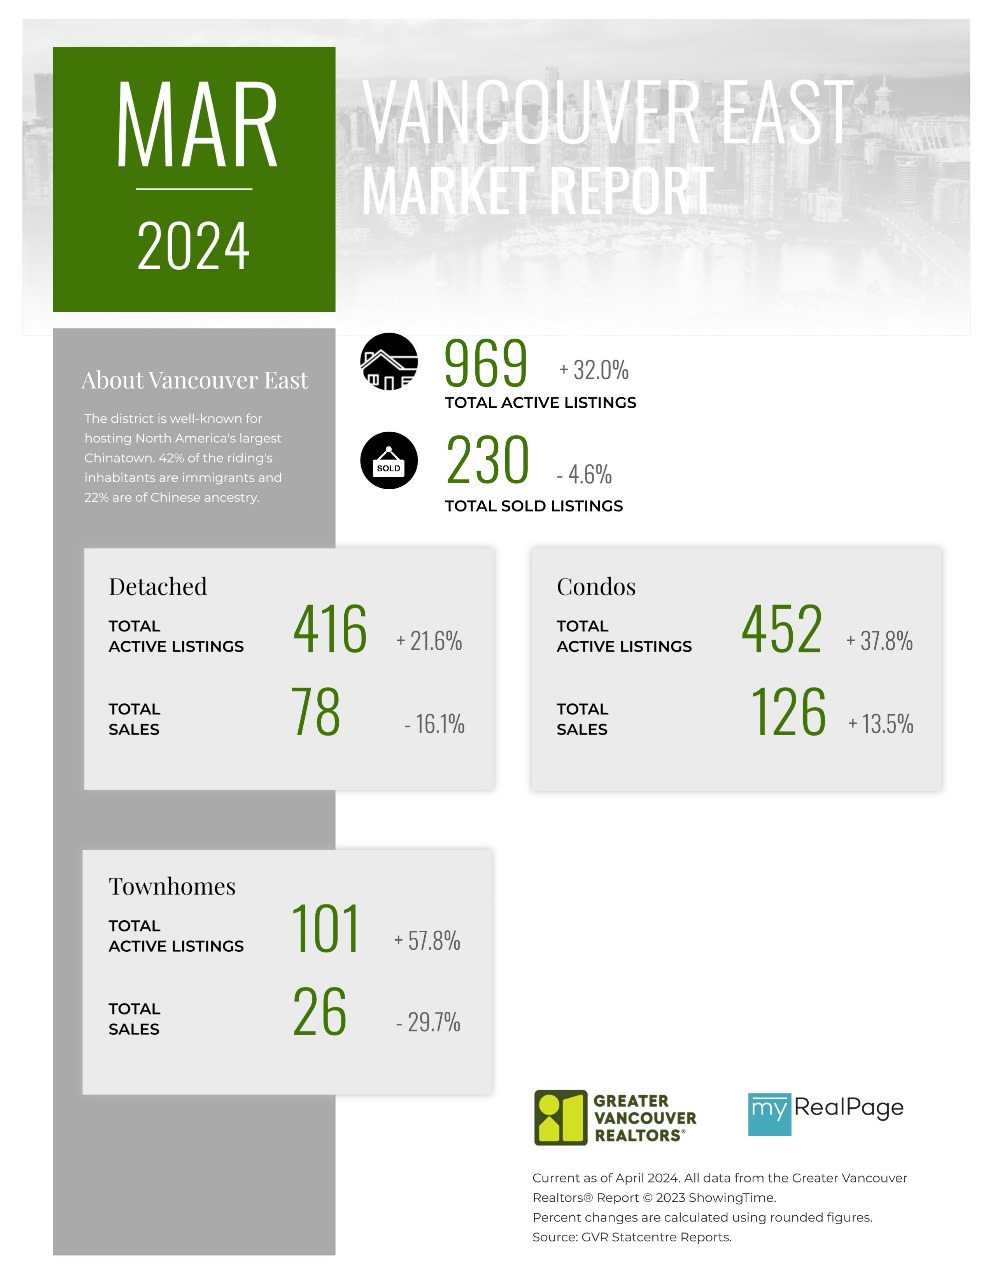
Printable Version – GVR March 2024 Data Infographics Report Vancouver East
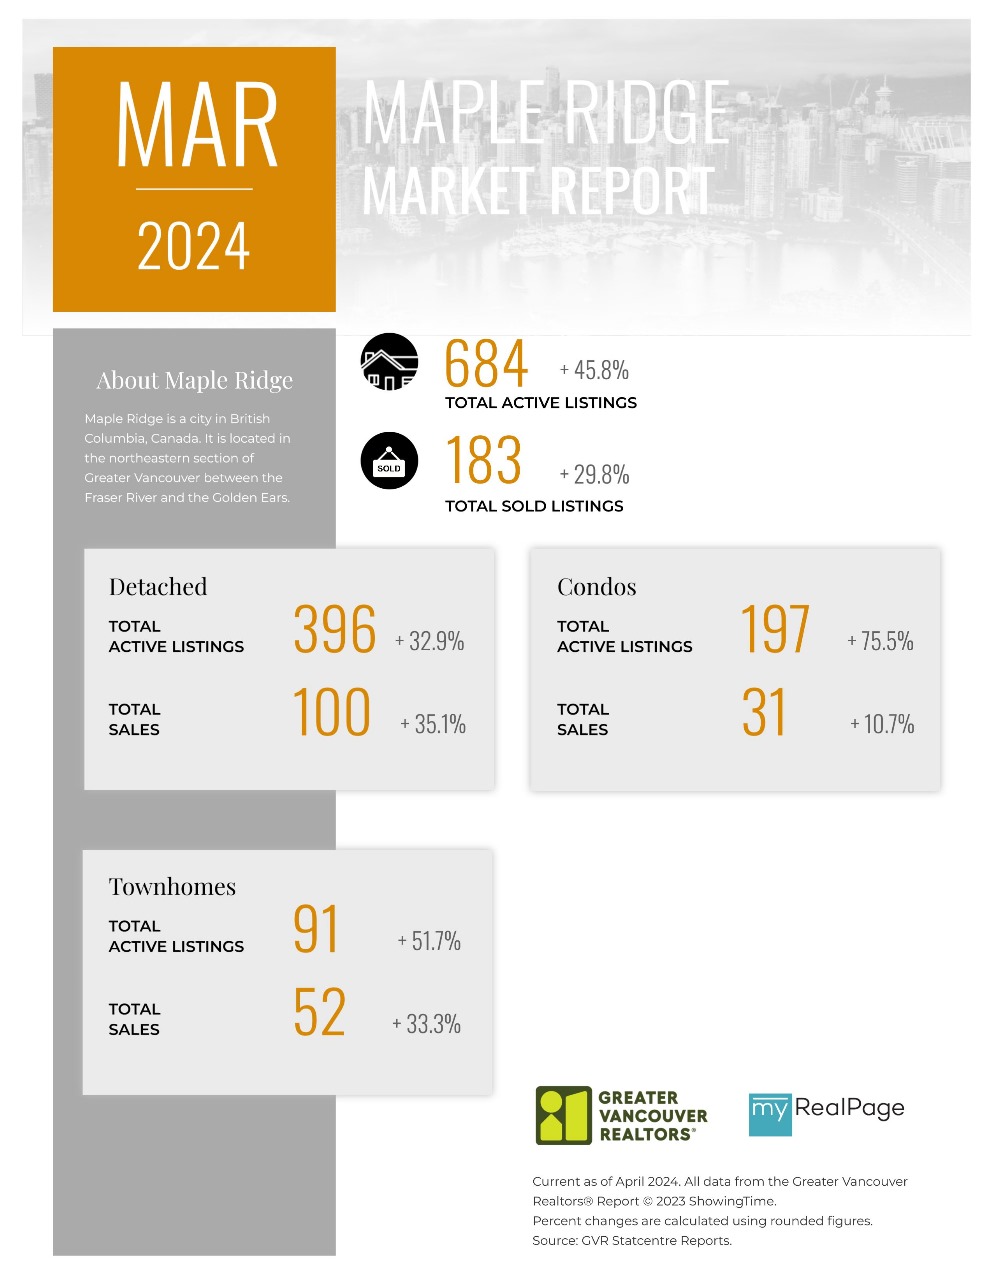
Printable Version – GVR March 2024 Data Infographic Report Maple Ridge
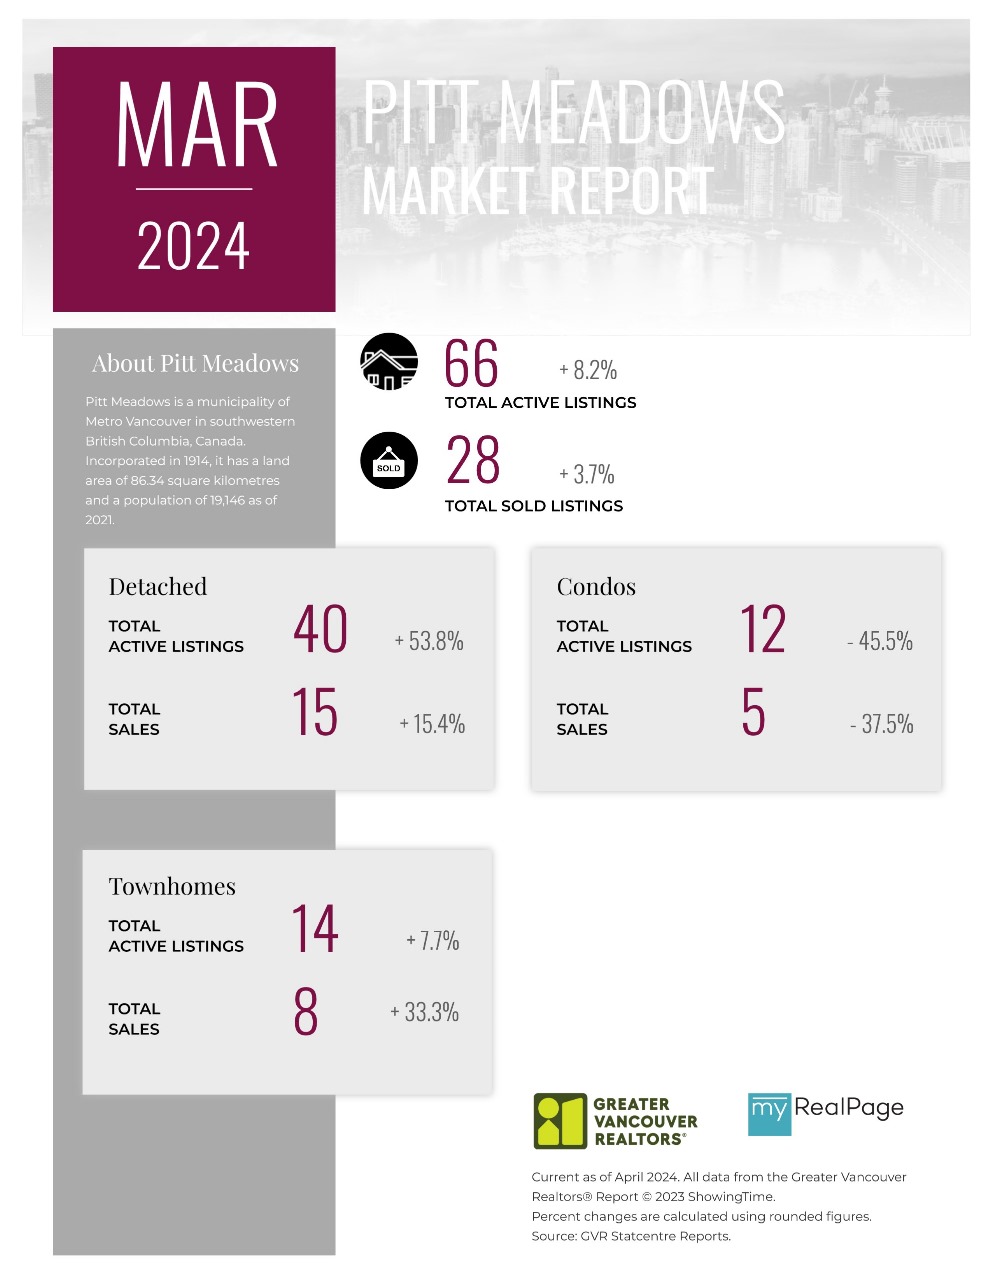
Printable Version – GVR March 2024 Data Infographics Report Pitt Meadows
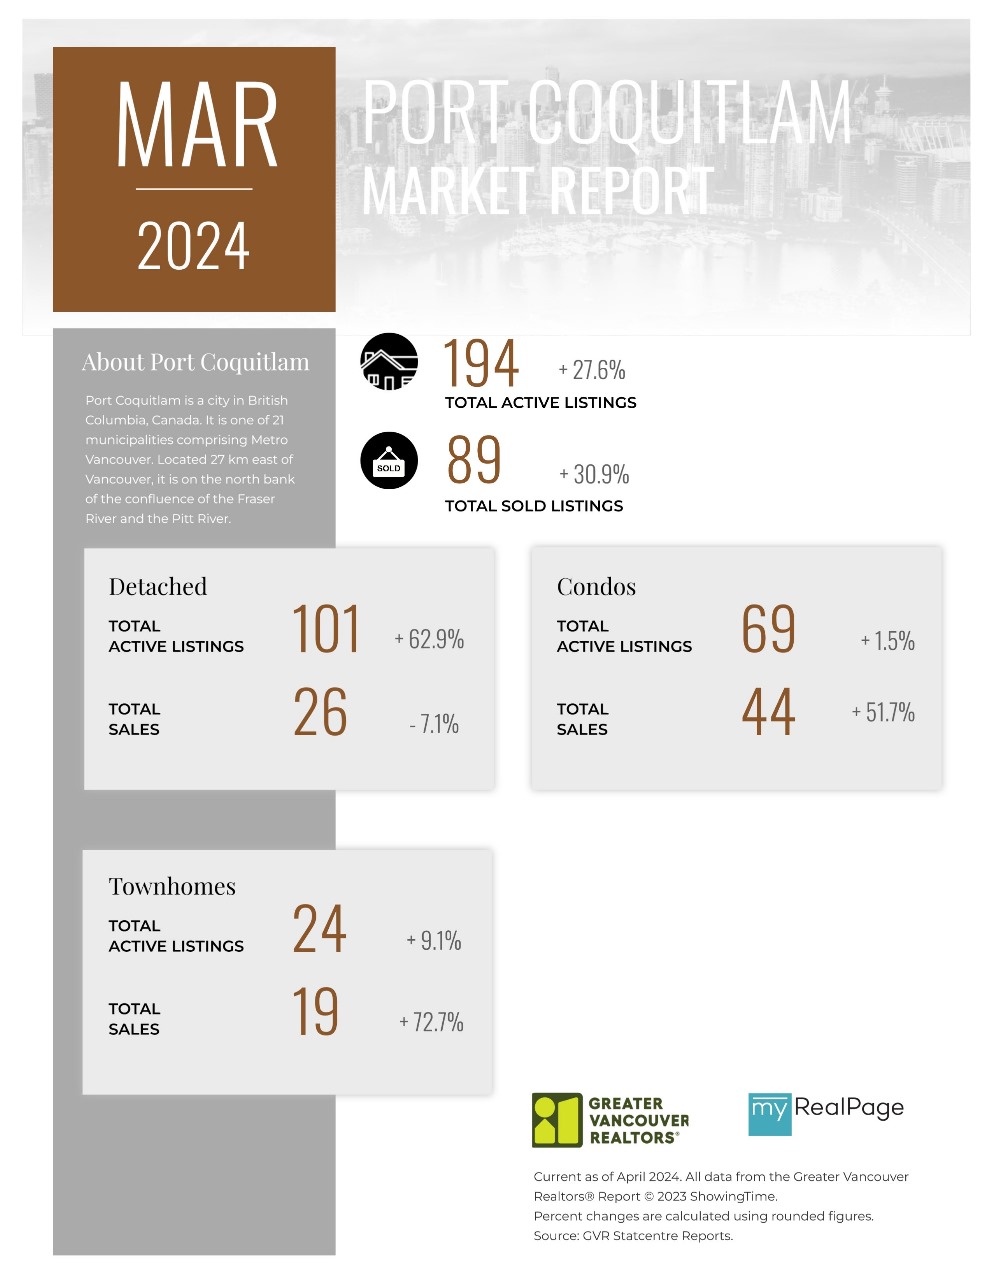
Printable Version – GVR March 2024 Data Infographics Report Port Coquitlam
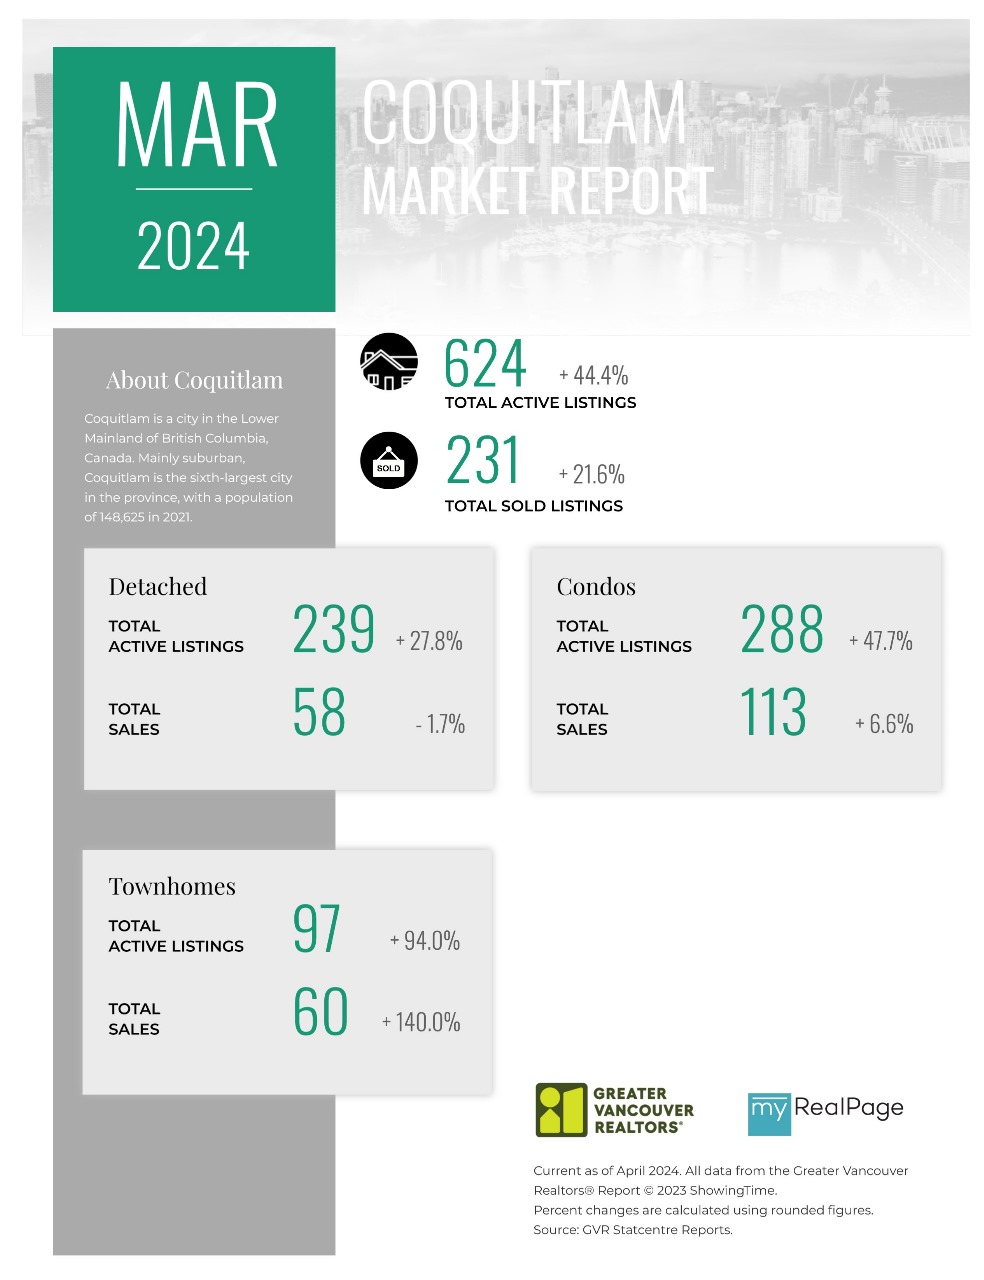
Printable Version – GVR March 2024 Data Infographics Report Coquitlam
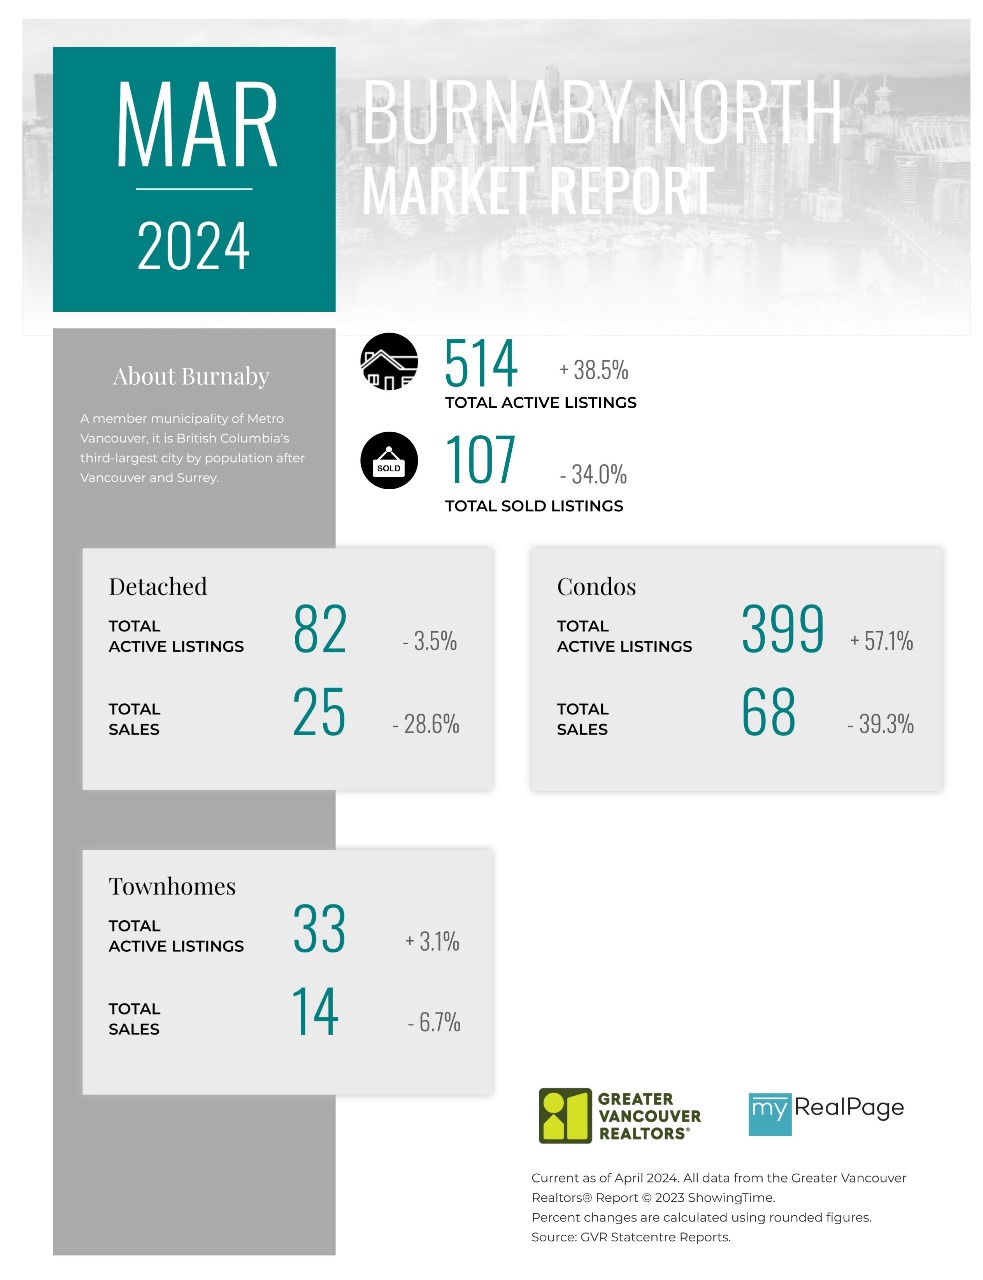
Printable Version – GVR March 2024 Data Infographic Report Burnaby North
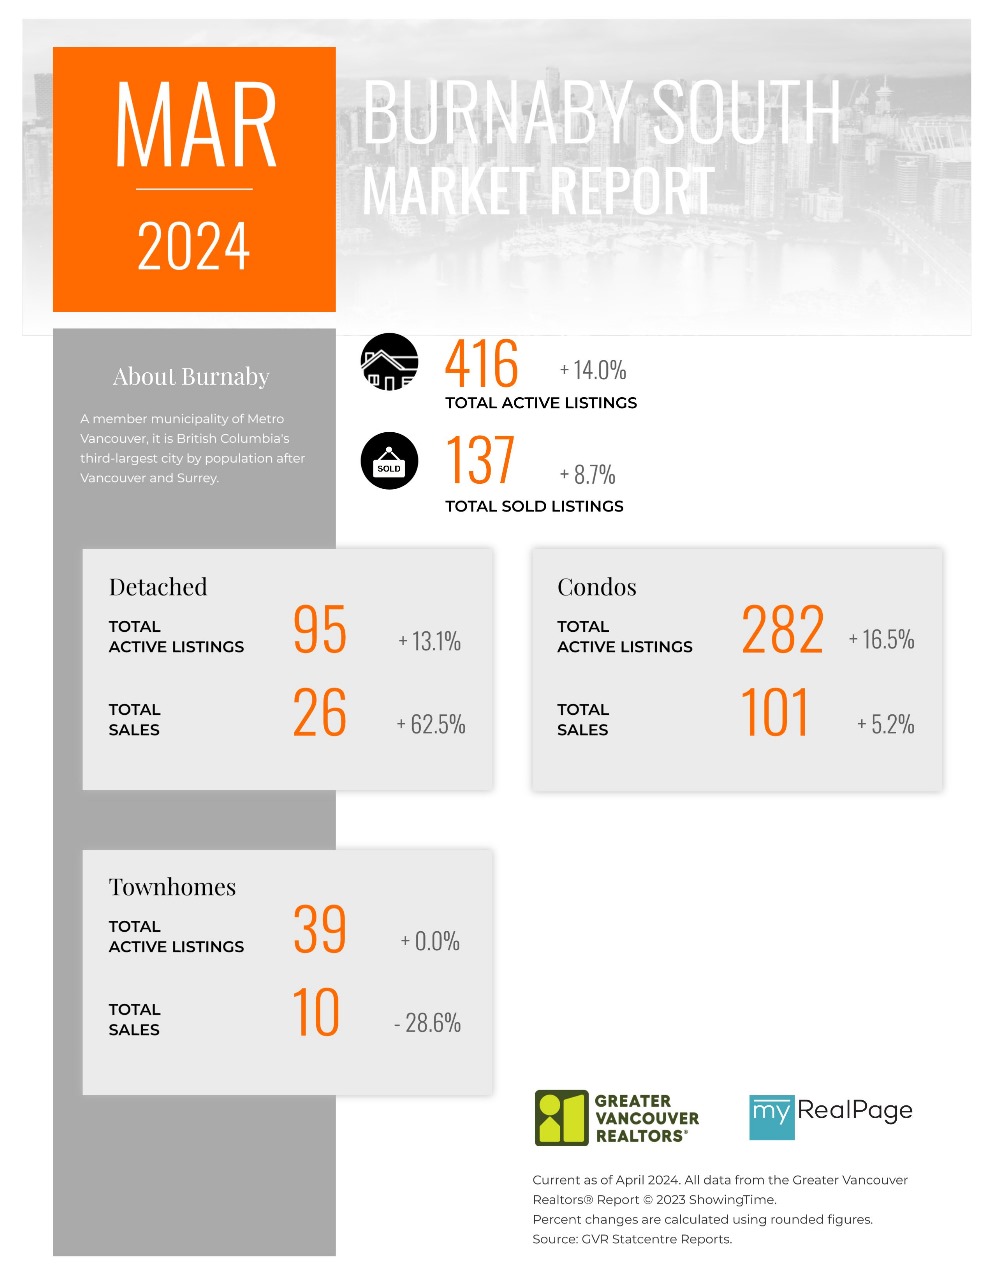
Printable Version – GVR March 2024 Data Infographics Report Burnaby South
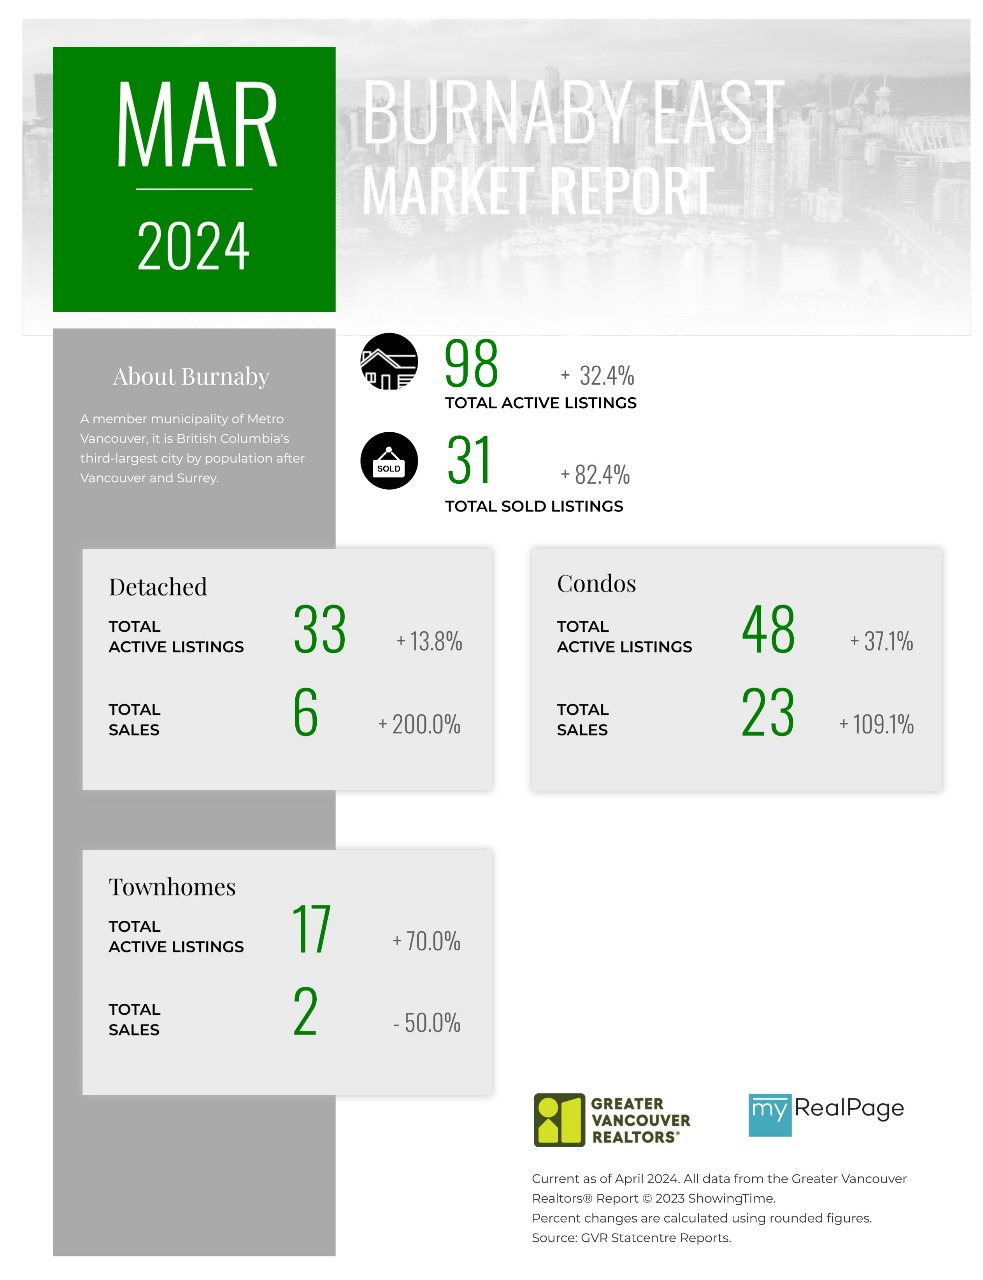
Printable Version – GVR March 2024 Data Infographics Report Burnaby East
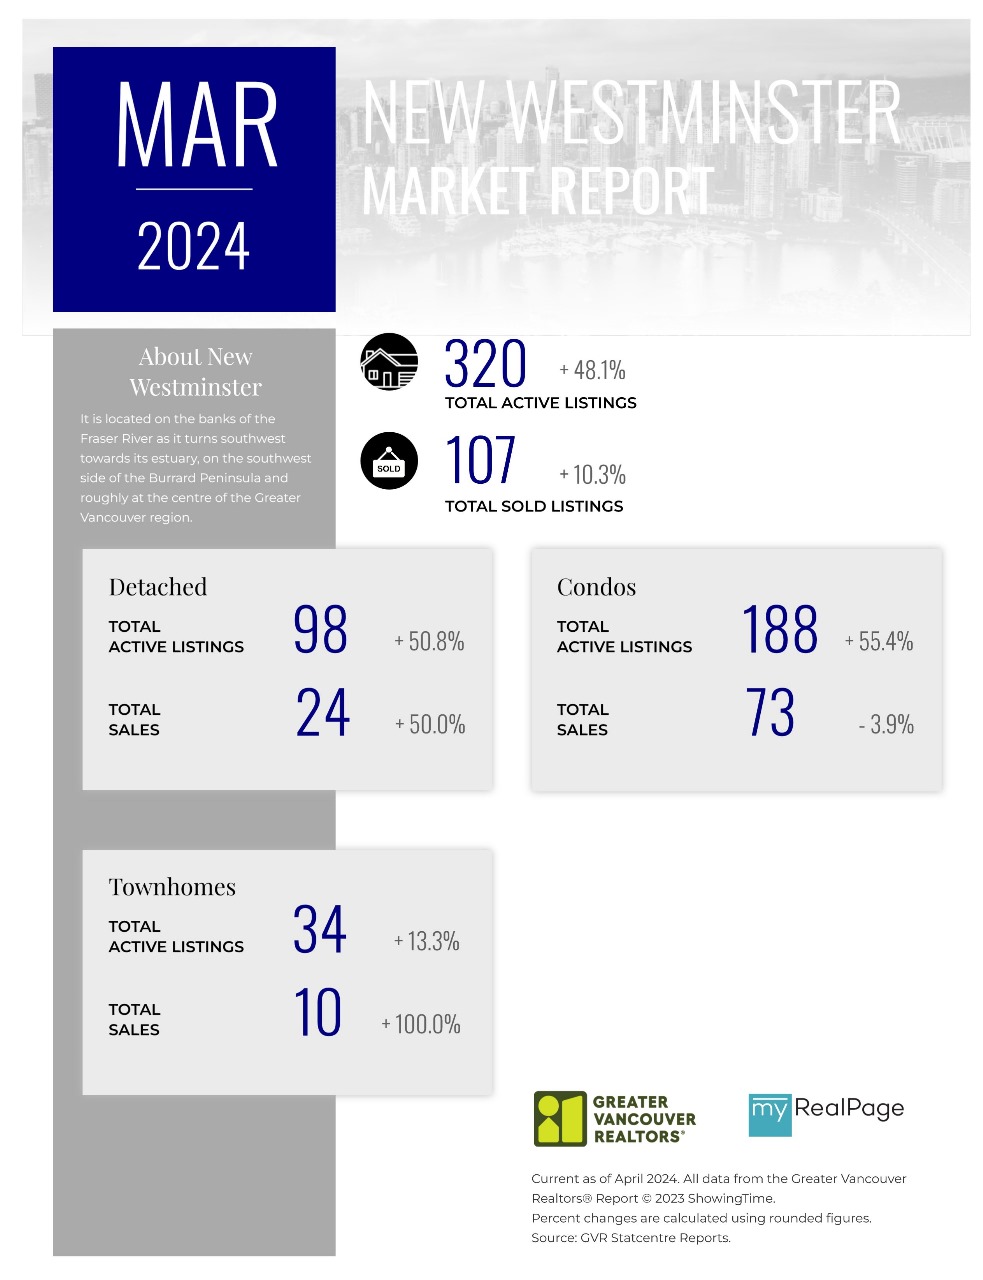
Printable Version – GVR March 2024 Data Infographics Report New Westminster
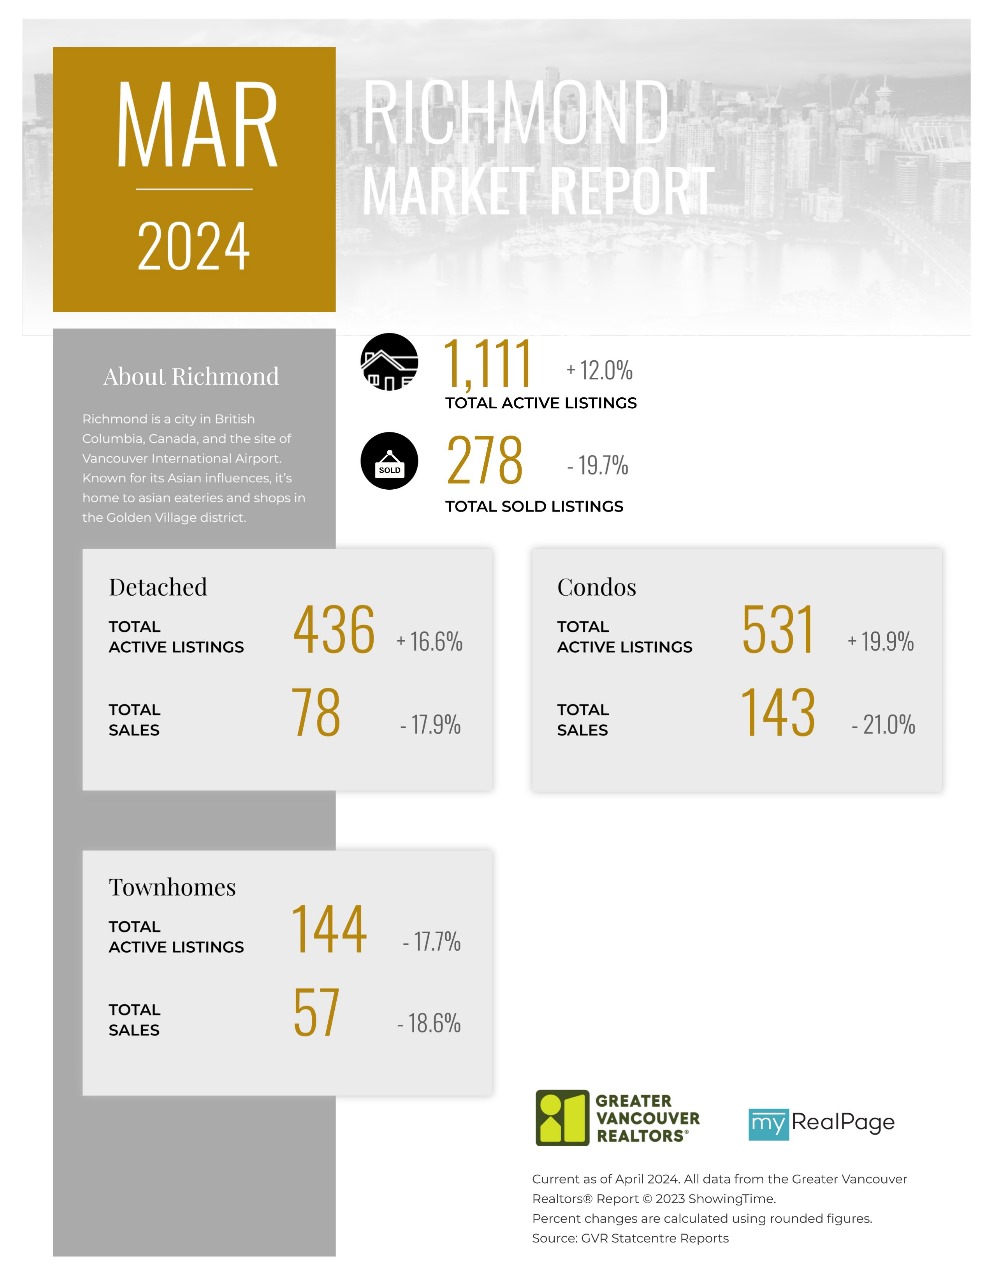
Printable Version – GVR March 2024 Data Infographics Report Richmond
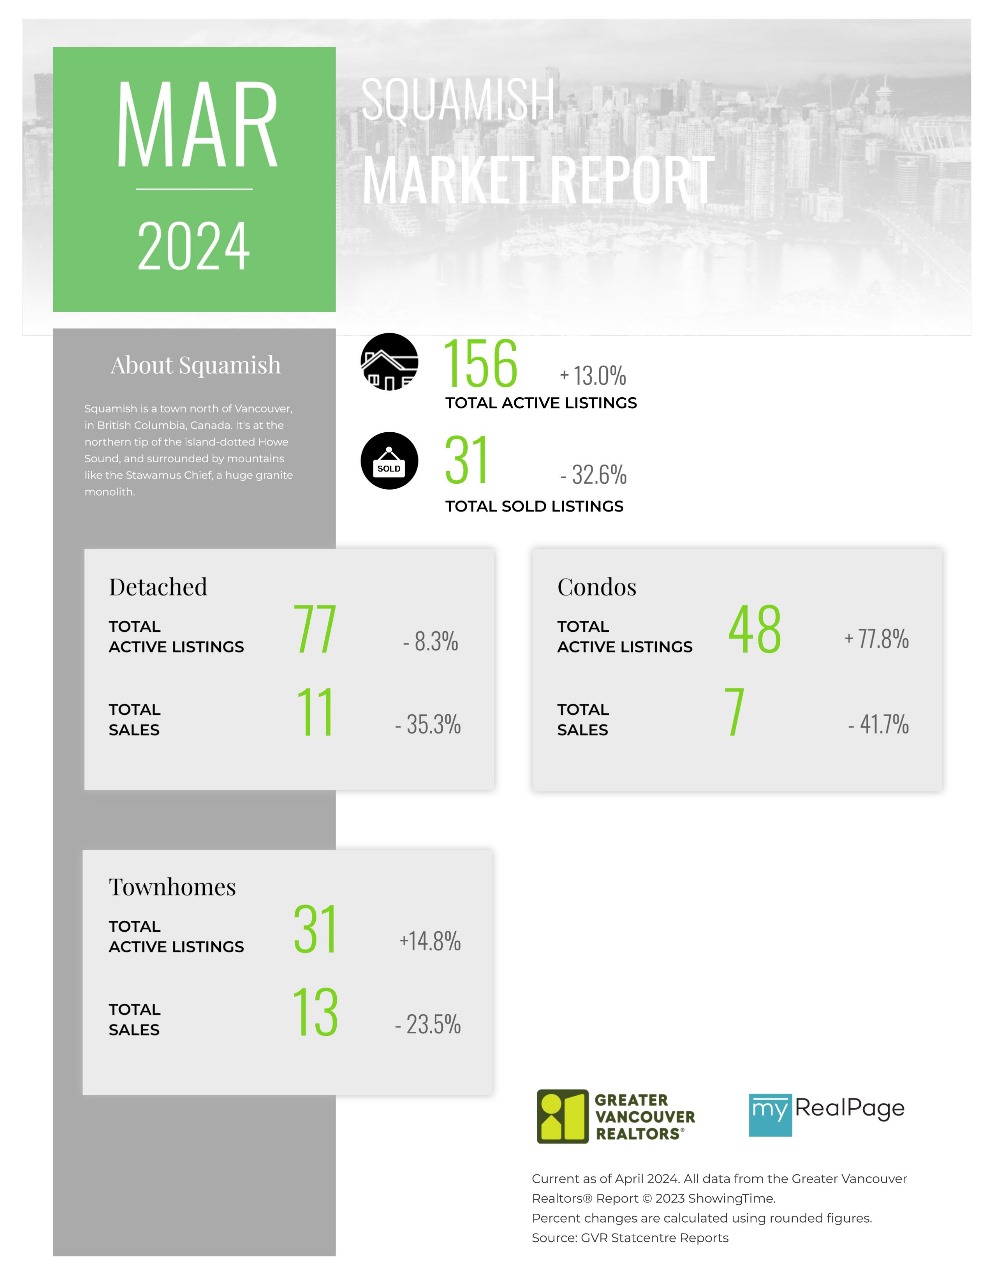
Printable Version – GVR March 2024 Data Infographics Report Squamish
Last Updated on April 26, 2024 by myRealPage
