INFOGRAPHICS: February 2024 GVR Greater Vancouver Market Reports

Home sellers active, bring much-needed inventory to housing market
While Metro Vancouver1 home sellers appeared somewhat hesitant in January, new listings rose 31 per cent year-over-year in February, bringing a significant number of newly listed properties to the market.
Greater Vancouver REALTORS® (GVR)2 reports that residential sales3 in the region totalled 2,070 in February 2024, a 13.5 per cent increase from the 1,824 sales recorded in February 2023. This was 23.3 per cent below the 10-year seasonal average (2,699).
“While the pace of home sales started the year off briskly, the pace of newly listed properties in January was slower by comparison. A continuation of this pattern in February would have been concerning, as it could quickly tilt the market towards overheated conditions.” Andrew Lis, GVR director of economics and data analytics
Read the full report on the REBGV website!
The following data is a comparison between February 2024 and February 2023 numbers, and is current as of March 2024. For last month’s update, you can check out our previous post!
Or follow this link for all our GVR Infographics!
These infographics cover current trends in several areas within the Greater Vancouver region. Click on the images for a larger view!
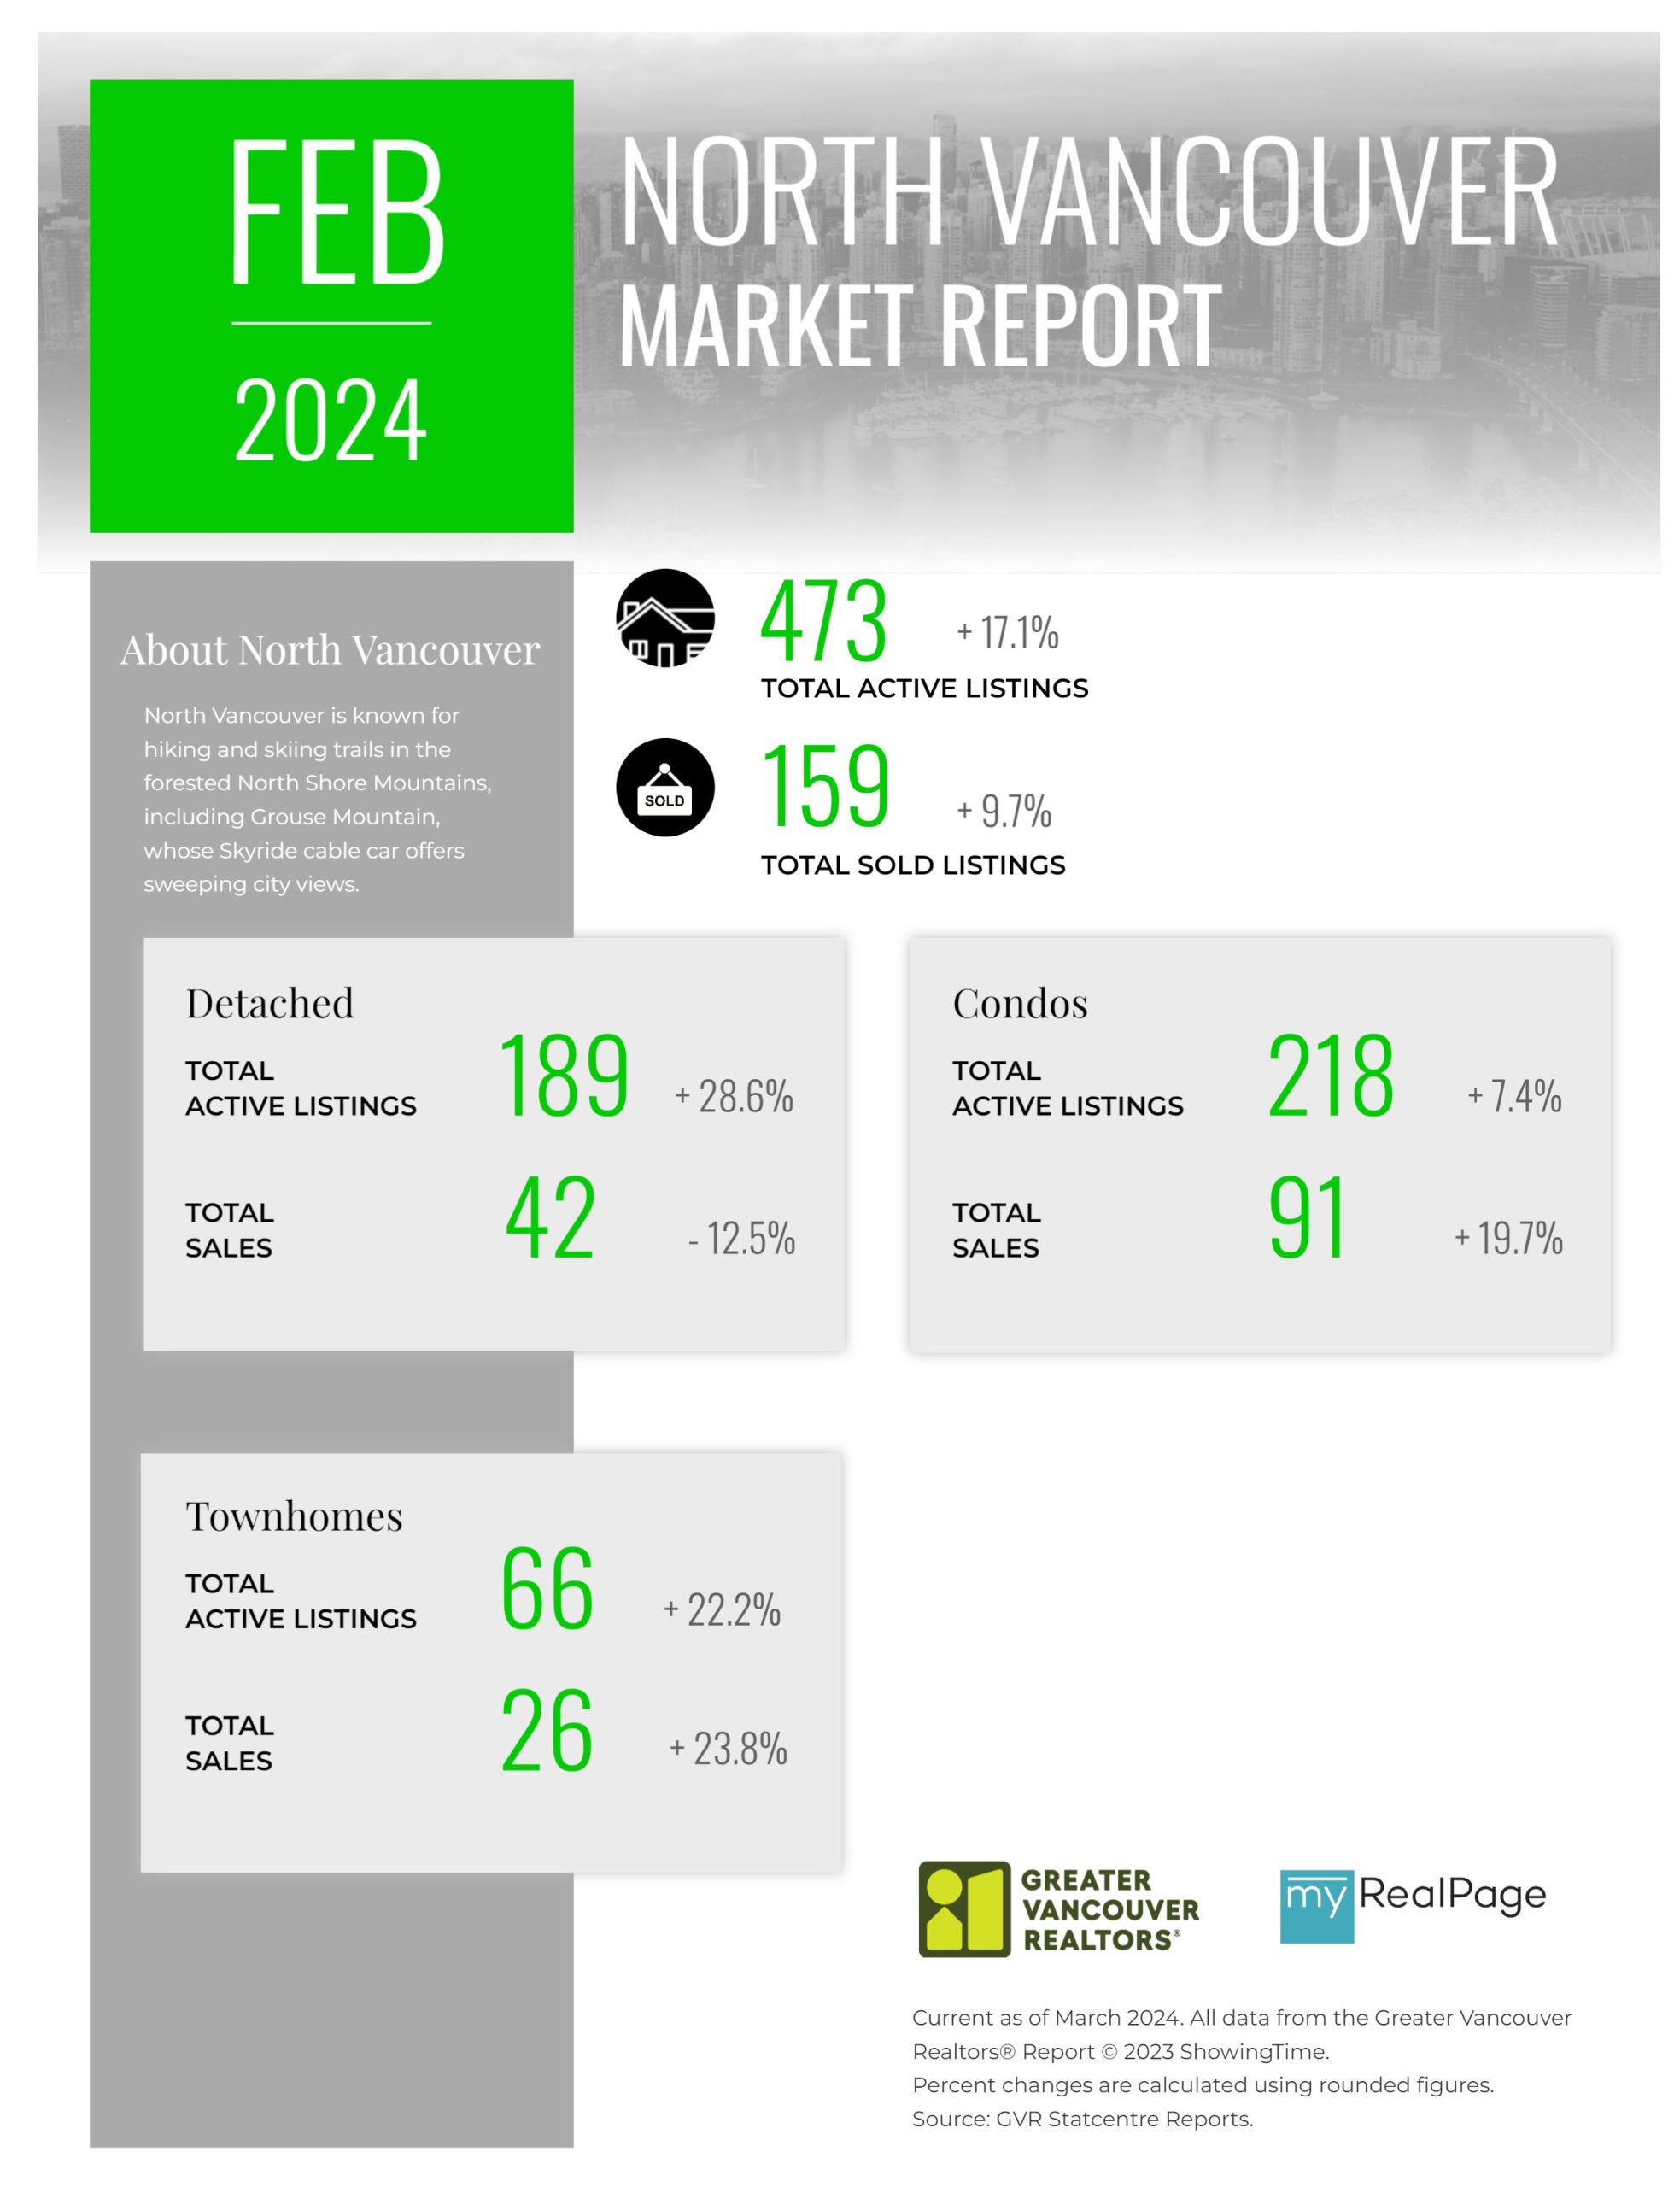
Printable Version – GVR February 2024 Data Infographic Report North Vancouver
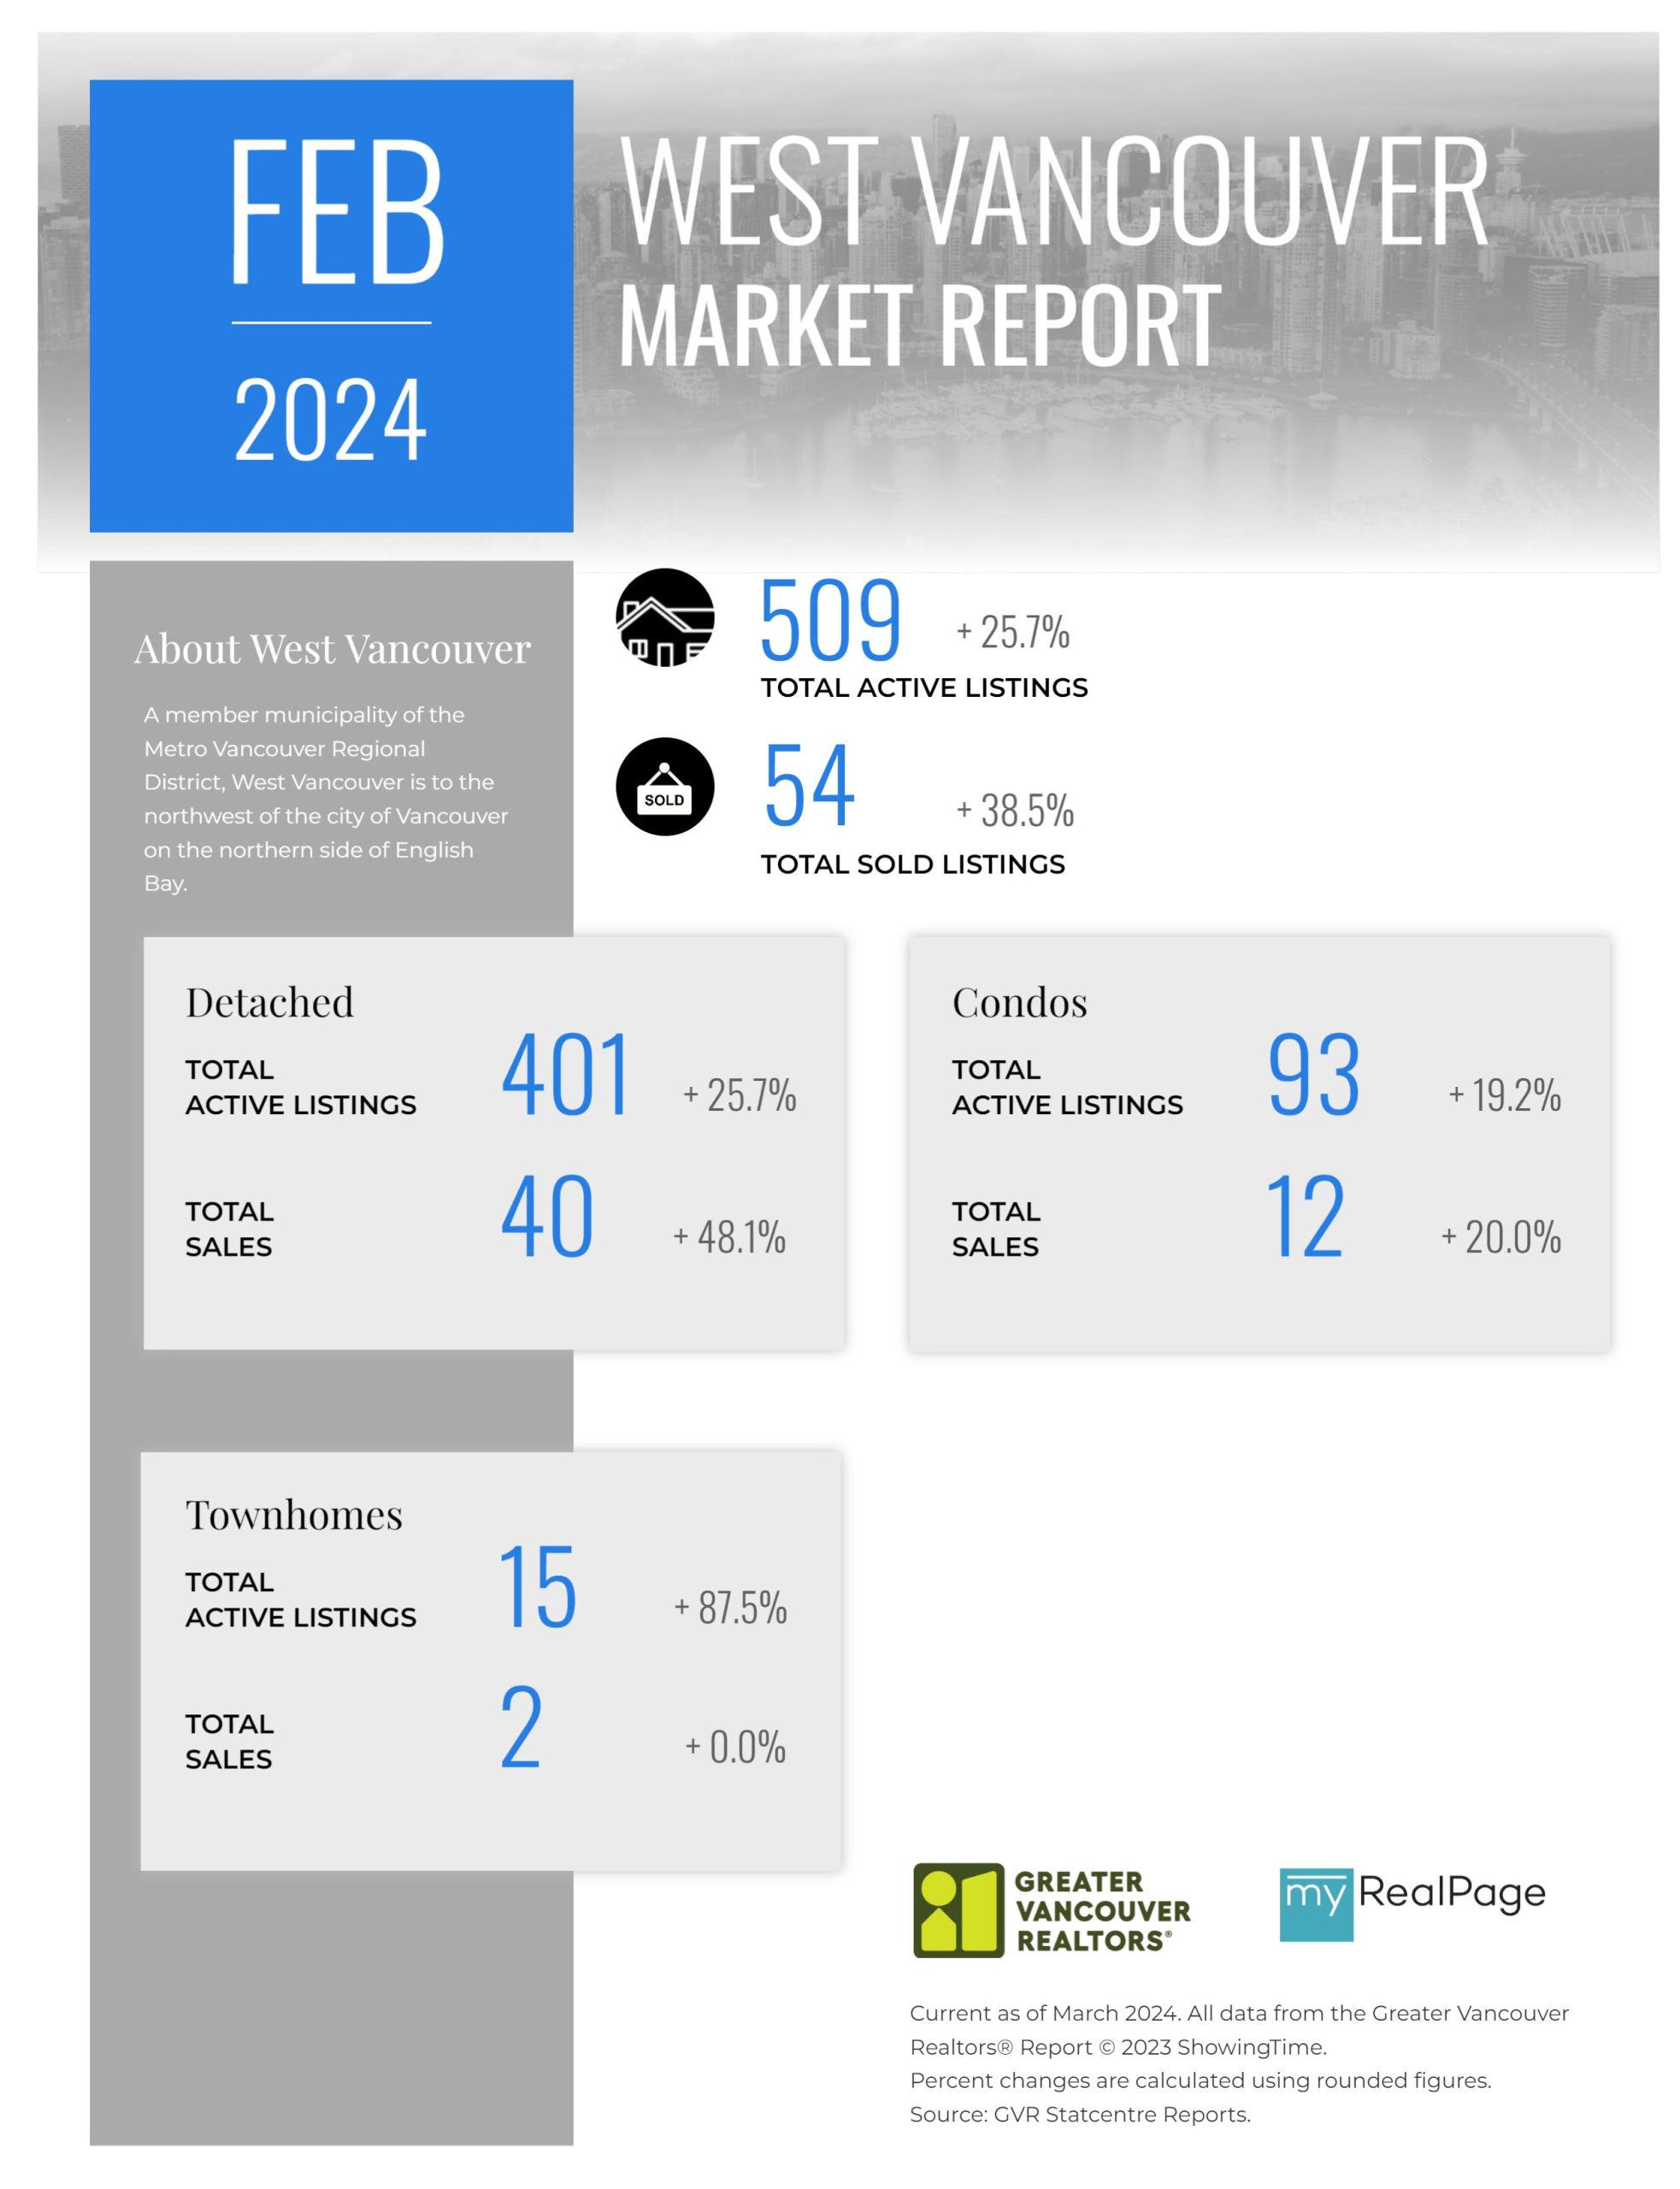
Printable Version – GVR February 2024 Data Infographics Report West Vancouver
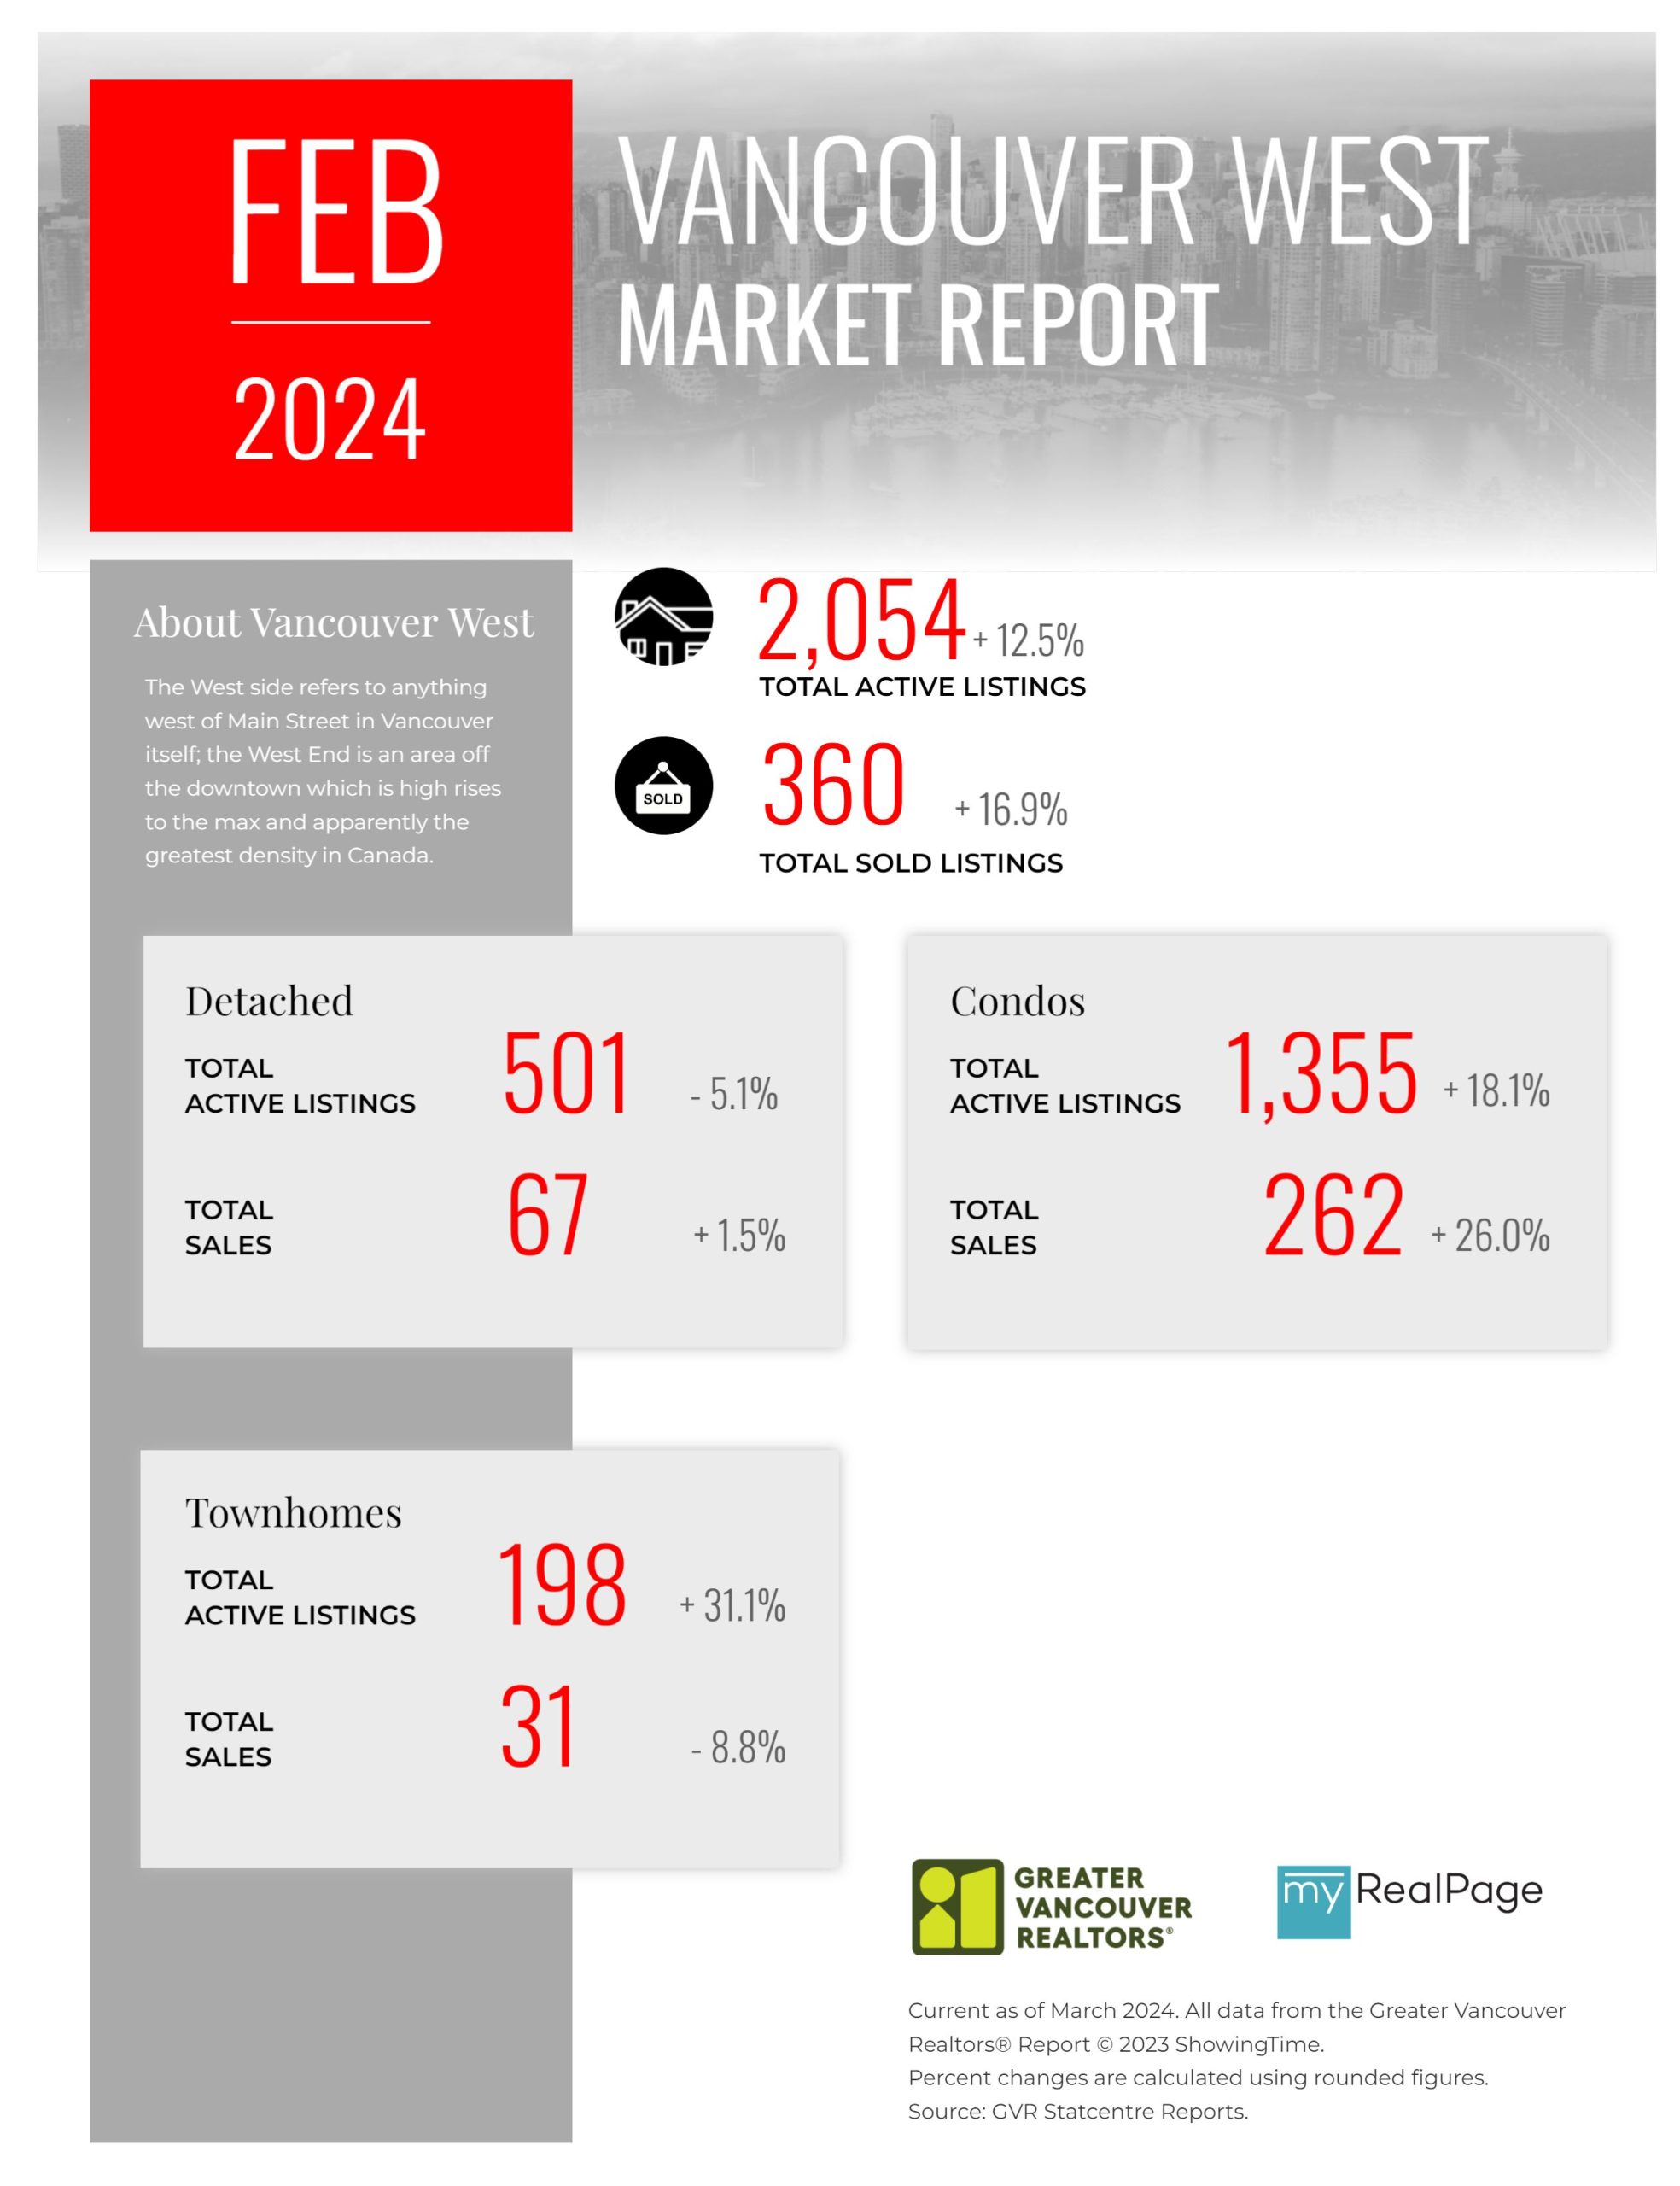
Printable Version – GVR February 2024 Data Infographics Report Vancouver West
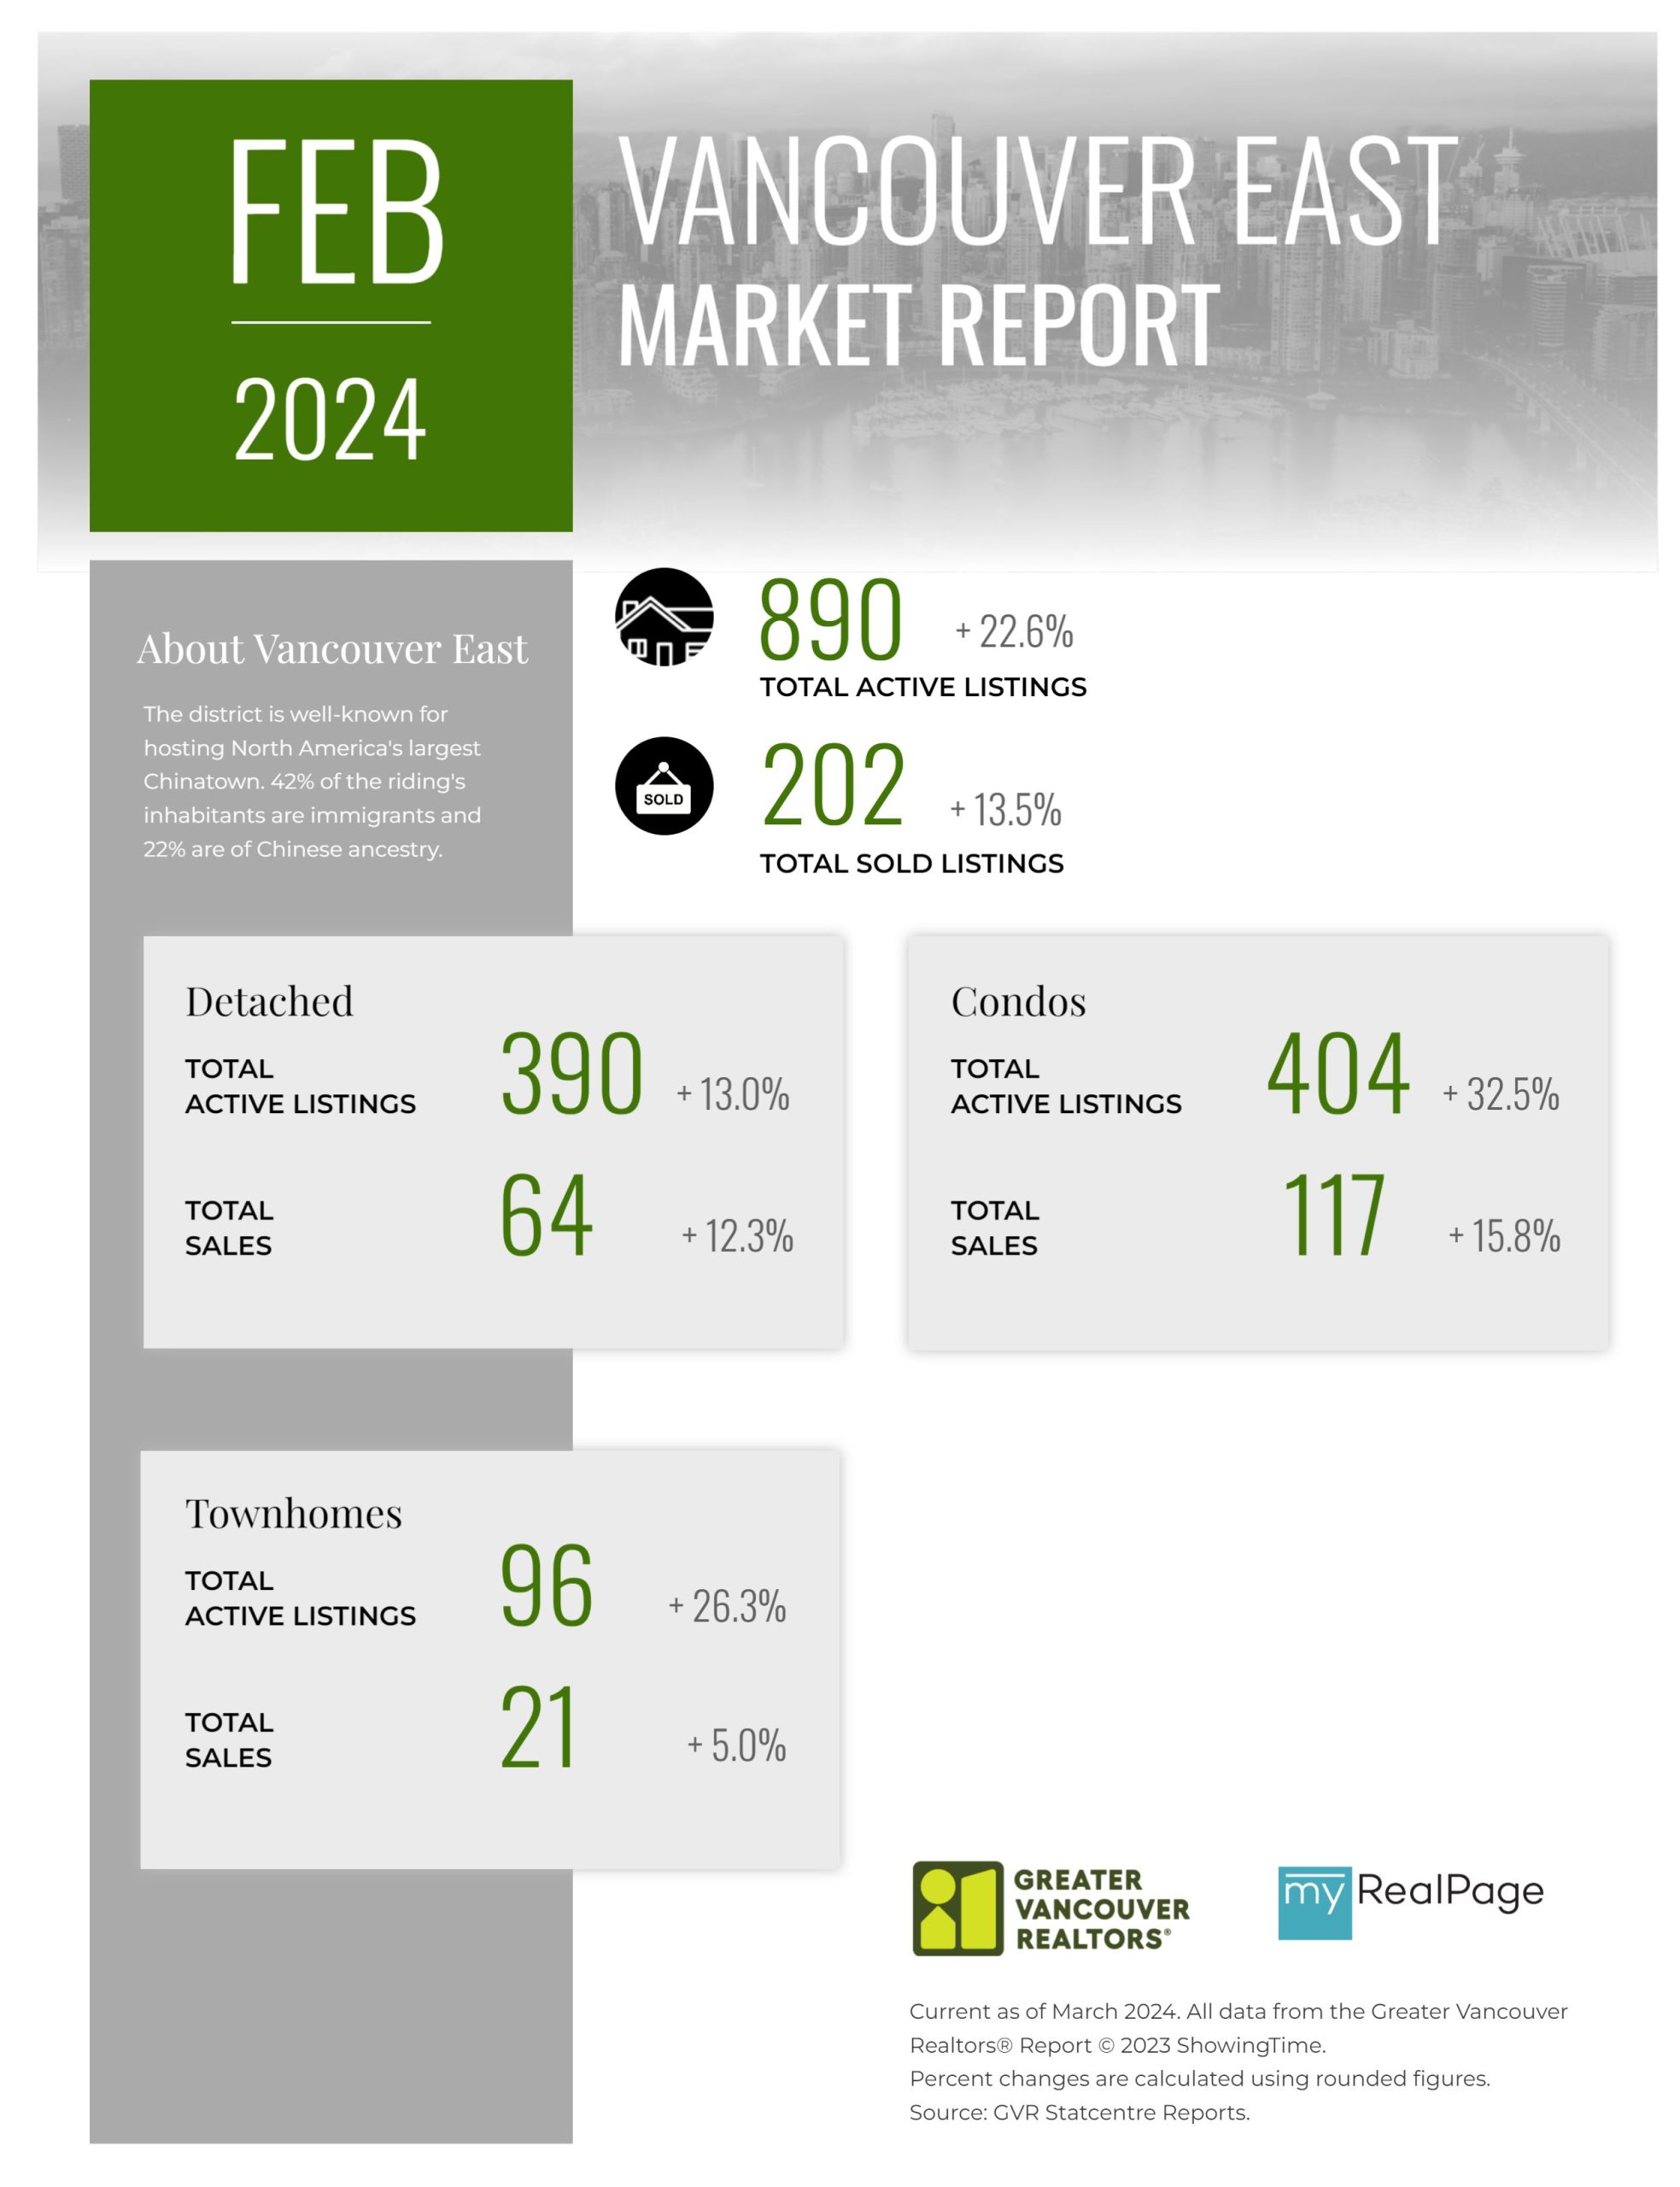
Printable Version – GVR February 2024 Data Infographics Report Vancouver East
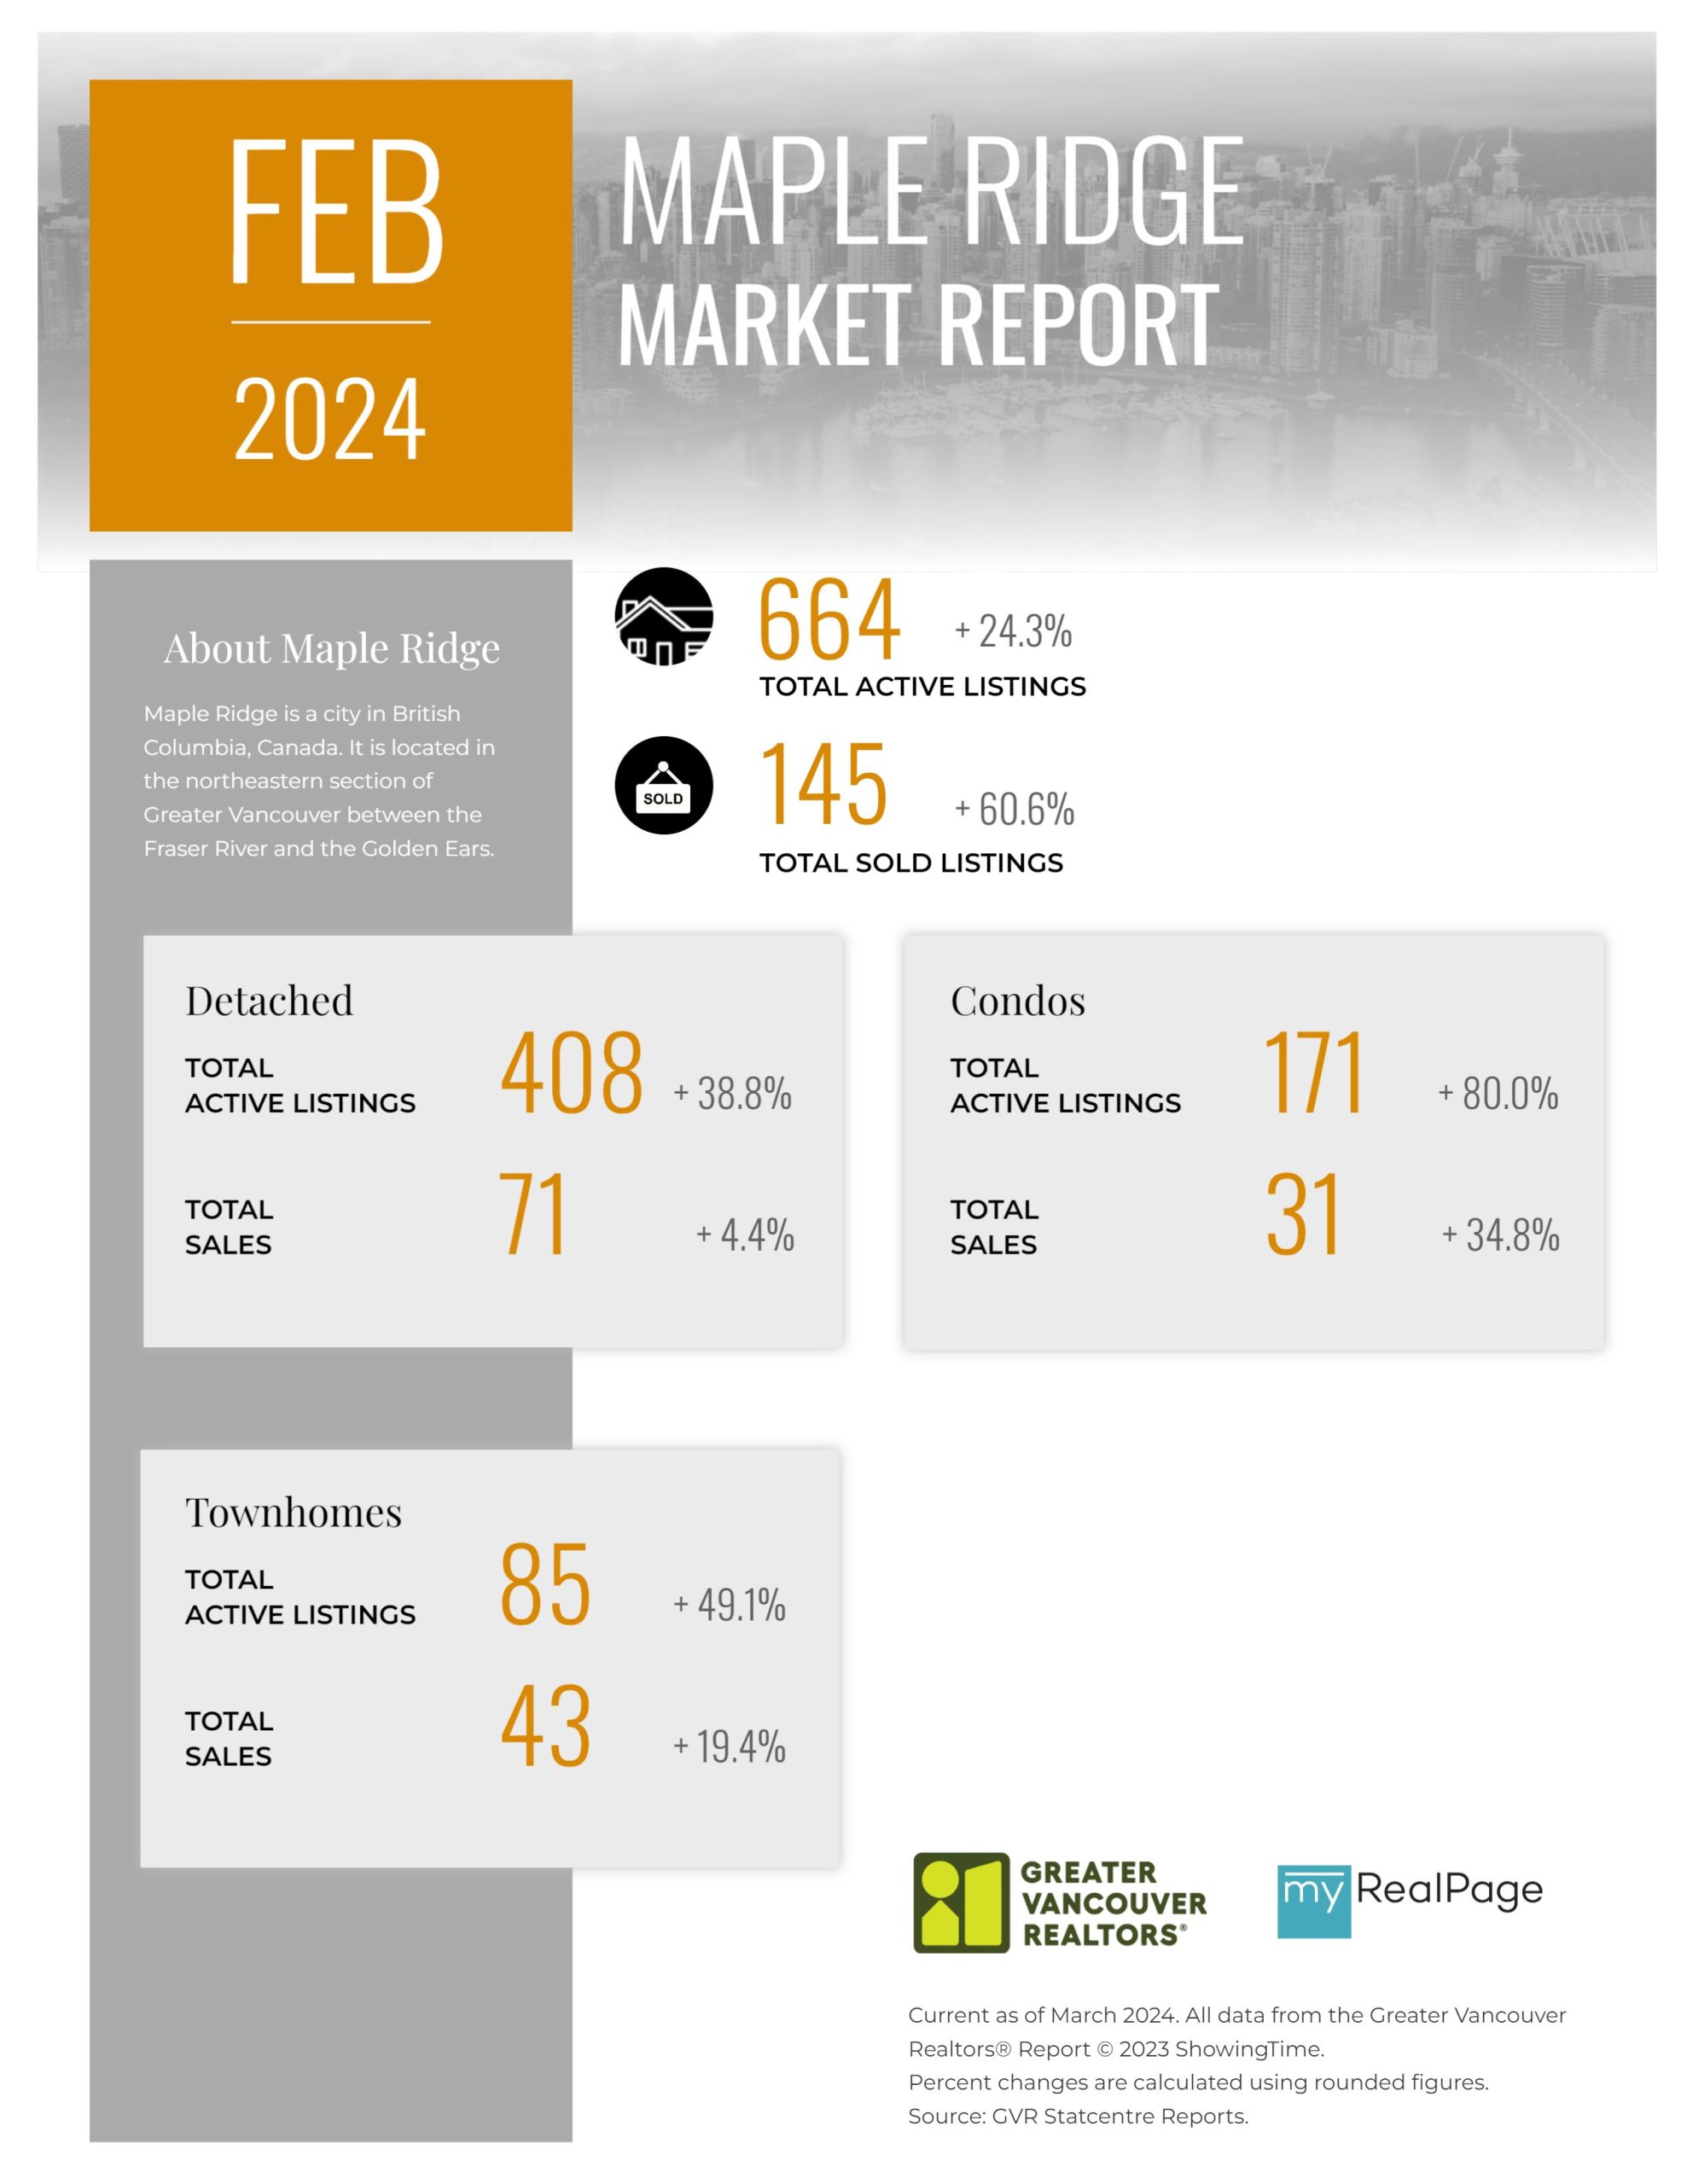
Printable Version – GVR February 2024 Data Infographic Report Maple Ridge
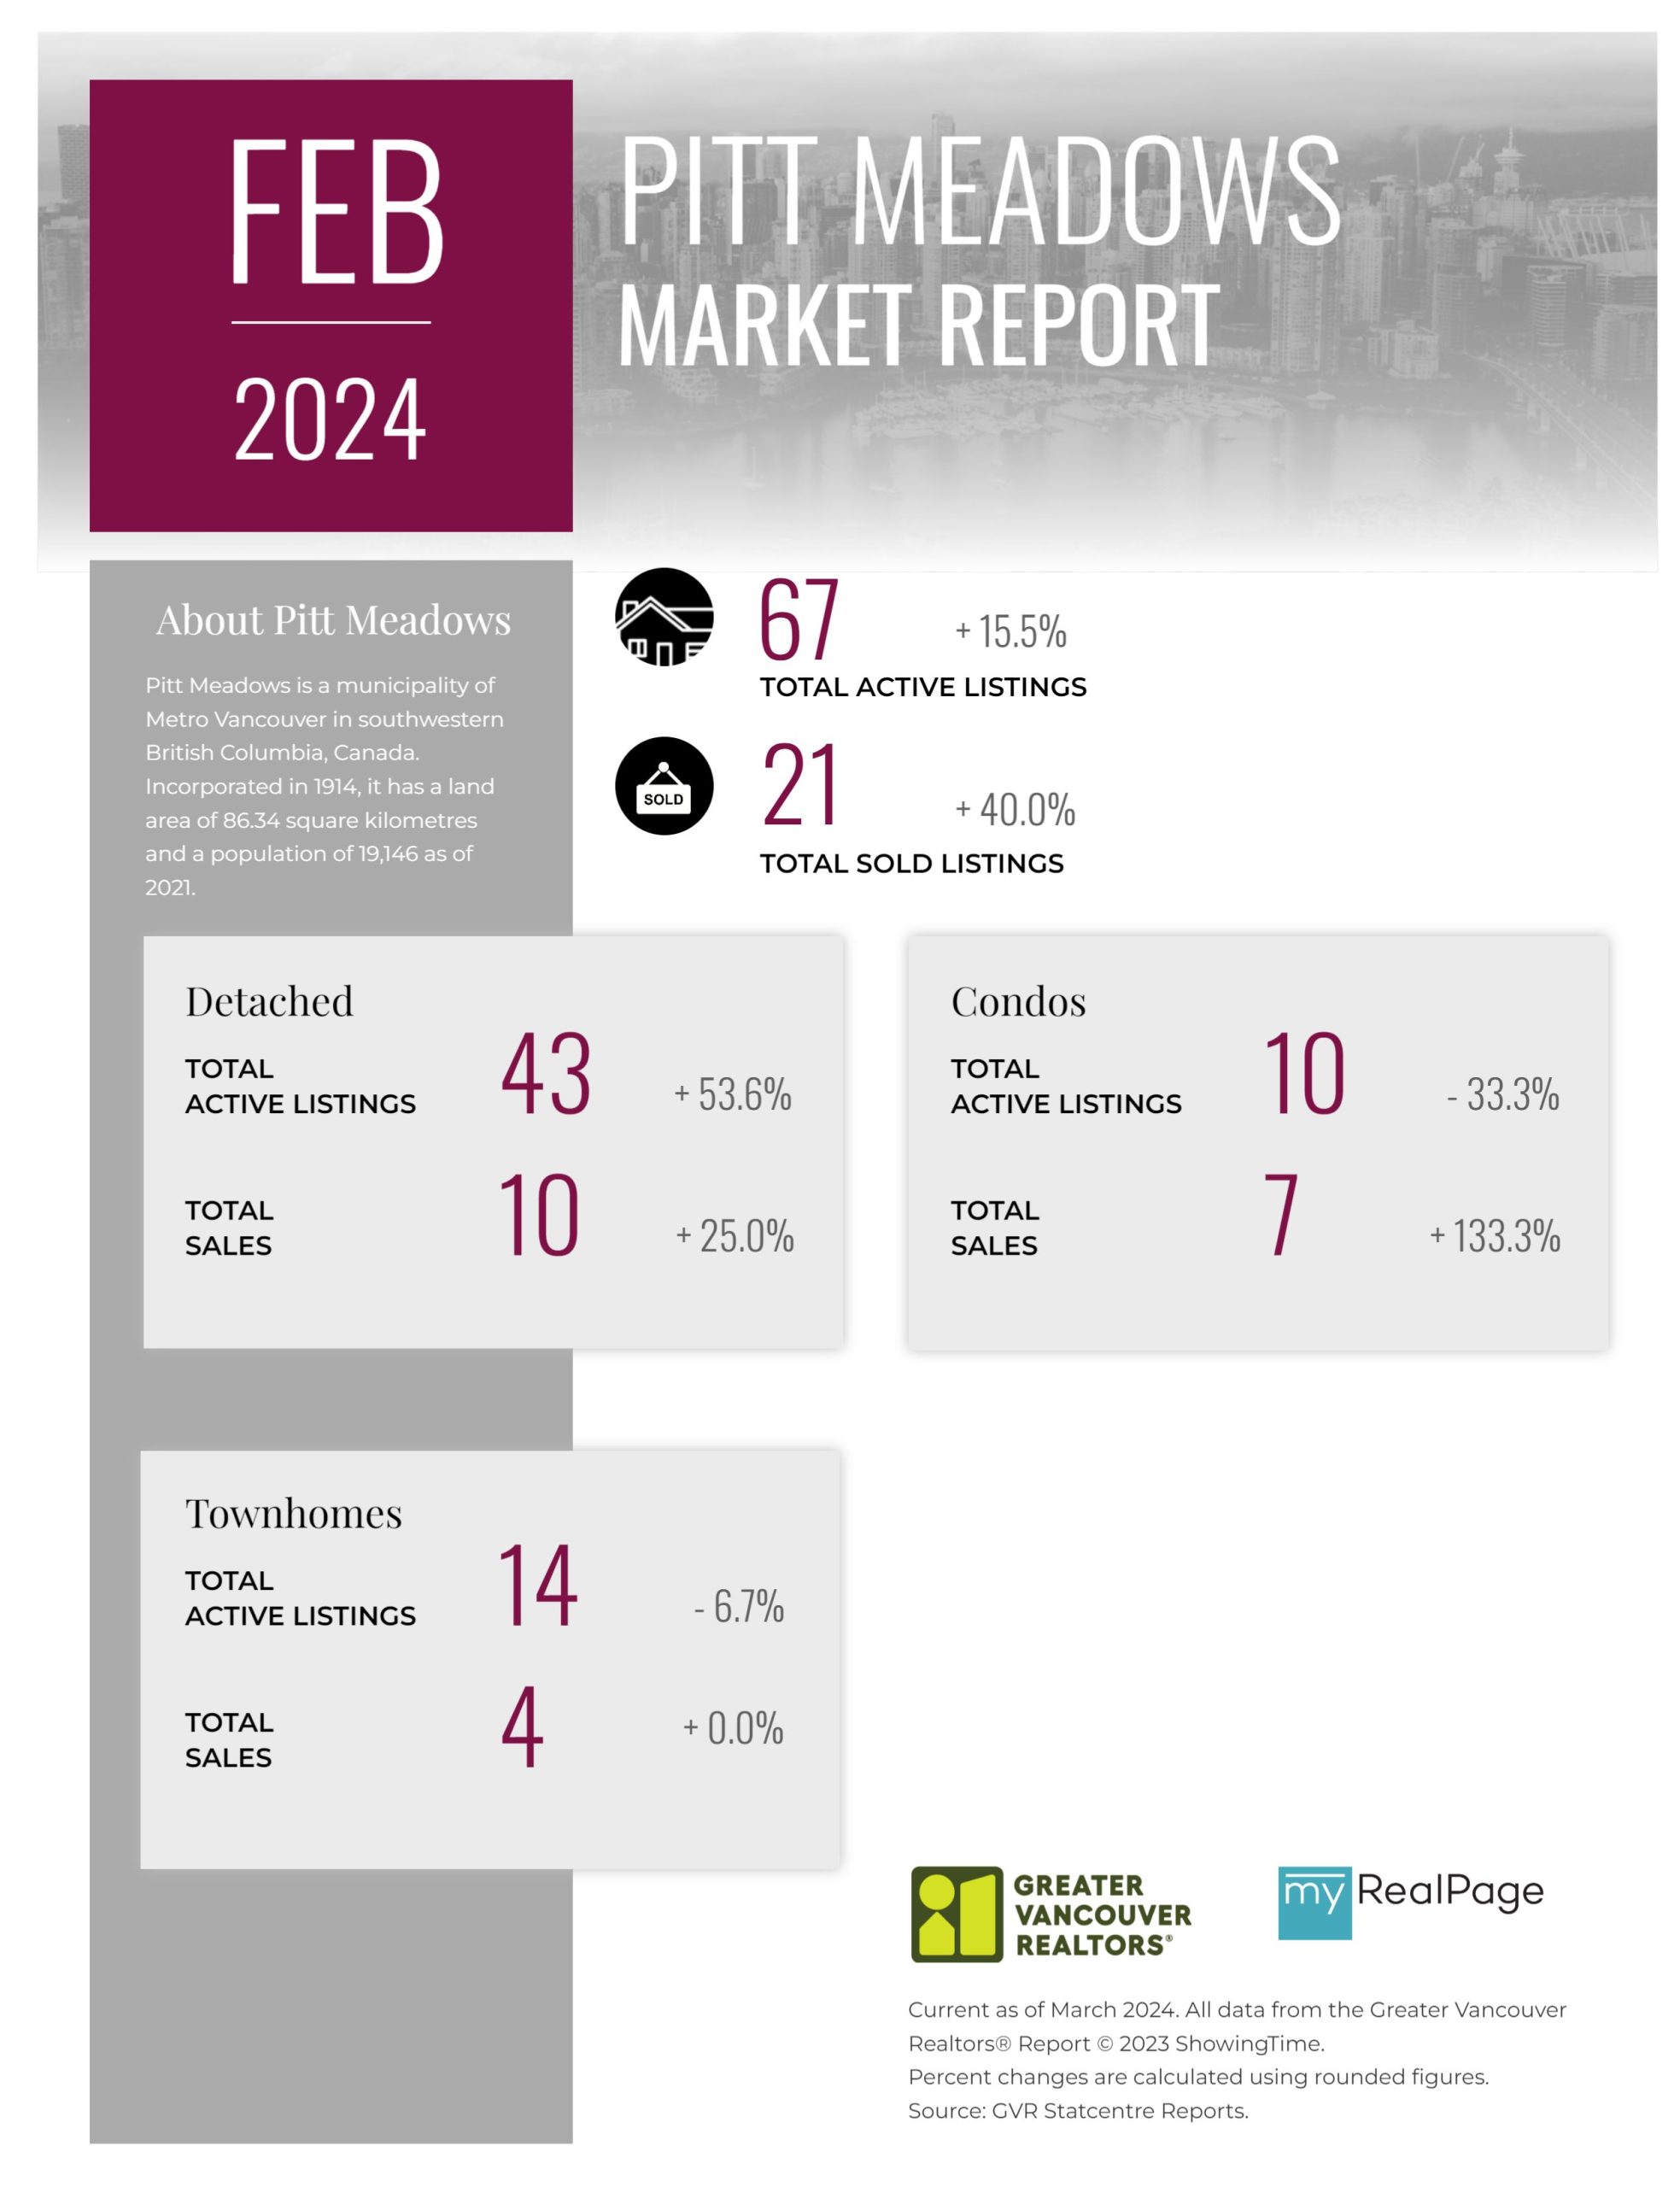
Printable Version – GVR February 2024 Data Infographics Report Pitt Meadows
Printable Version – GVR February 2024 Data Infographics Report Port Coquitlam
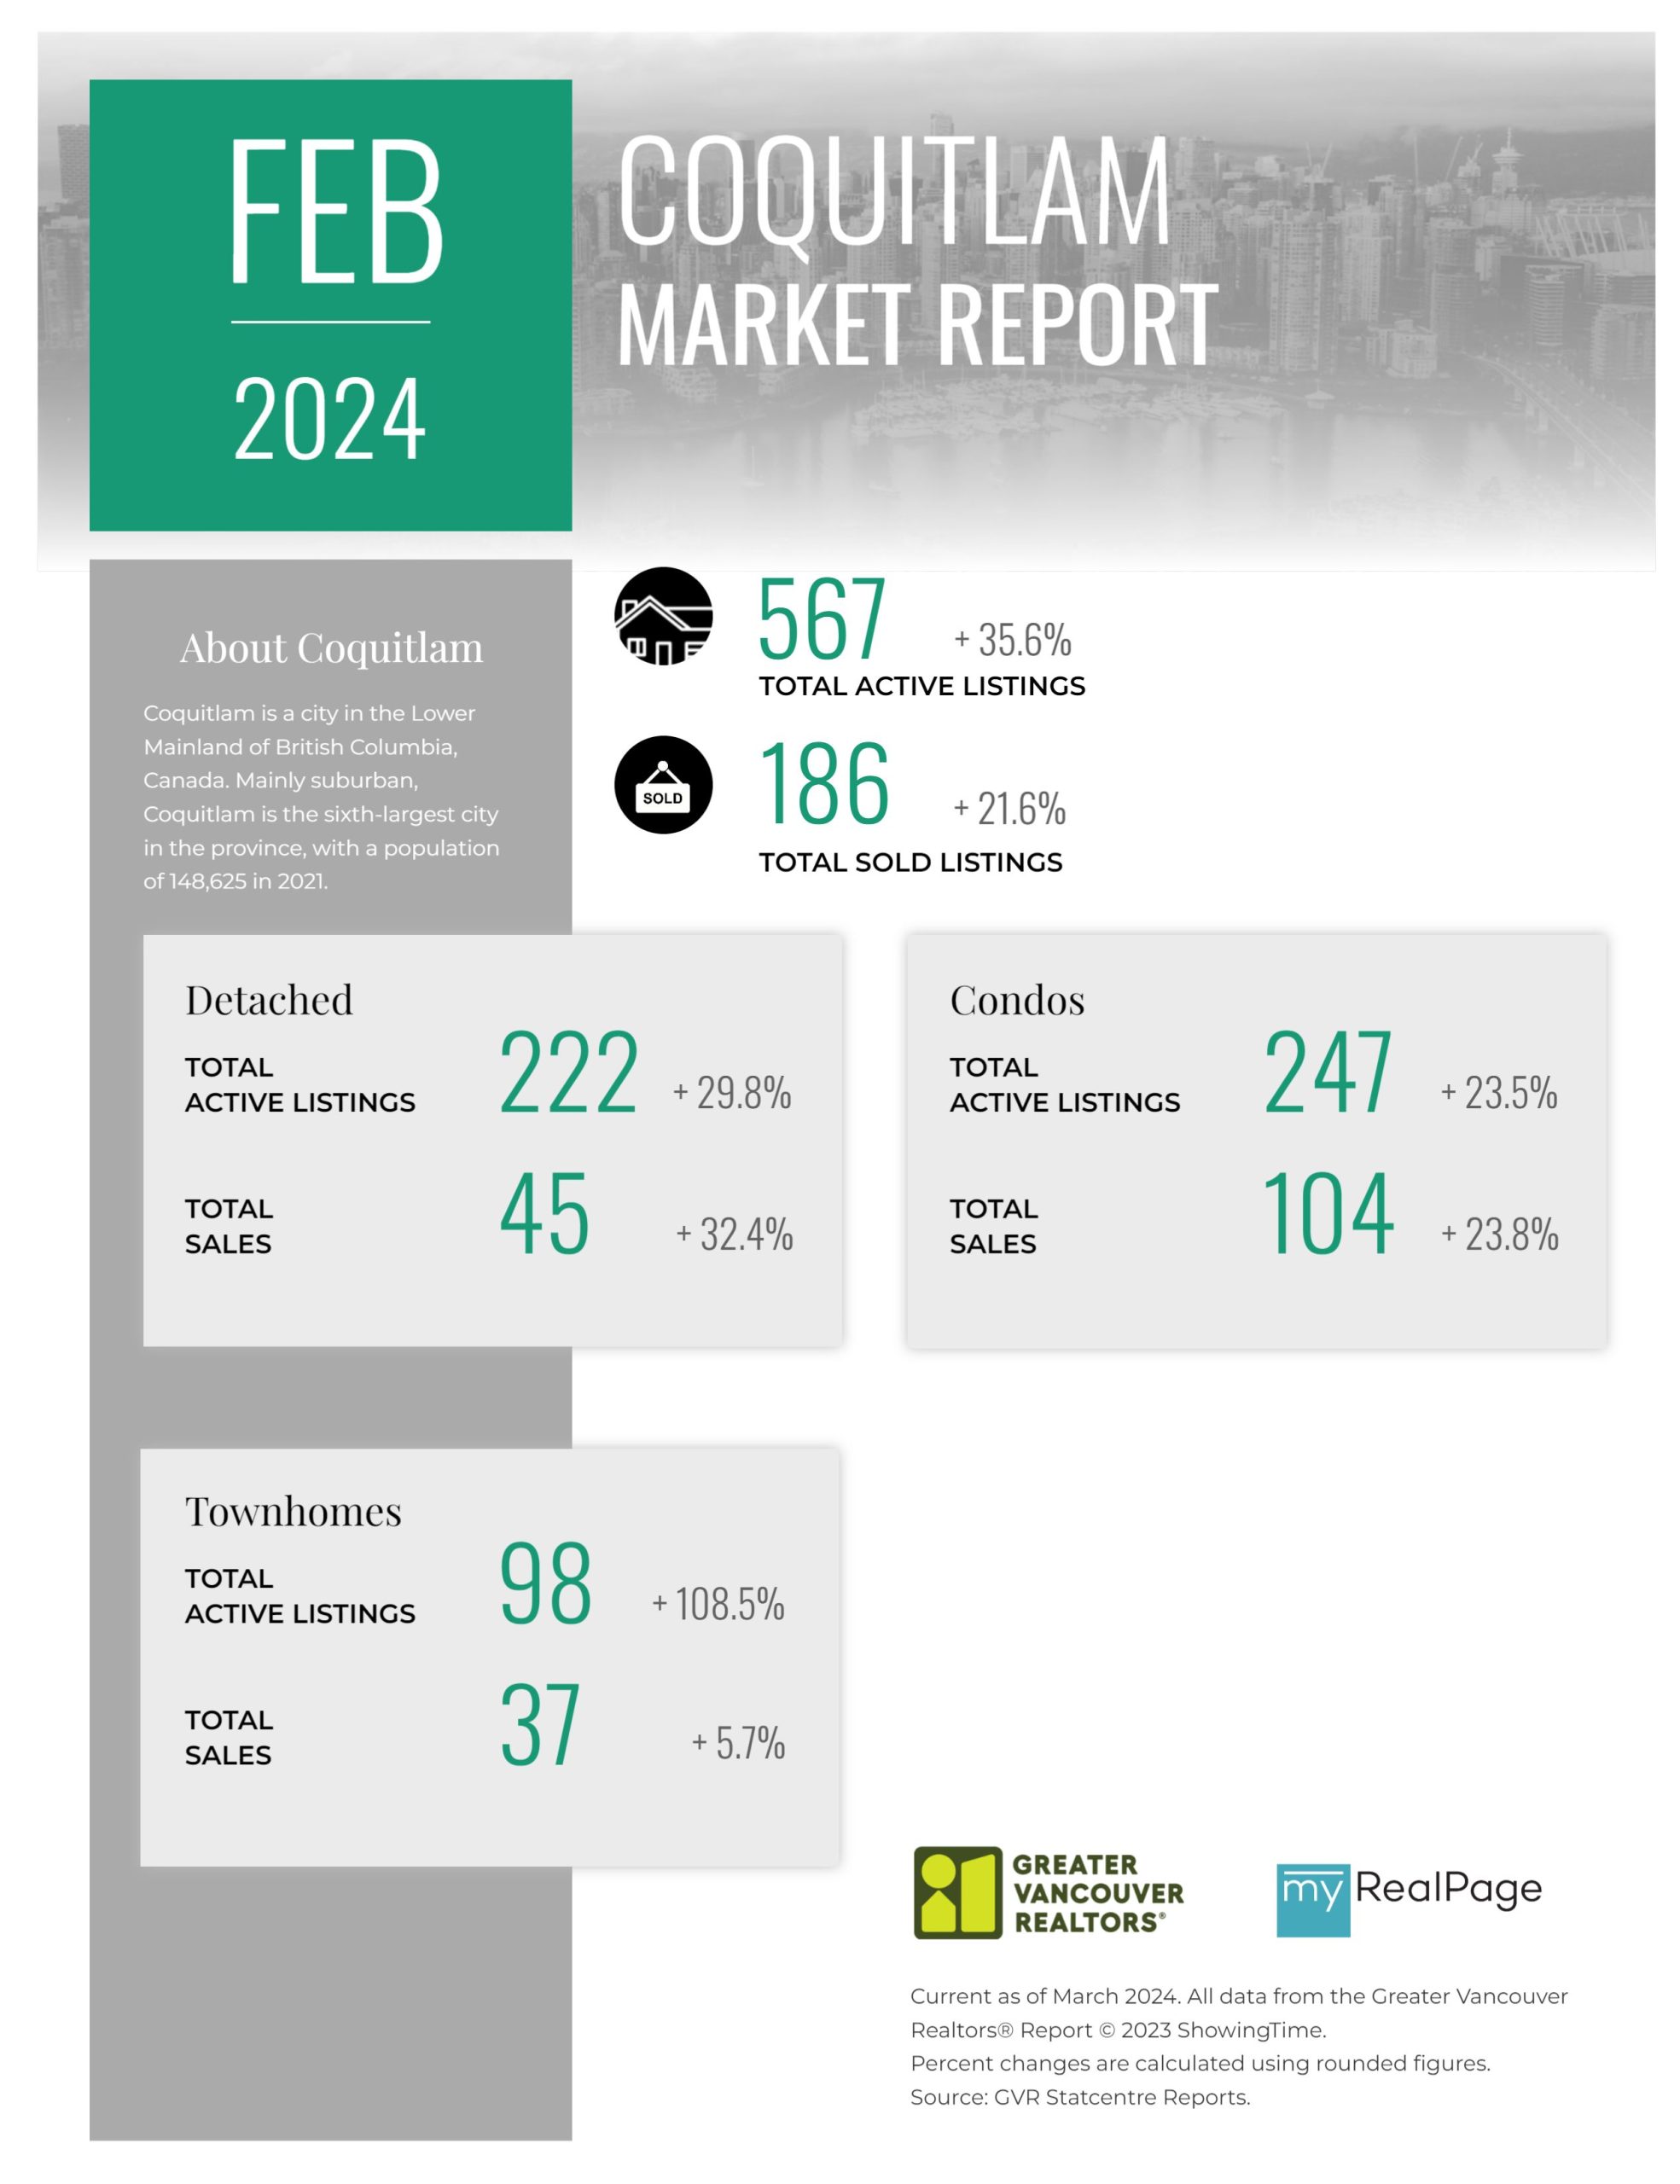
Printable Version – GVR February 2024 Data Infographics Report Coquitlam
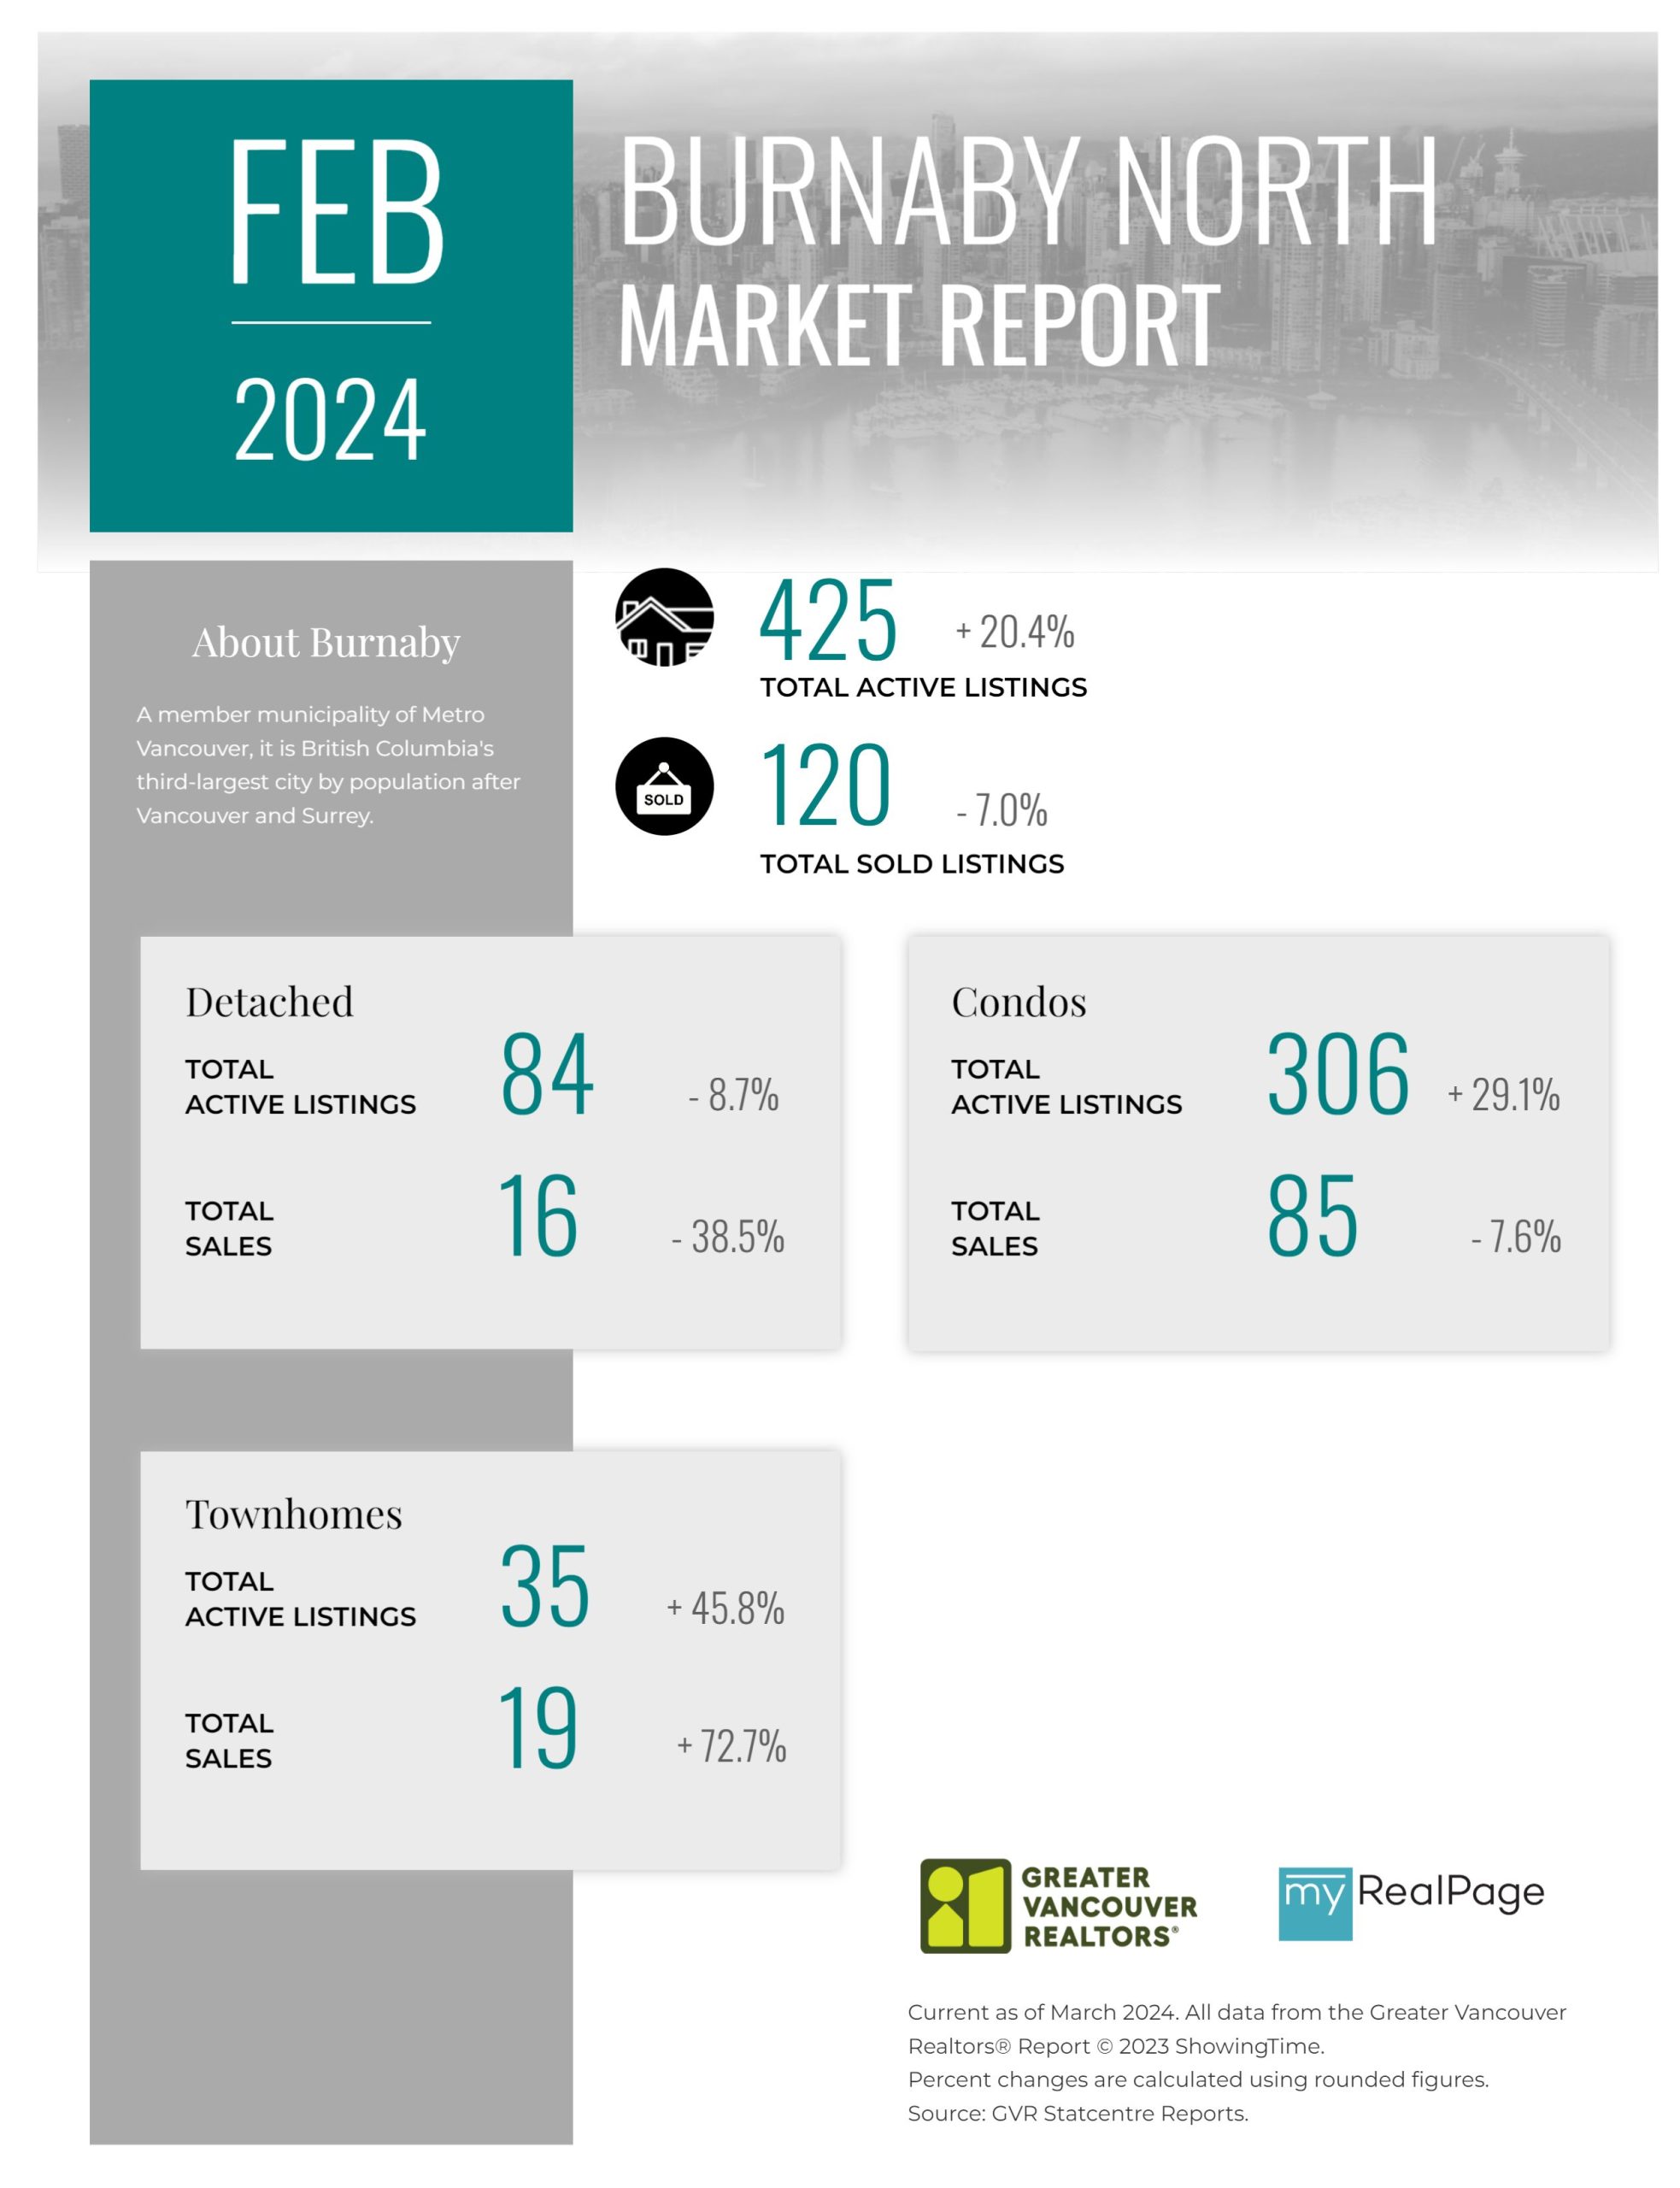
Printable Version – GVR February 2024 Data Infographic Report Burnaby North
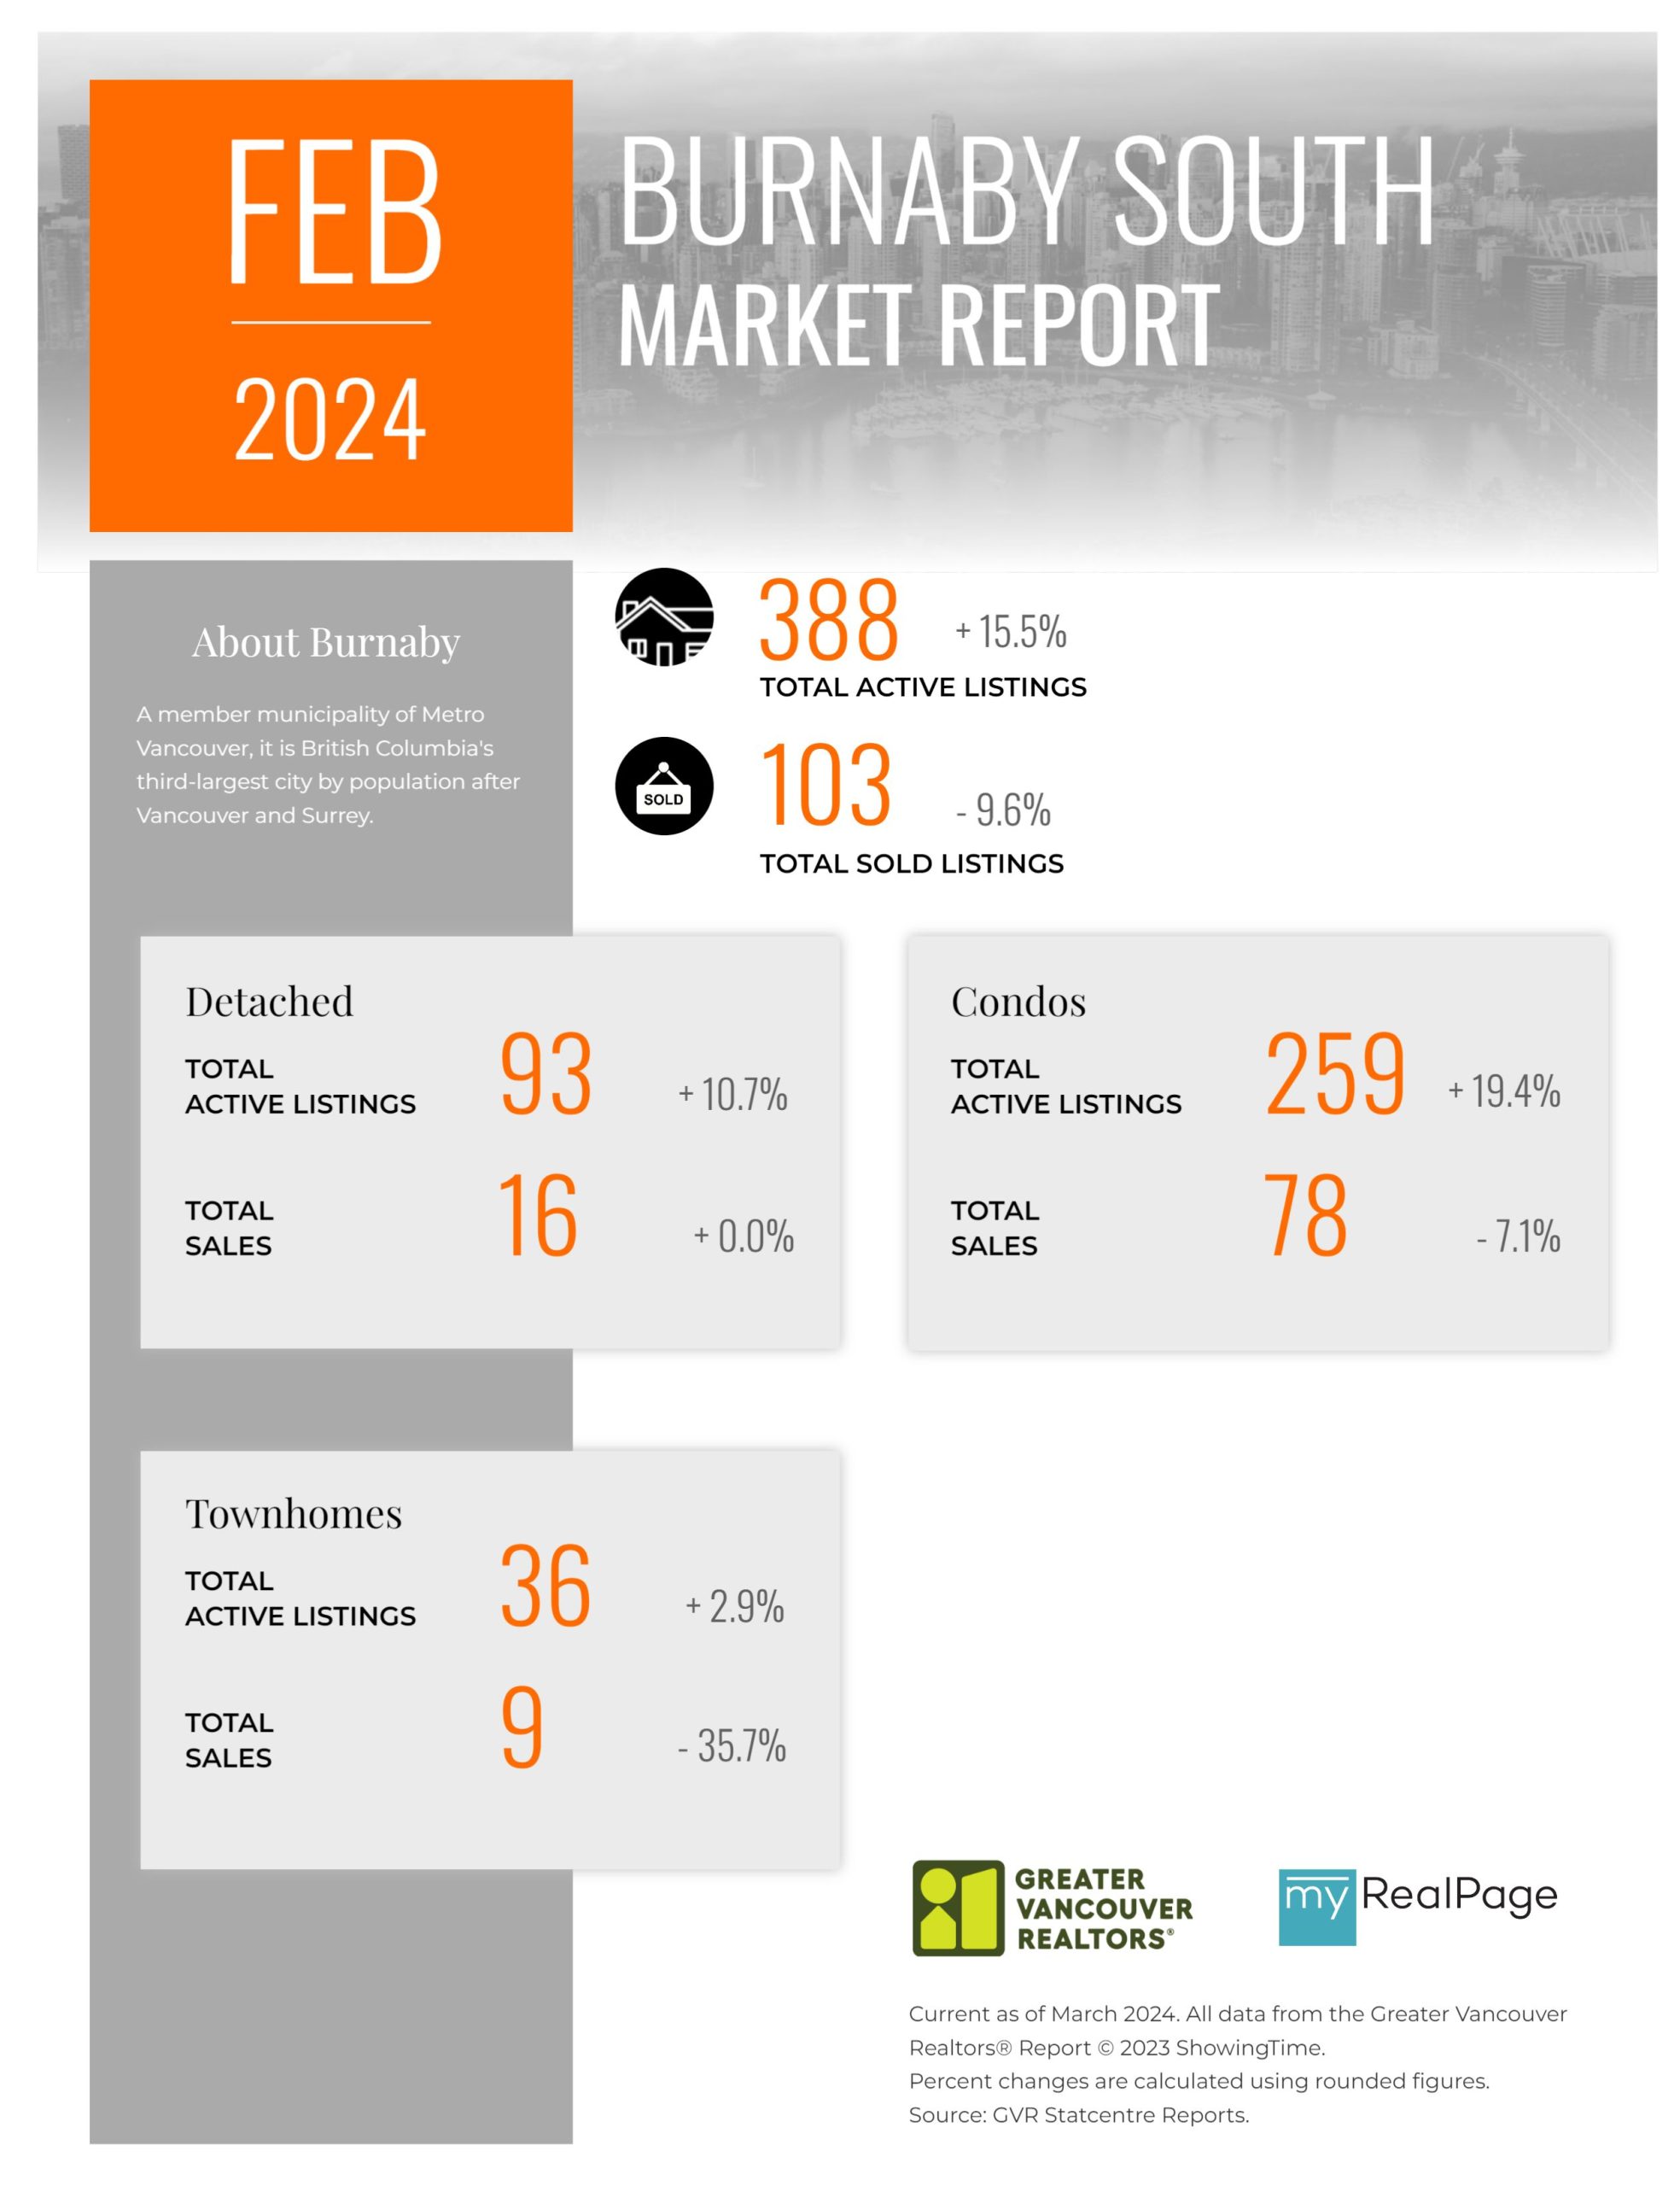
Printable Version – GVR February 2024 Data Infographics Report Burnaby South
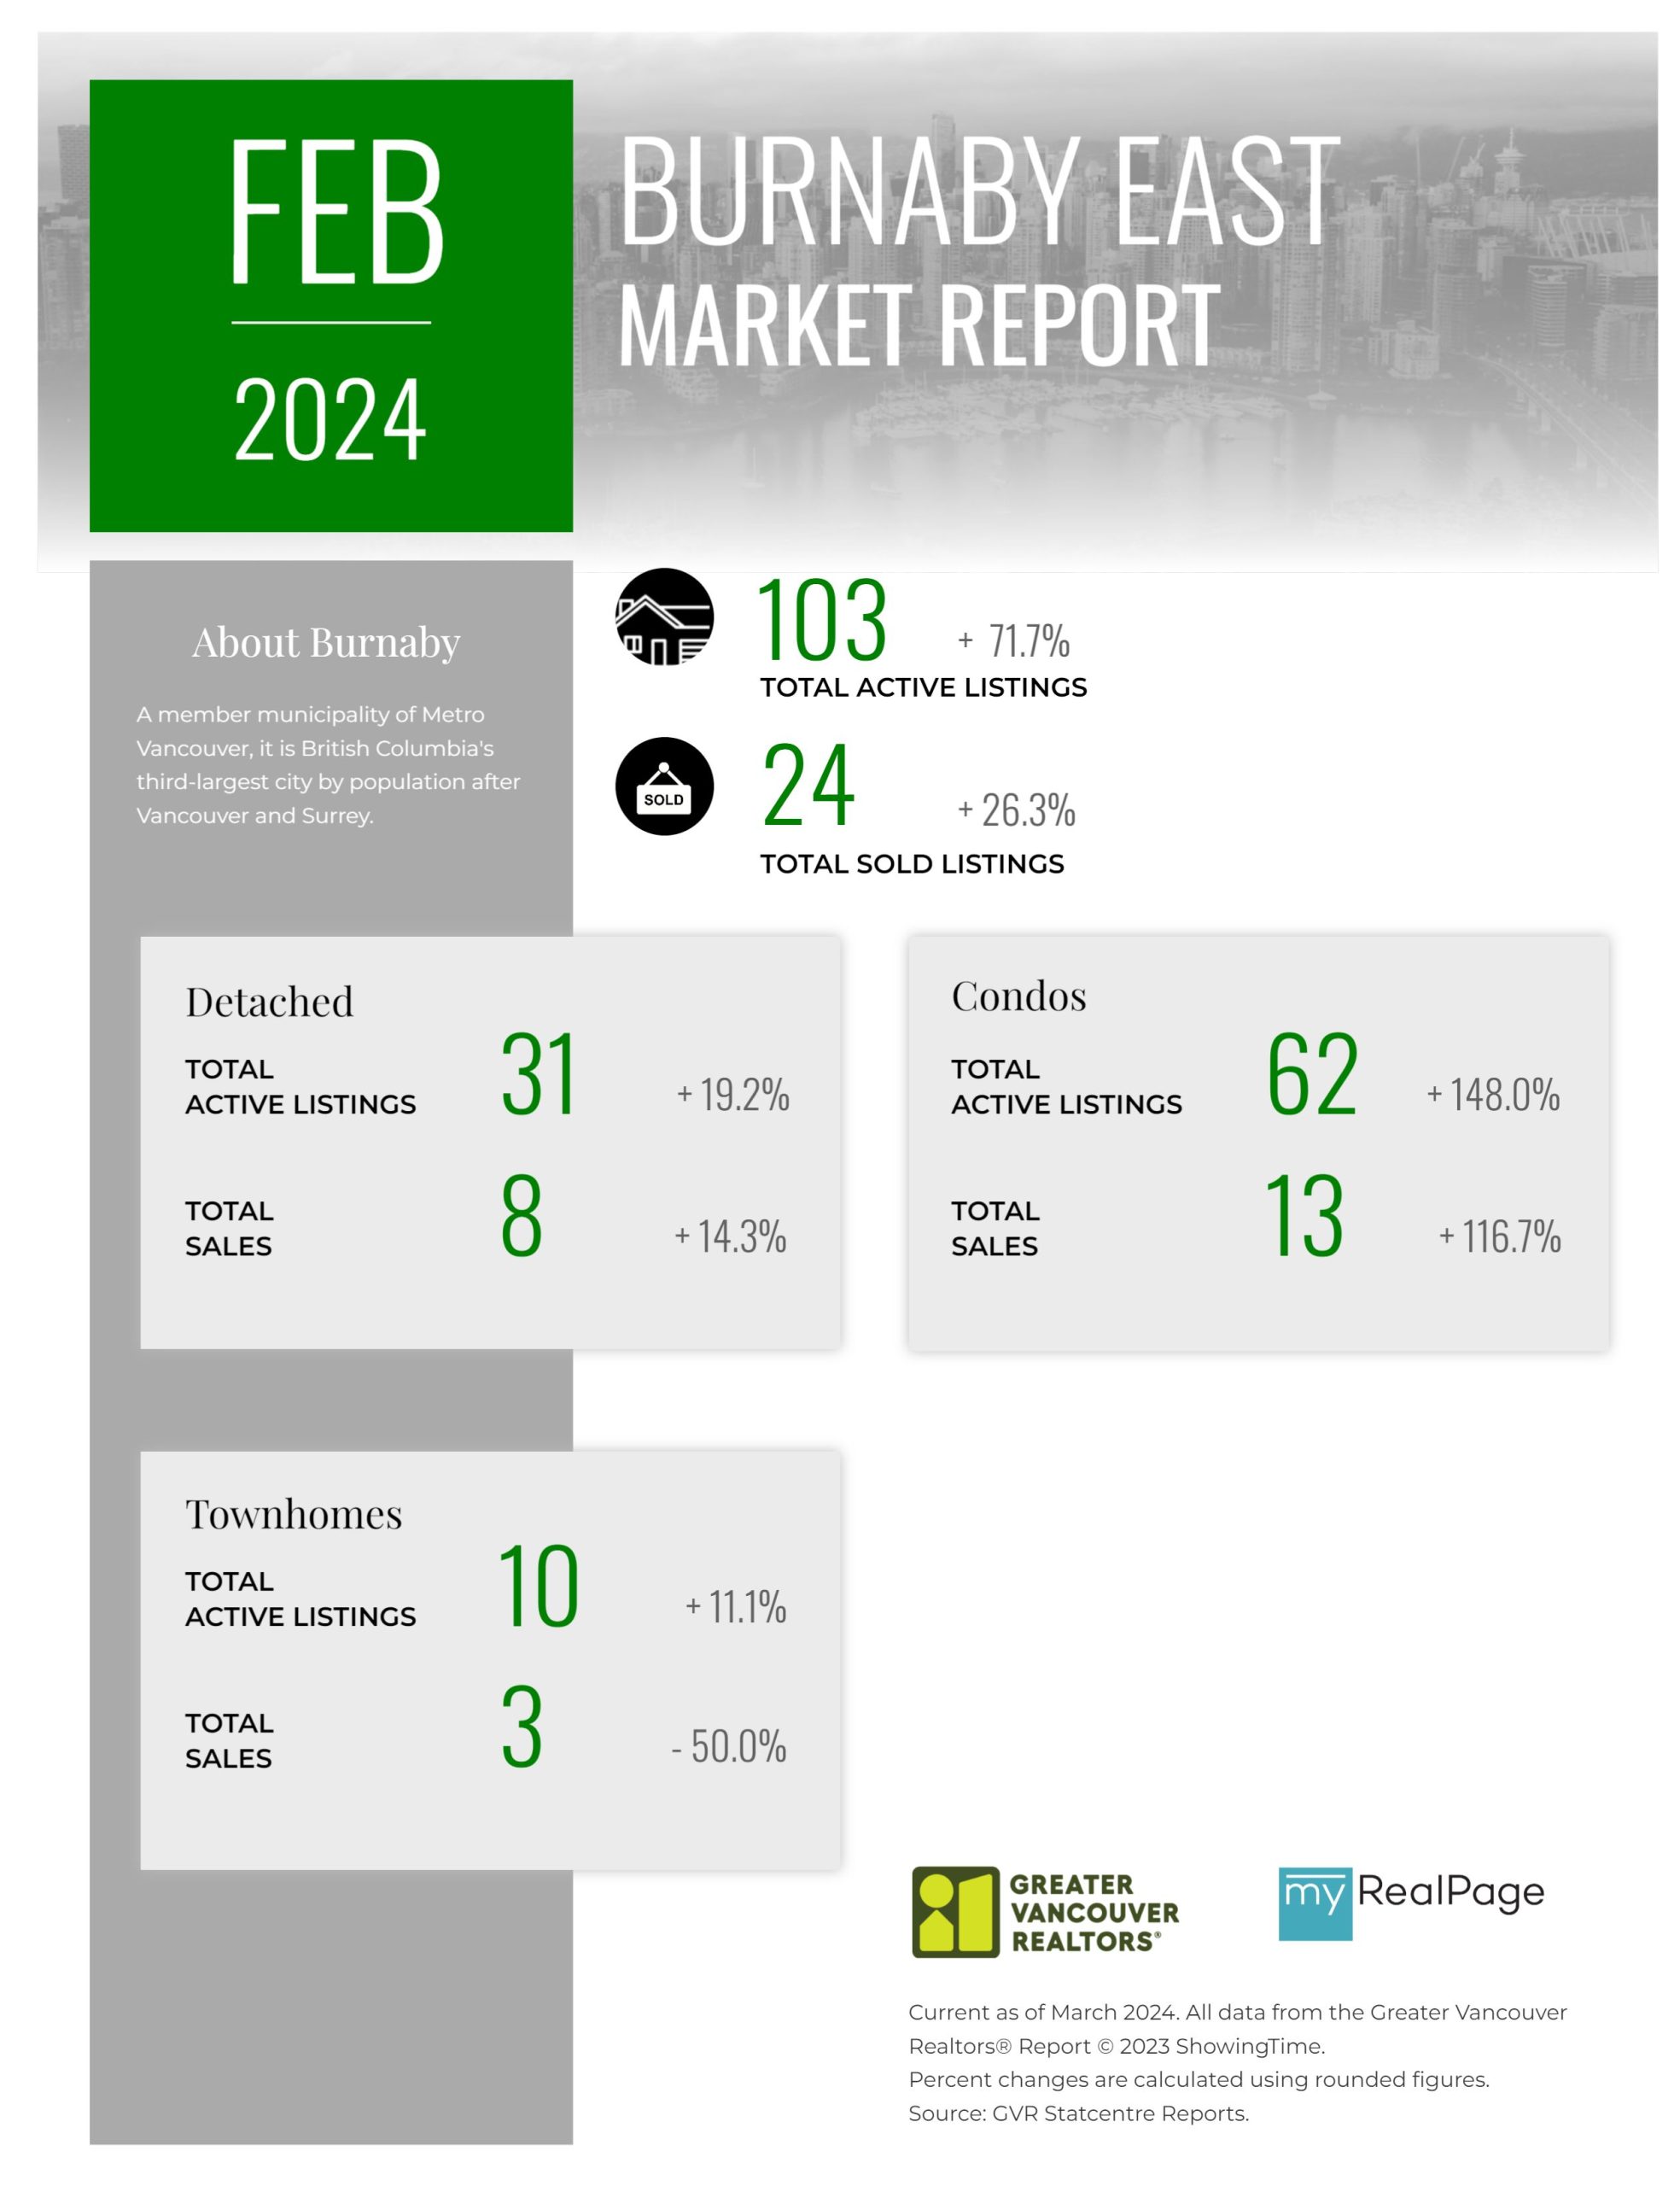
Printable Version – GVR February 2024 Data Infographics Report Burnaby East
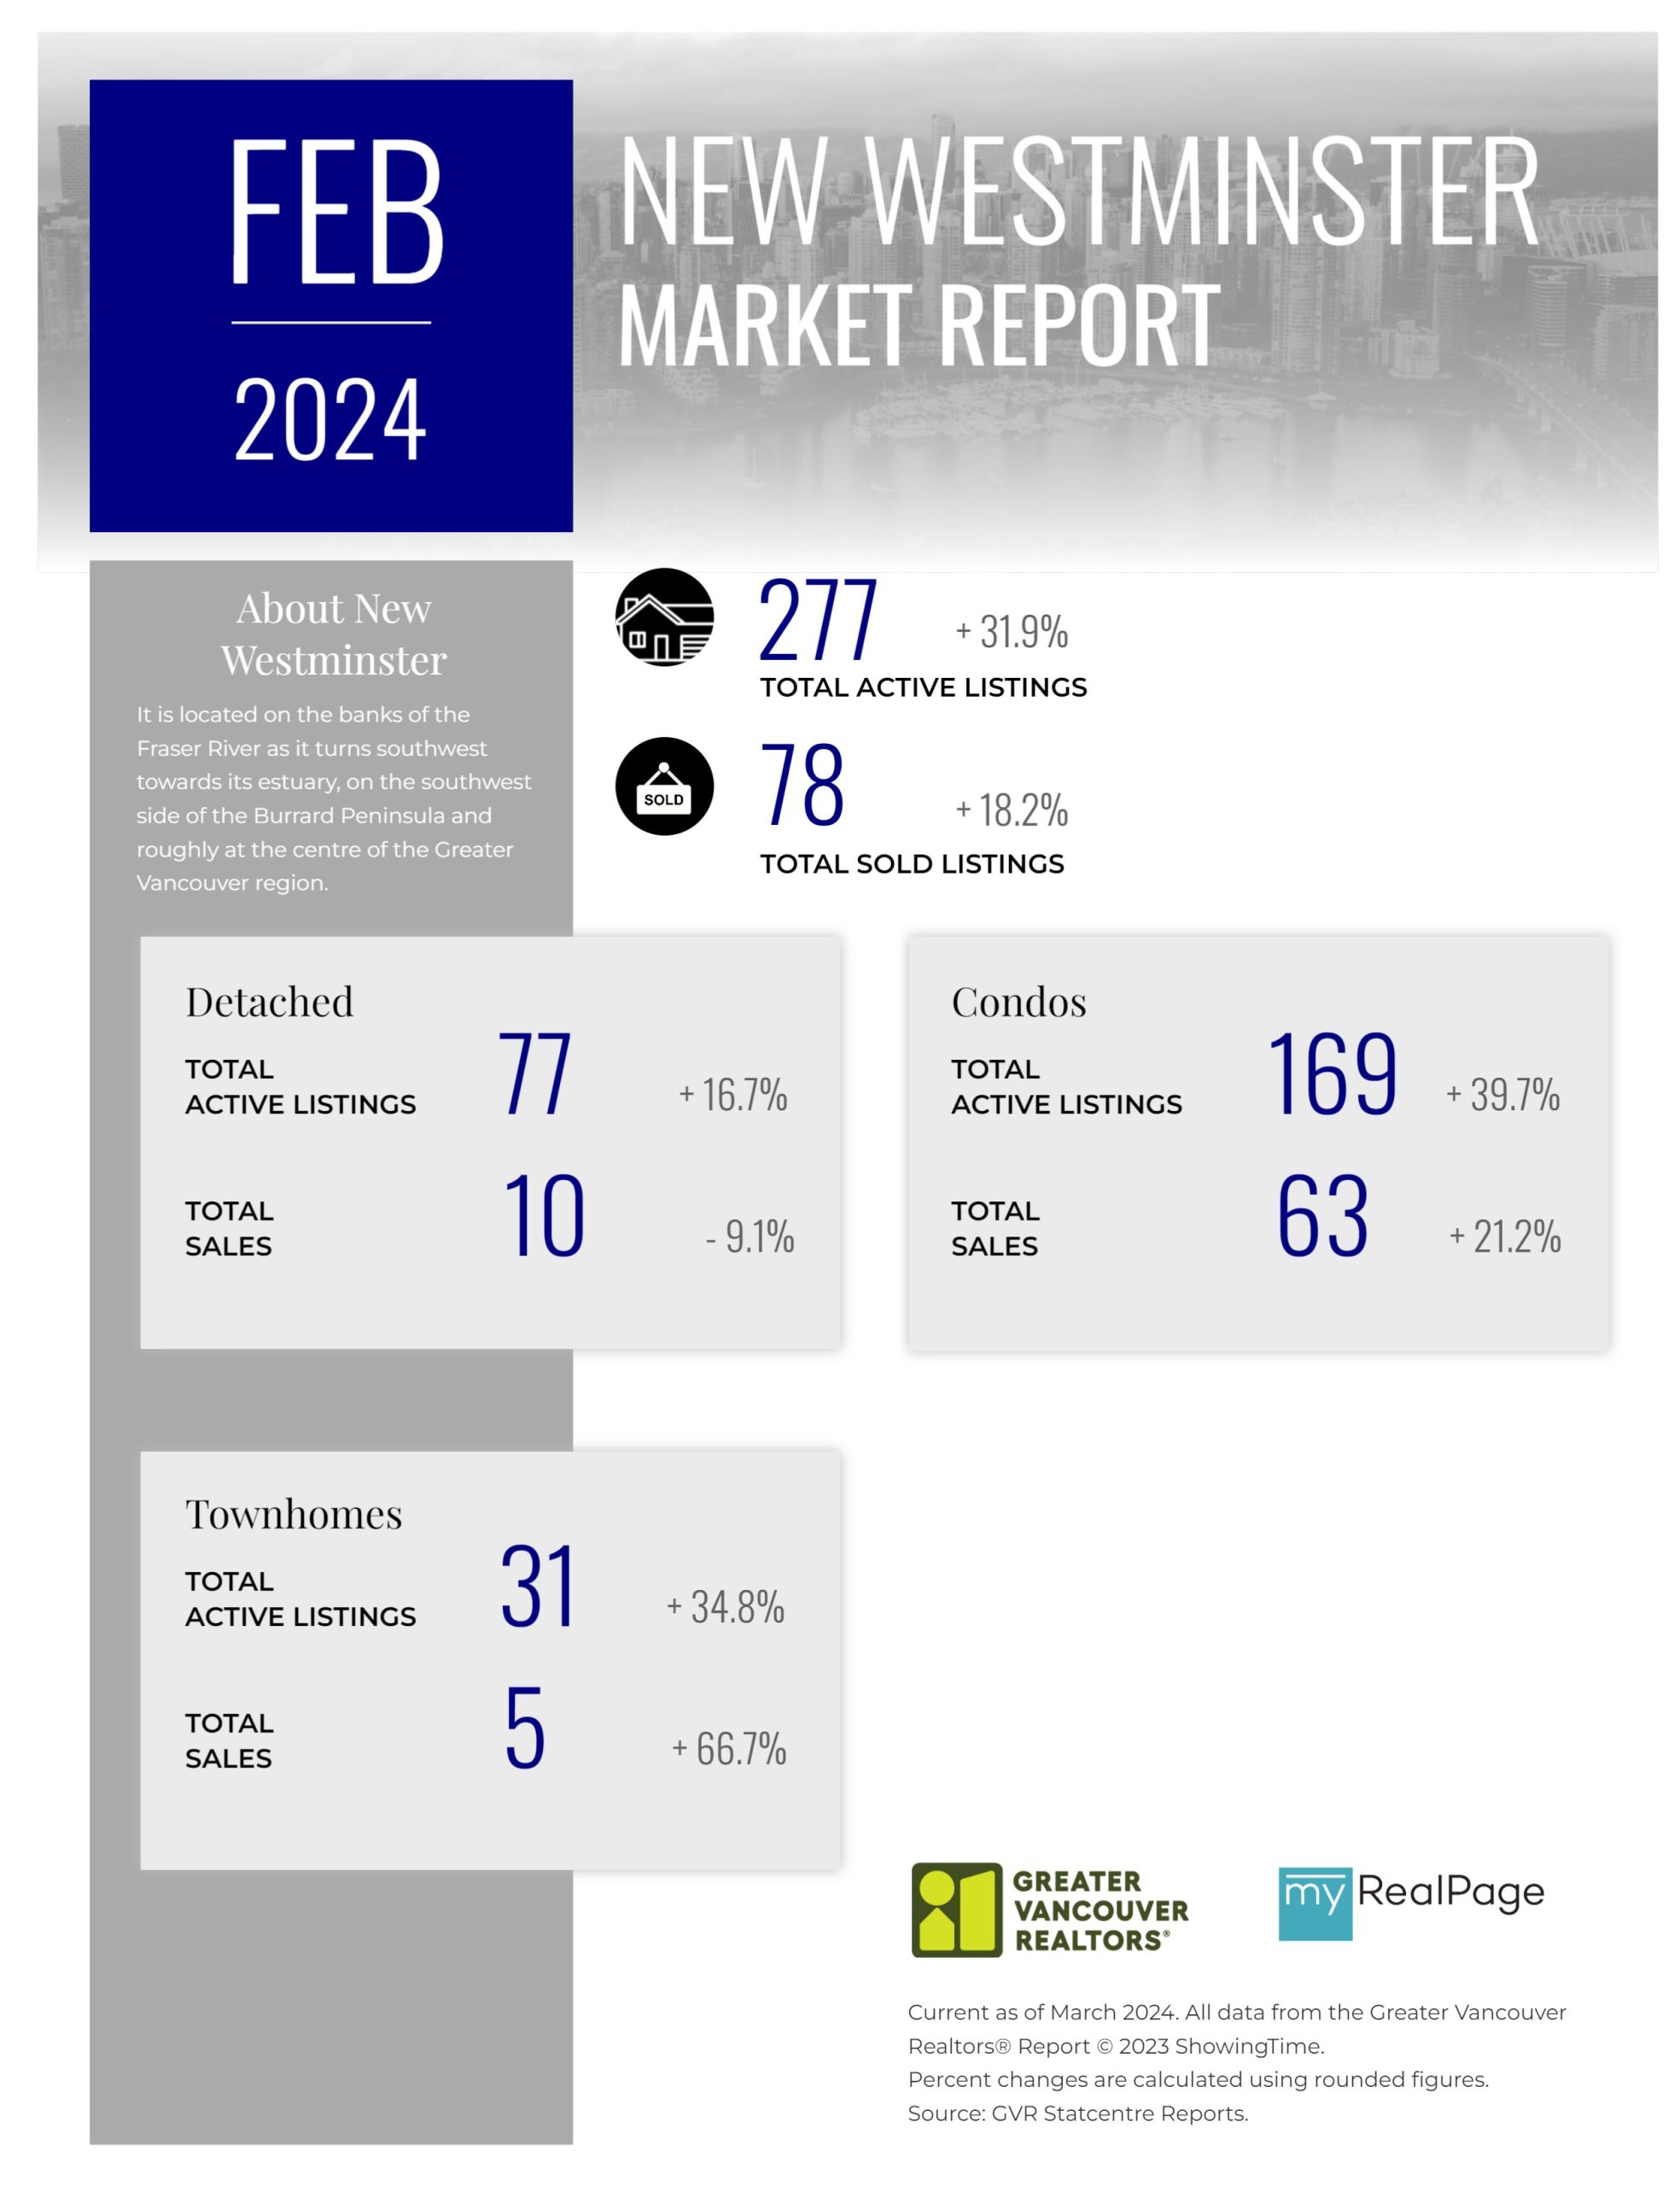
Printable Version – GVR February 2024 Data Infographics Report New Westminster
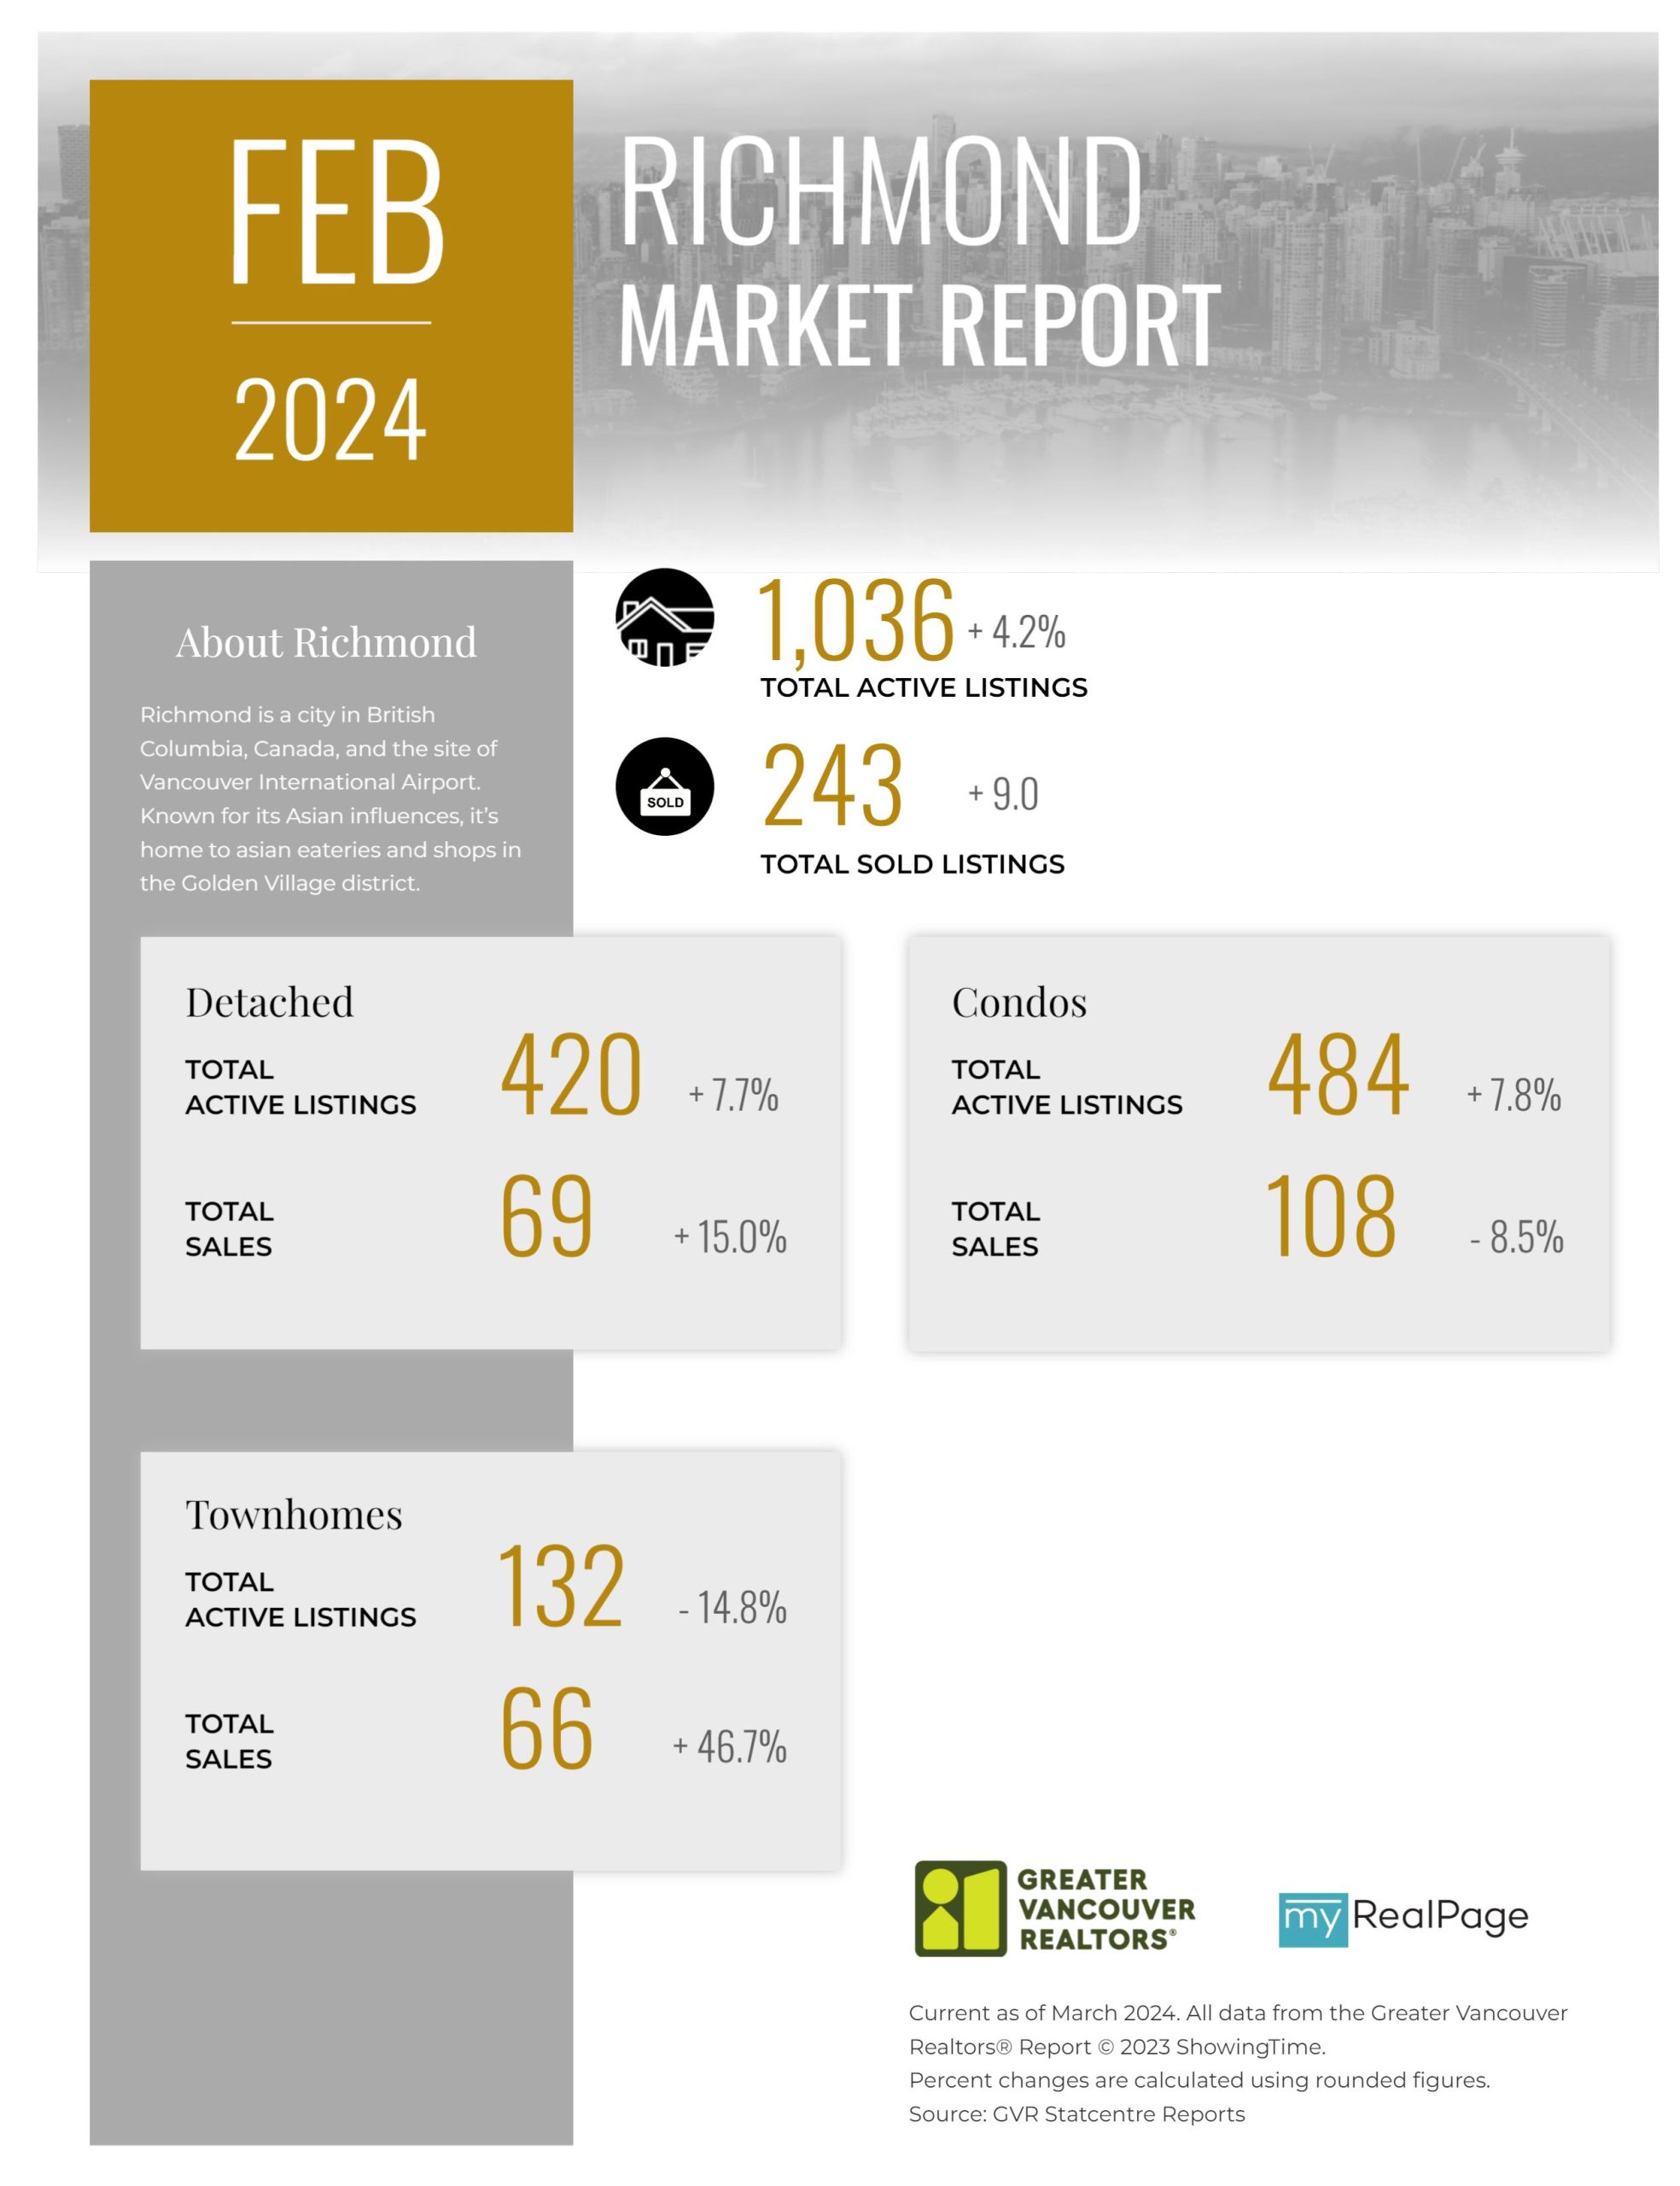
Printable Version – GVR February 2024 Data Infographics Report Richmond
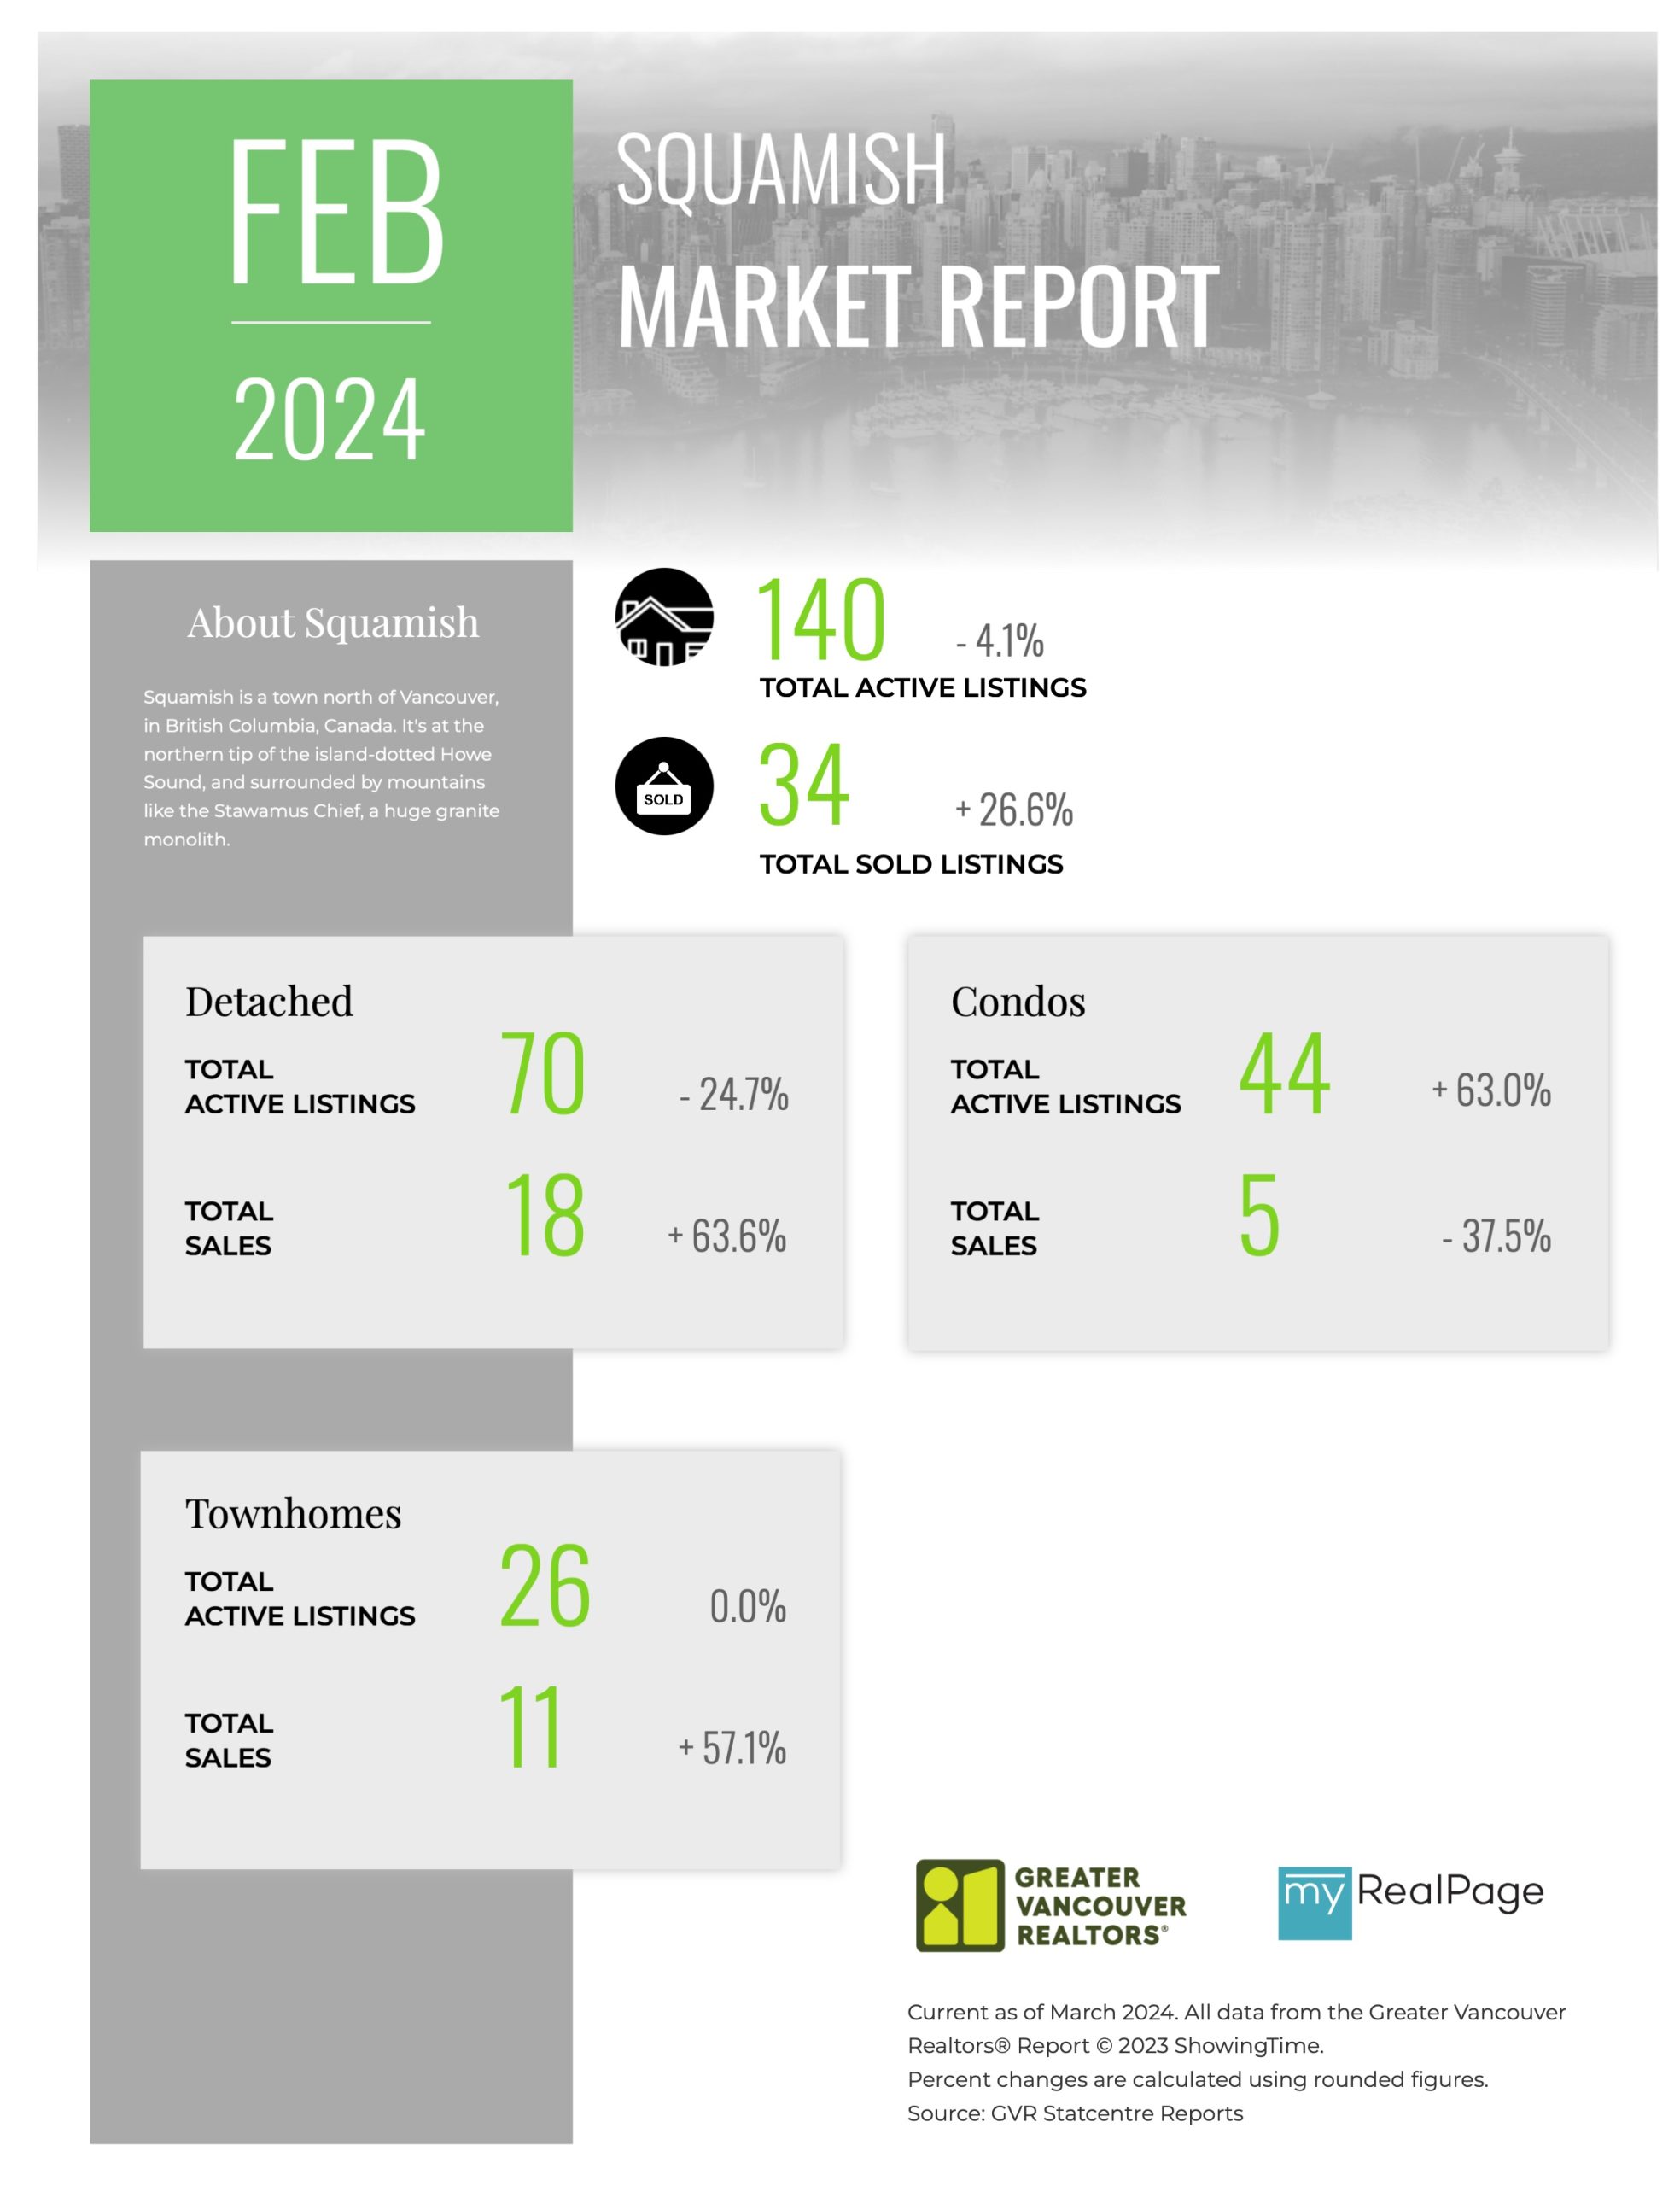
Printable Version – GVR February 2024 Data Infographics Report Squamish


Last Updated on March 21, 2024 by myRealPage
