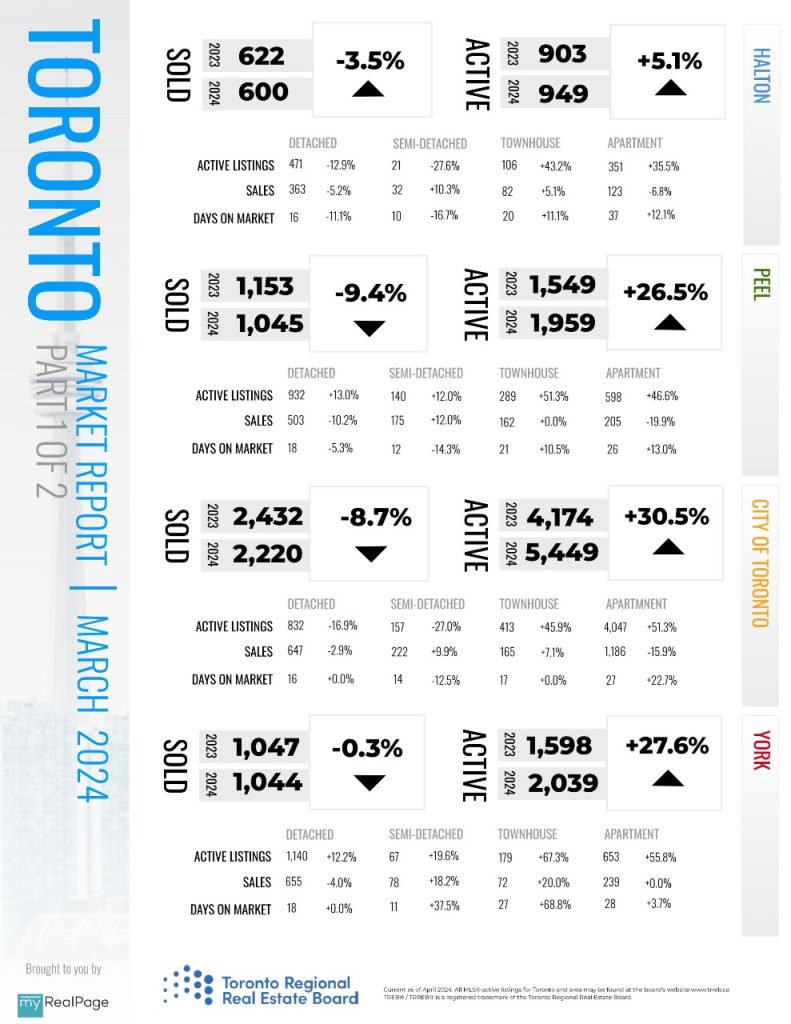
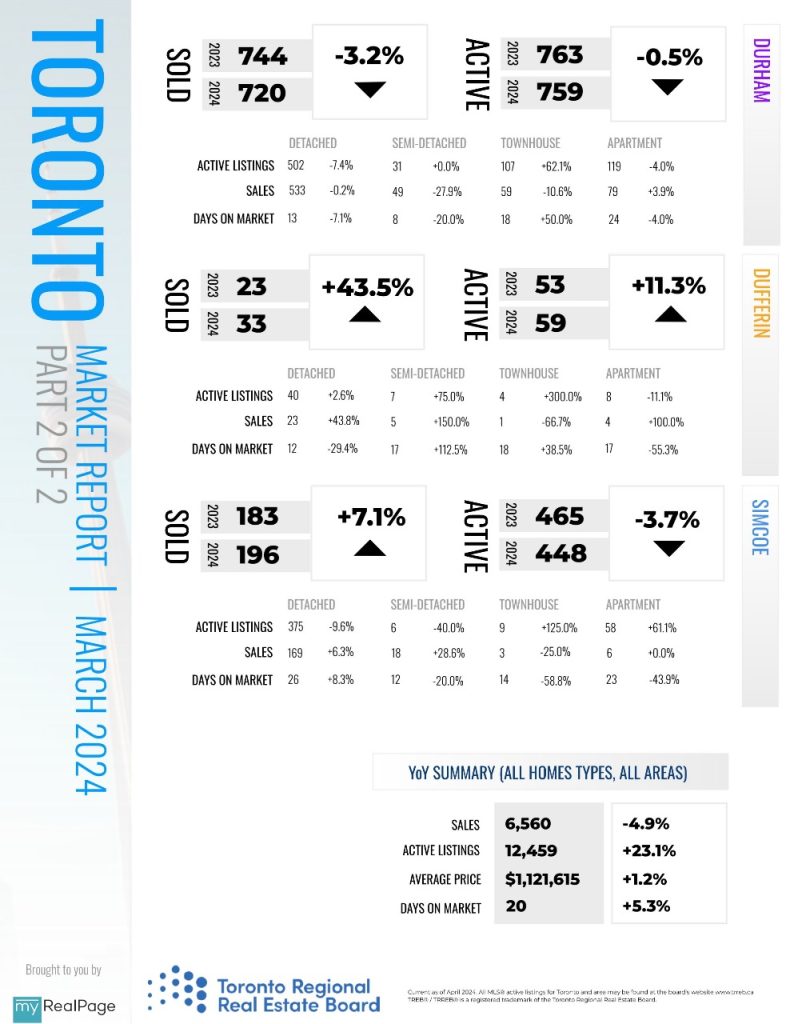
INFOGRAPHICS: March 2024 TRREB Toronto Market Reports

GTA REALTORS® Release March Stats
March 2024 home sales reported through TRREB’s MLS® System were lower than the March 2023 result, due in part to the statutory holiday Good Friday falling in March this year versus April last year. Despite a better-supplied market compared to last year, there was enough competition between buyers to see a moderate increase in the average March home price compared to last year’s level.
Greater Toronto Area (GTA) REALTORS® reported 6,560 sales through TRREB’s MLS® System in March 2024 – down by 4.5 per cent compared to March 2023. New listings were up by 15 per cent over the same period. On a seasonally adjusted monthly basis, sales were down by 1.1 per cent. New listings were down by three per cent compared to February.
The first quarter ended with sales up by 11.2 per cent year-over-year. New listings were up by a greater annual rate of 18.3 per cent.
“We have seen a gradual improvement in market conditions over the past quarter. More buyers have adjusted to the higher interest rate environment. At the same time, homeowners may be anticipating an improvement in market conditions in the spring, which helps explain the marked increase in new listings so far this year. Assuming we benefit from lower borrowing costs in the near future, sales will increase further, new listings will be absorbed, and tighter market conditions will push selling prices higher,” said TRREB President Jennifer Pearce.
Read the full report on TRREB website!
The following data is a comparison between March 2024 and March 2023 numbers, and is current as of April 2024. For last month’s numbers, check out our previous infographic!
Or follow this link for all our TREB / TRREB Infographics!
Download Printable Version – March 2024 TRREB, Toronto Market Report Part 1
Download Printable Version – March 2024 TRREB, Toronto Market Report Part 2
Last Updated on April 5, 2024 by myRealPage


