INFOGRAPHICS: July 2024 CREB City And Region Market Reports

Supply levels improve taking some pressure off prices
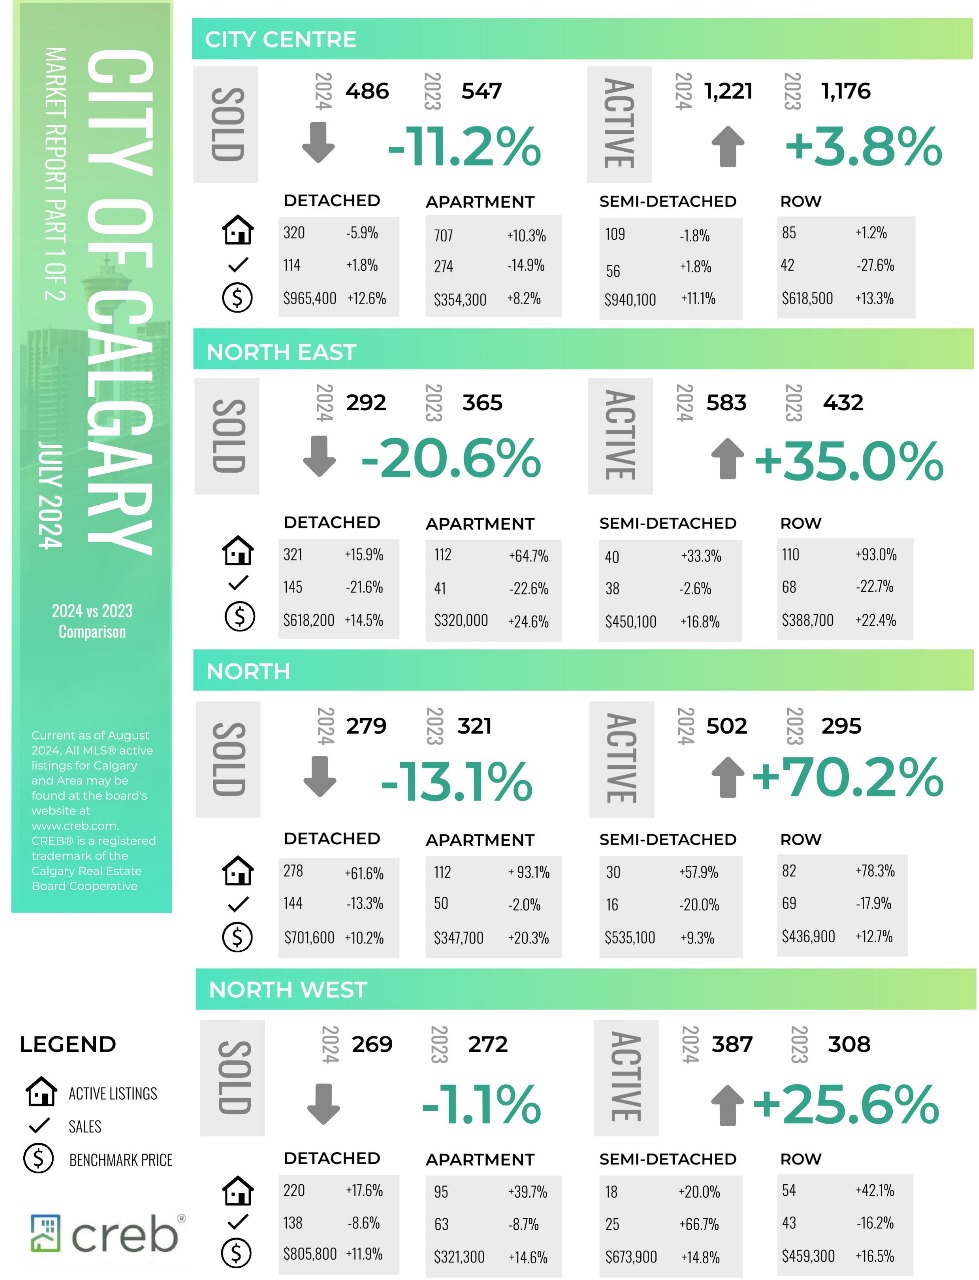
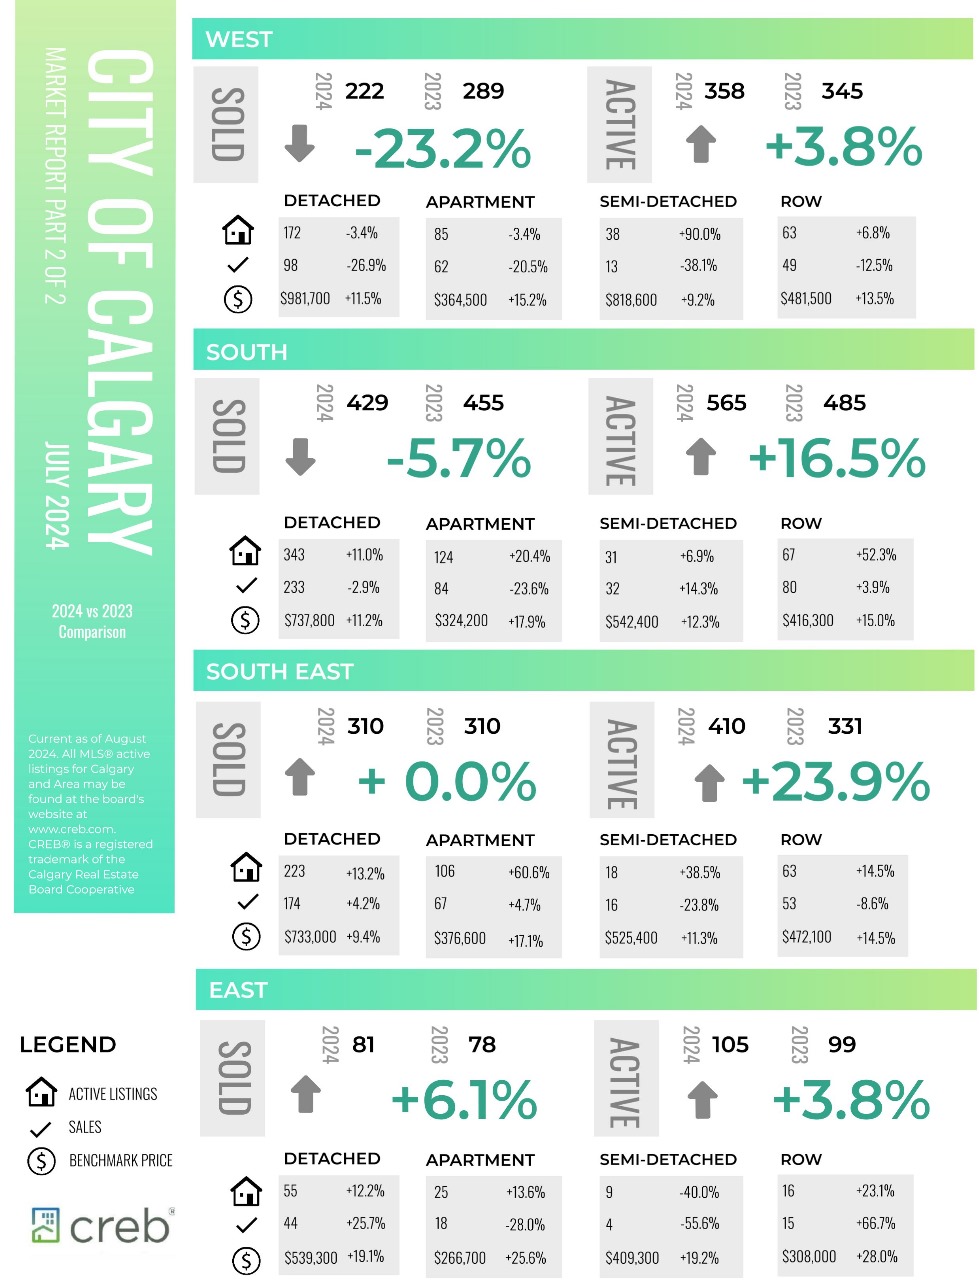
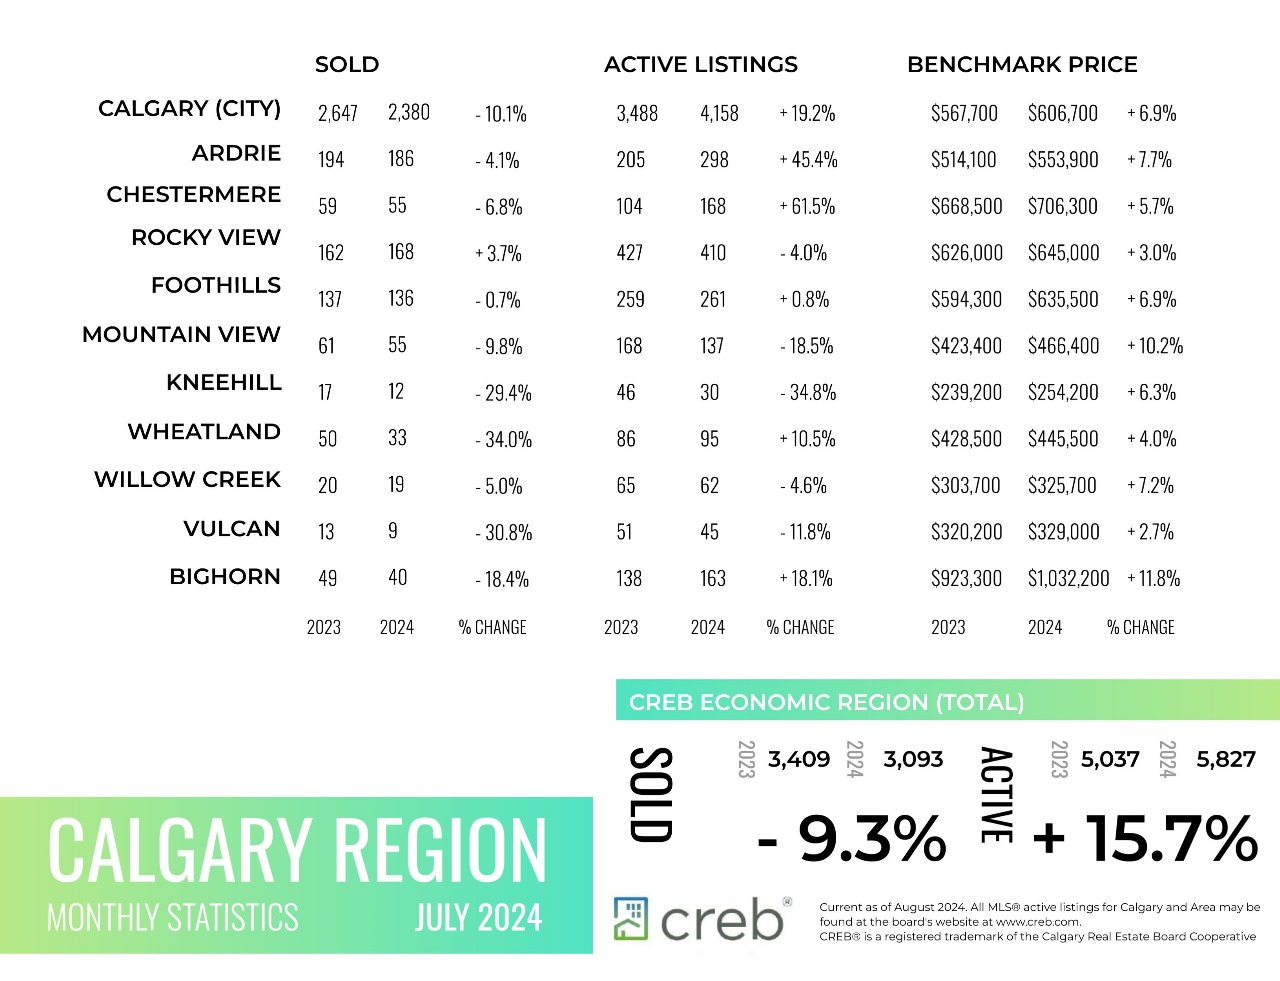
With the busy spring market behind us, we are starting to see some shifts in supply levels. With 2,380 sales and 3,604 new listings, the sales-to-new listings ratio fell to 66 per cent, supporting a gain in inventory. Inventories rose to 4,158 units, still 33 per cent below what we typically see in July, but the first time they have pushed above 4,000 units in nearly two years. Although the majority of supply growth occurred for homes priced above $600,000, the rise has helped shift the market away from the extreme sellers’ market conditions experienced throughout the spring.
“While we are still dealing with supply challenges, especially for lower-priced homes, more options in both the new home and resale market have helped take some of the upward pressure off home prices this month,” said Ann-Marie Lurie, Chief Economist at CREB®. “This is in line with our expectations for the second half of the year, and should inventories continue to rise, we should start to see more balanced conditions and stability in home prices.”
Read the full report on the CREB website!
The following data is a comparison between July 2024 and July 2023 numbers, and is current as of August of 2024. For last month’s numbers, check out our previous infographic.
Or follow this link for all our CREB Infographics!
Click on the images for a larger view!
Download Printable Version – July 2024 CREB, City of Calgary Report Pages 1 and 2
Download Printable Version – July 2024 CREB, Calgary Region Report
Last Updated on August 6, 2024 by myRealPage
