INFOGRAPHICS: February 2025 CREB City And Region Market Reports

Sales remain above long-term trends despite declines
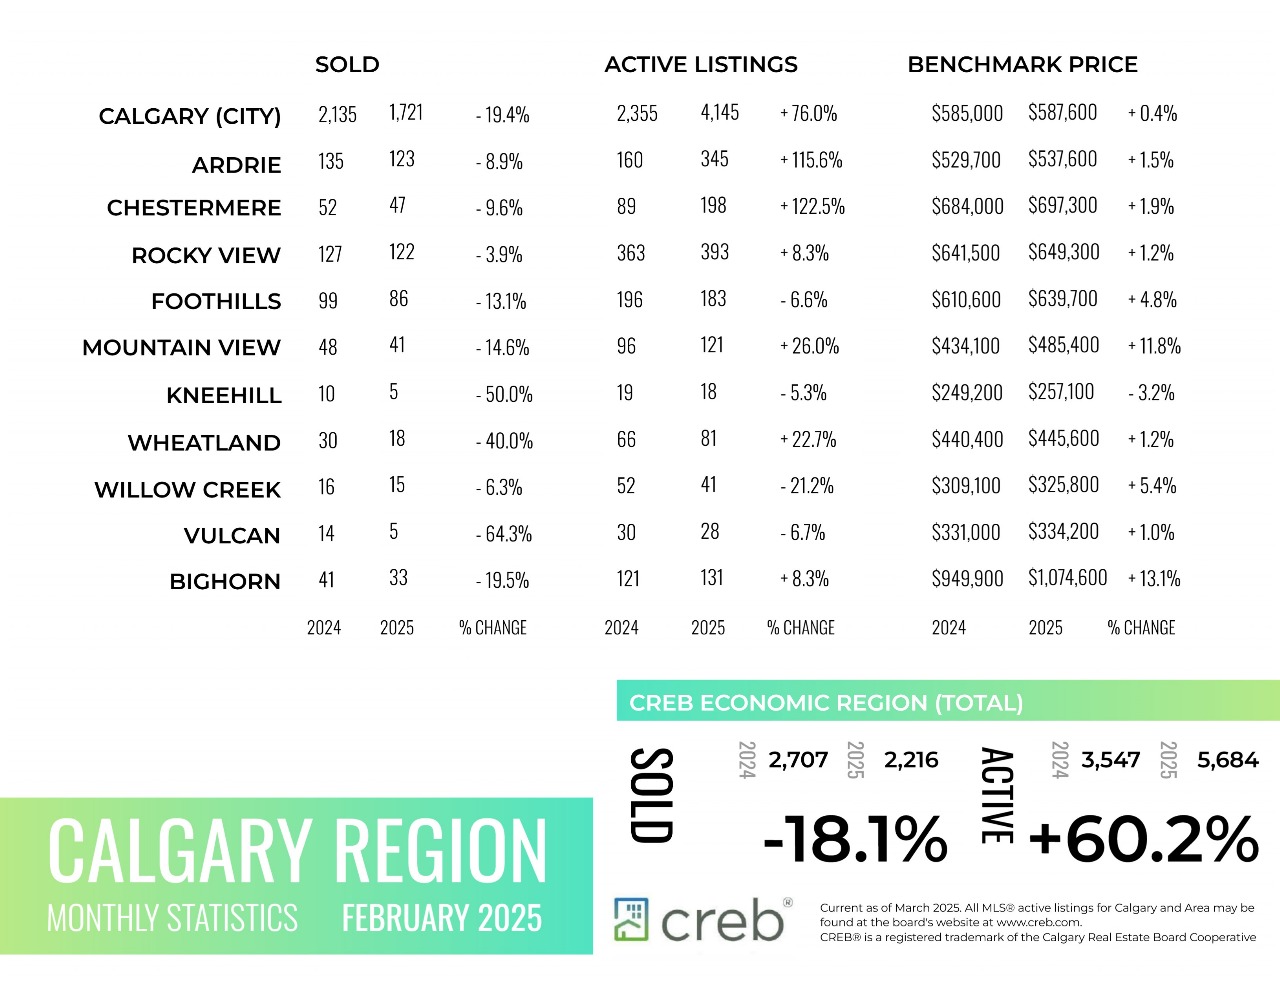
For the second month in a row, inventory levels saw substantial year-over-year growth, rising by 76 per cent to 4,145 units in February. While inventory increases were seen across all price ranges, the largest increases were in homes priced under $500,000; this increase was driven by substantial growth in the more affordable apartment and row/townhouse sectors. The overall months of supply were 2.4, similar to last month but more than double this time last year. Apartment-style units remained the most well-supplied at 3.1 months.
There were 1,721 sales in February, which was above historical averages for the month but 19 per cent lower than levels seen last year and significantly lower than the record levels seen in the post-pandemic period. New Listings in February reached 2,830, roughly in line with historical averages for the month. The sales-to-new listings ratio for the month was 61 per cent, higher than historical averages but below levels seen in each of the last three years.
“Even though more people listed their homes for sale, there were actually fewer sales than in February 2024. So, we’re seeing the seller’s market of the past two or three years ease off,” said Alan Tennant, President and CEO of CREB®. “In turn, that’s caused the pace at which prices are increasing to slow down a bit, which should come as welcome news for buyers.”
Read the full report on the CREB website!
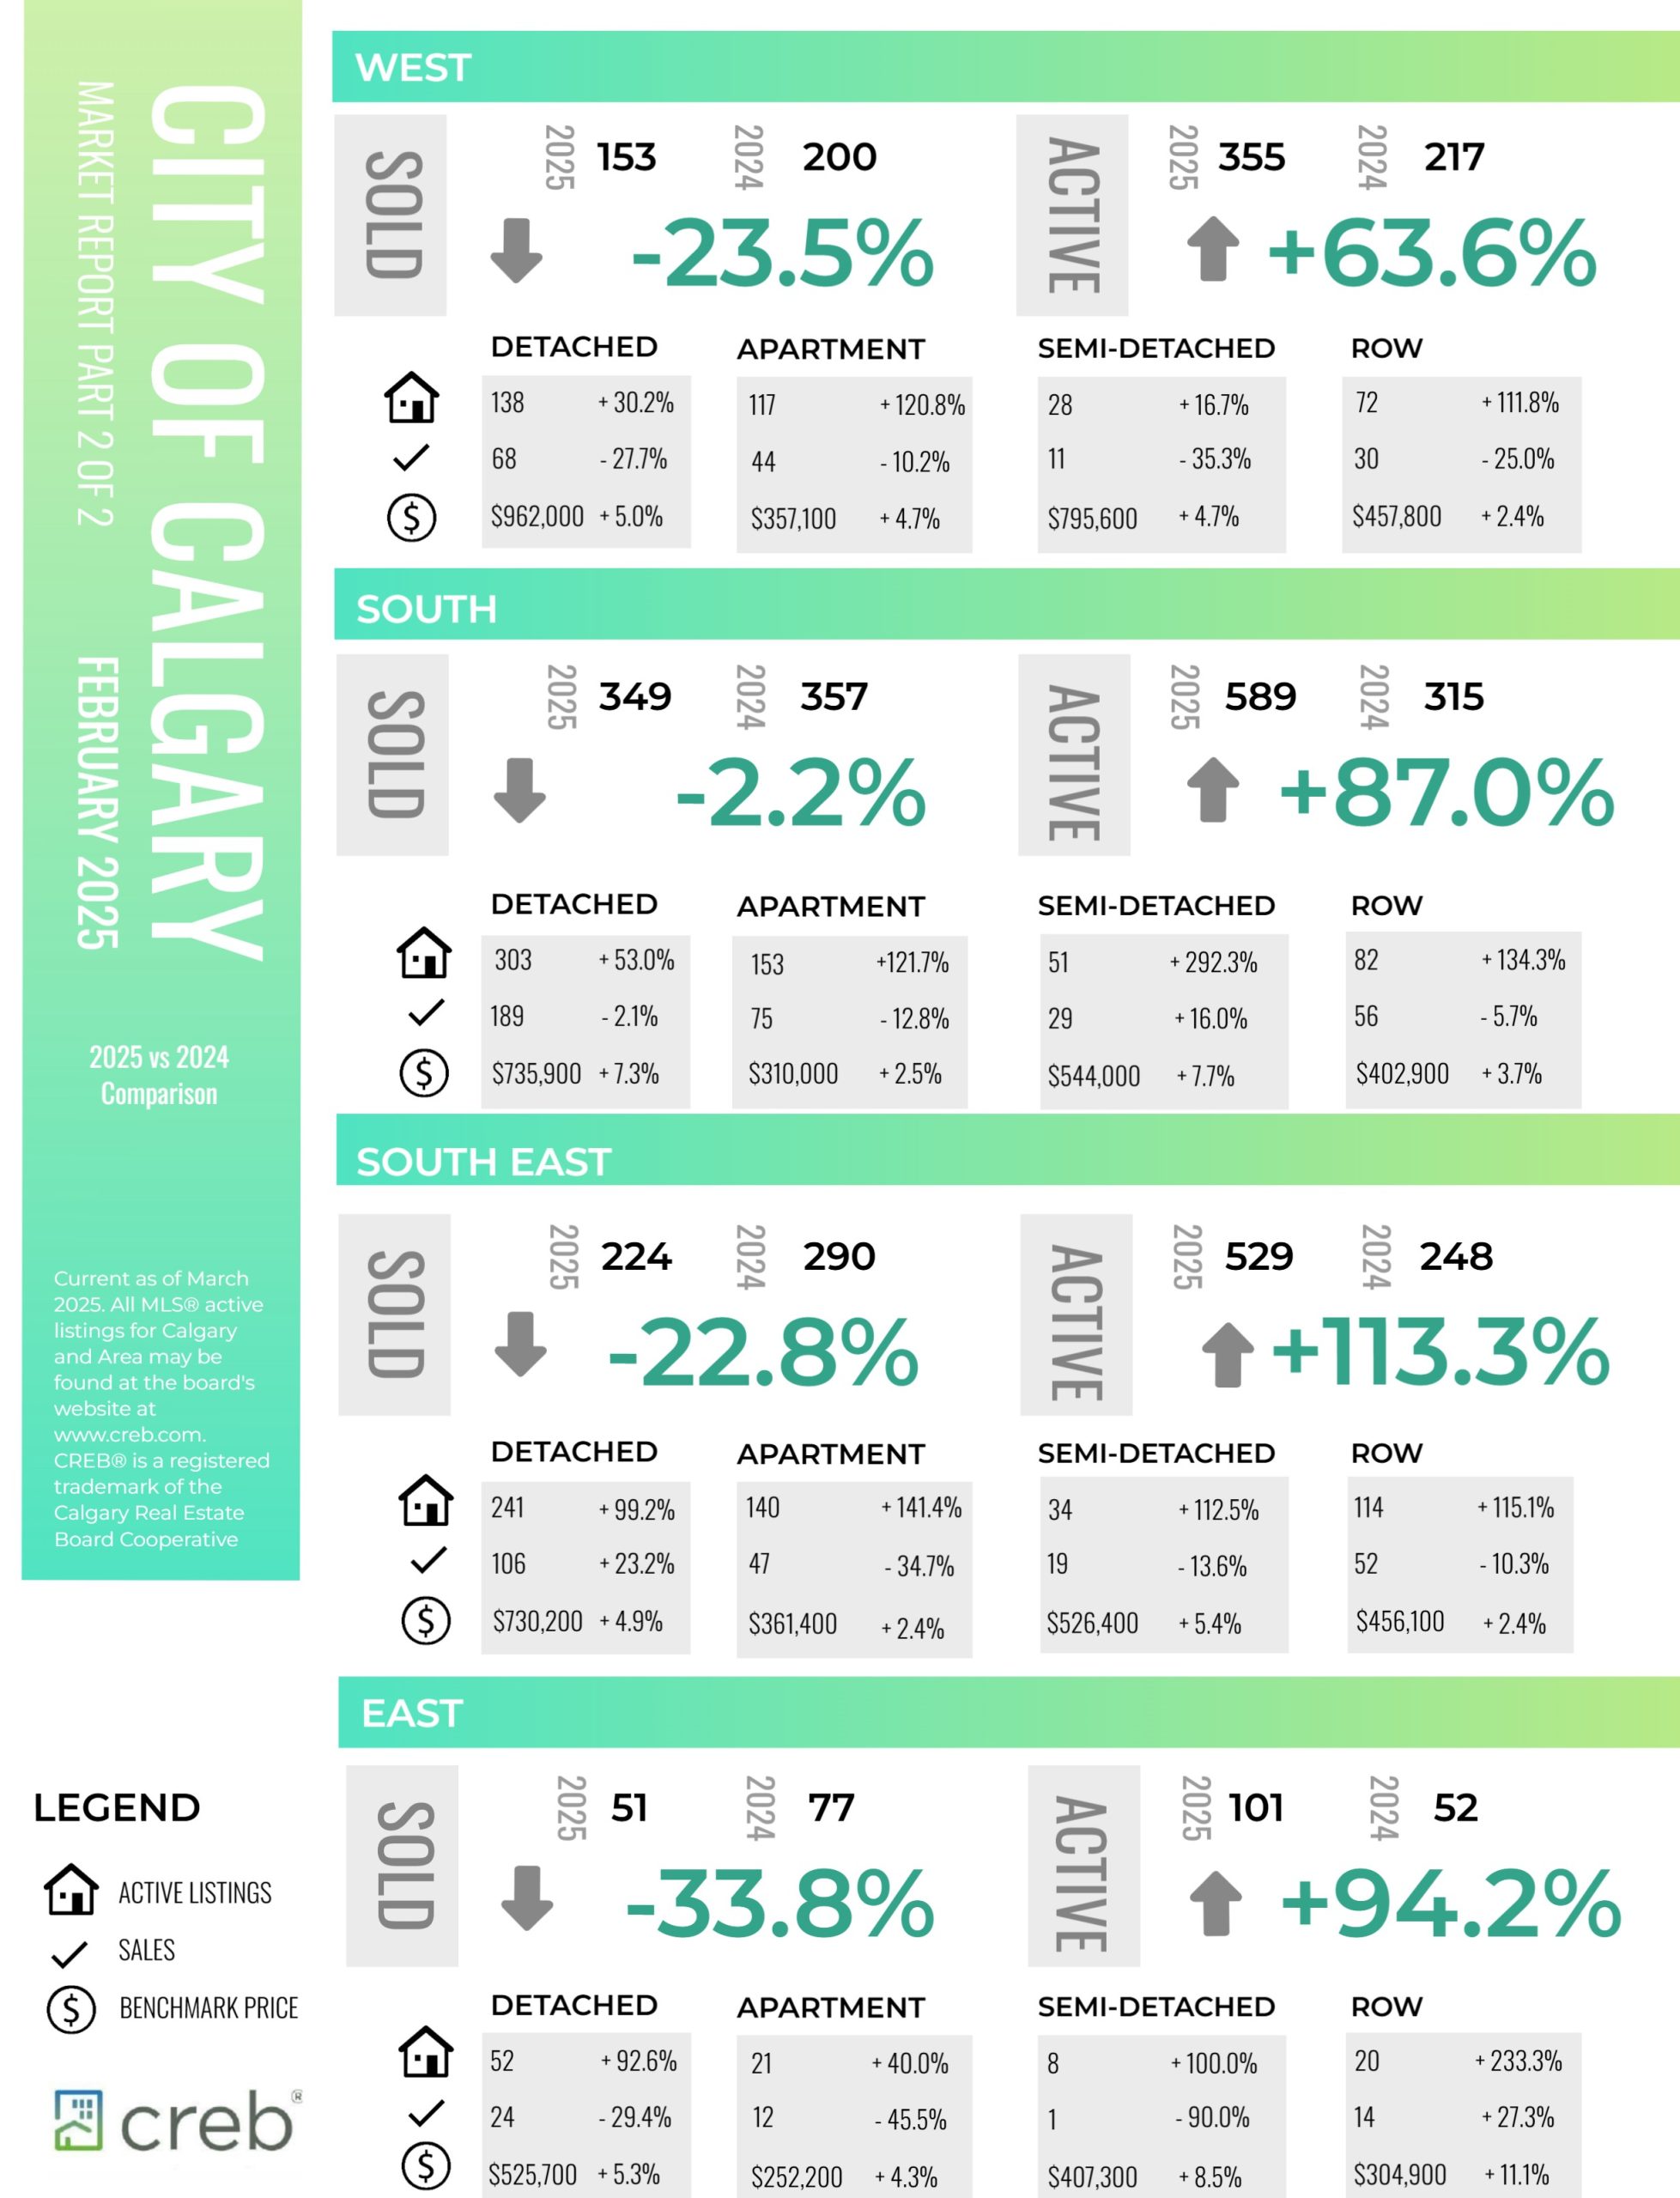
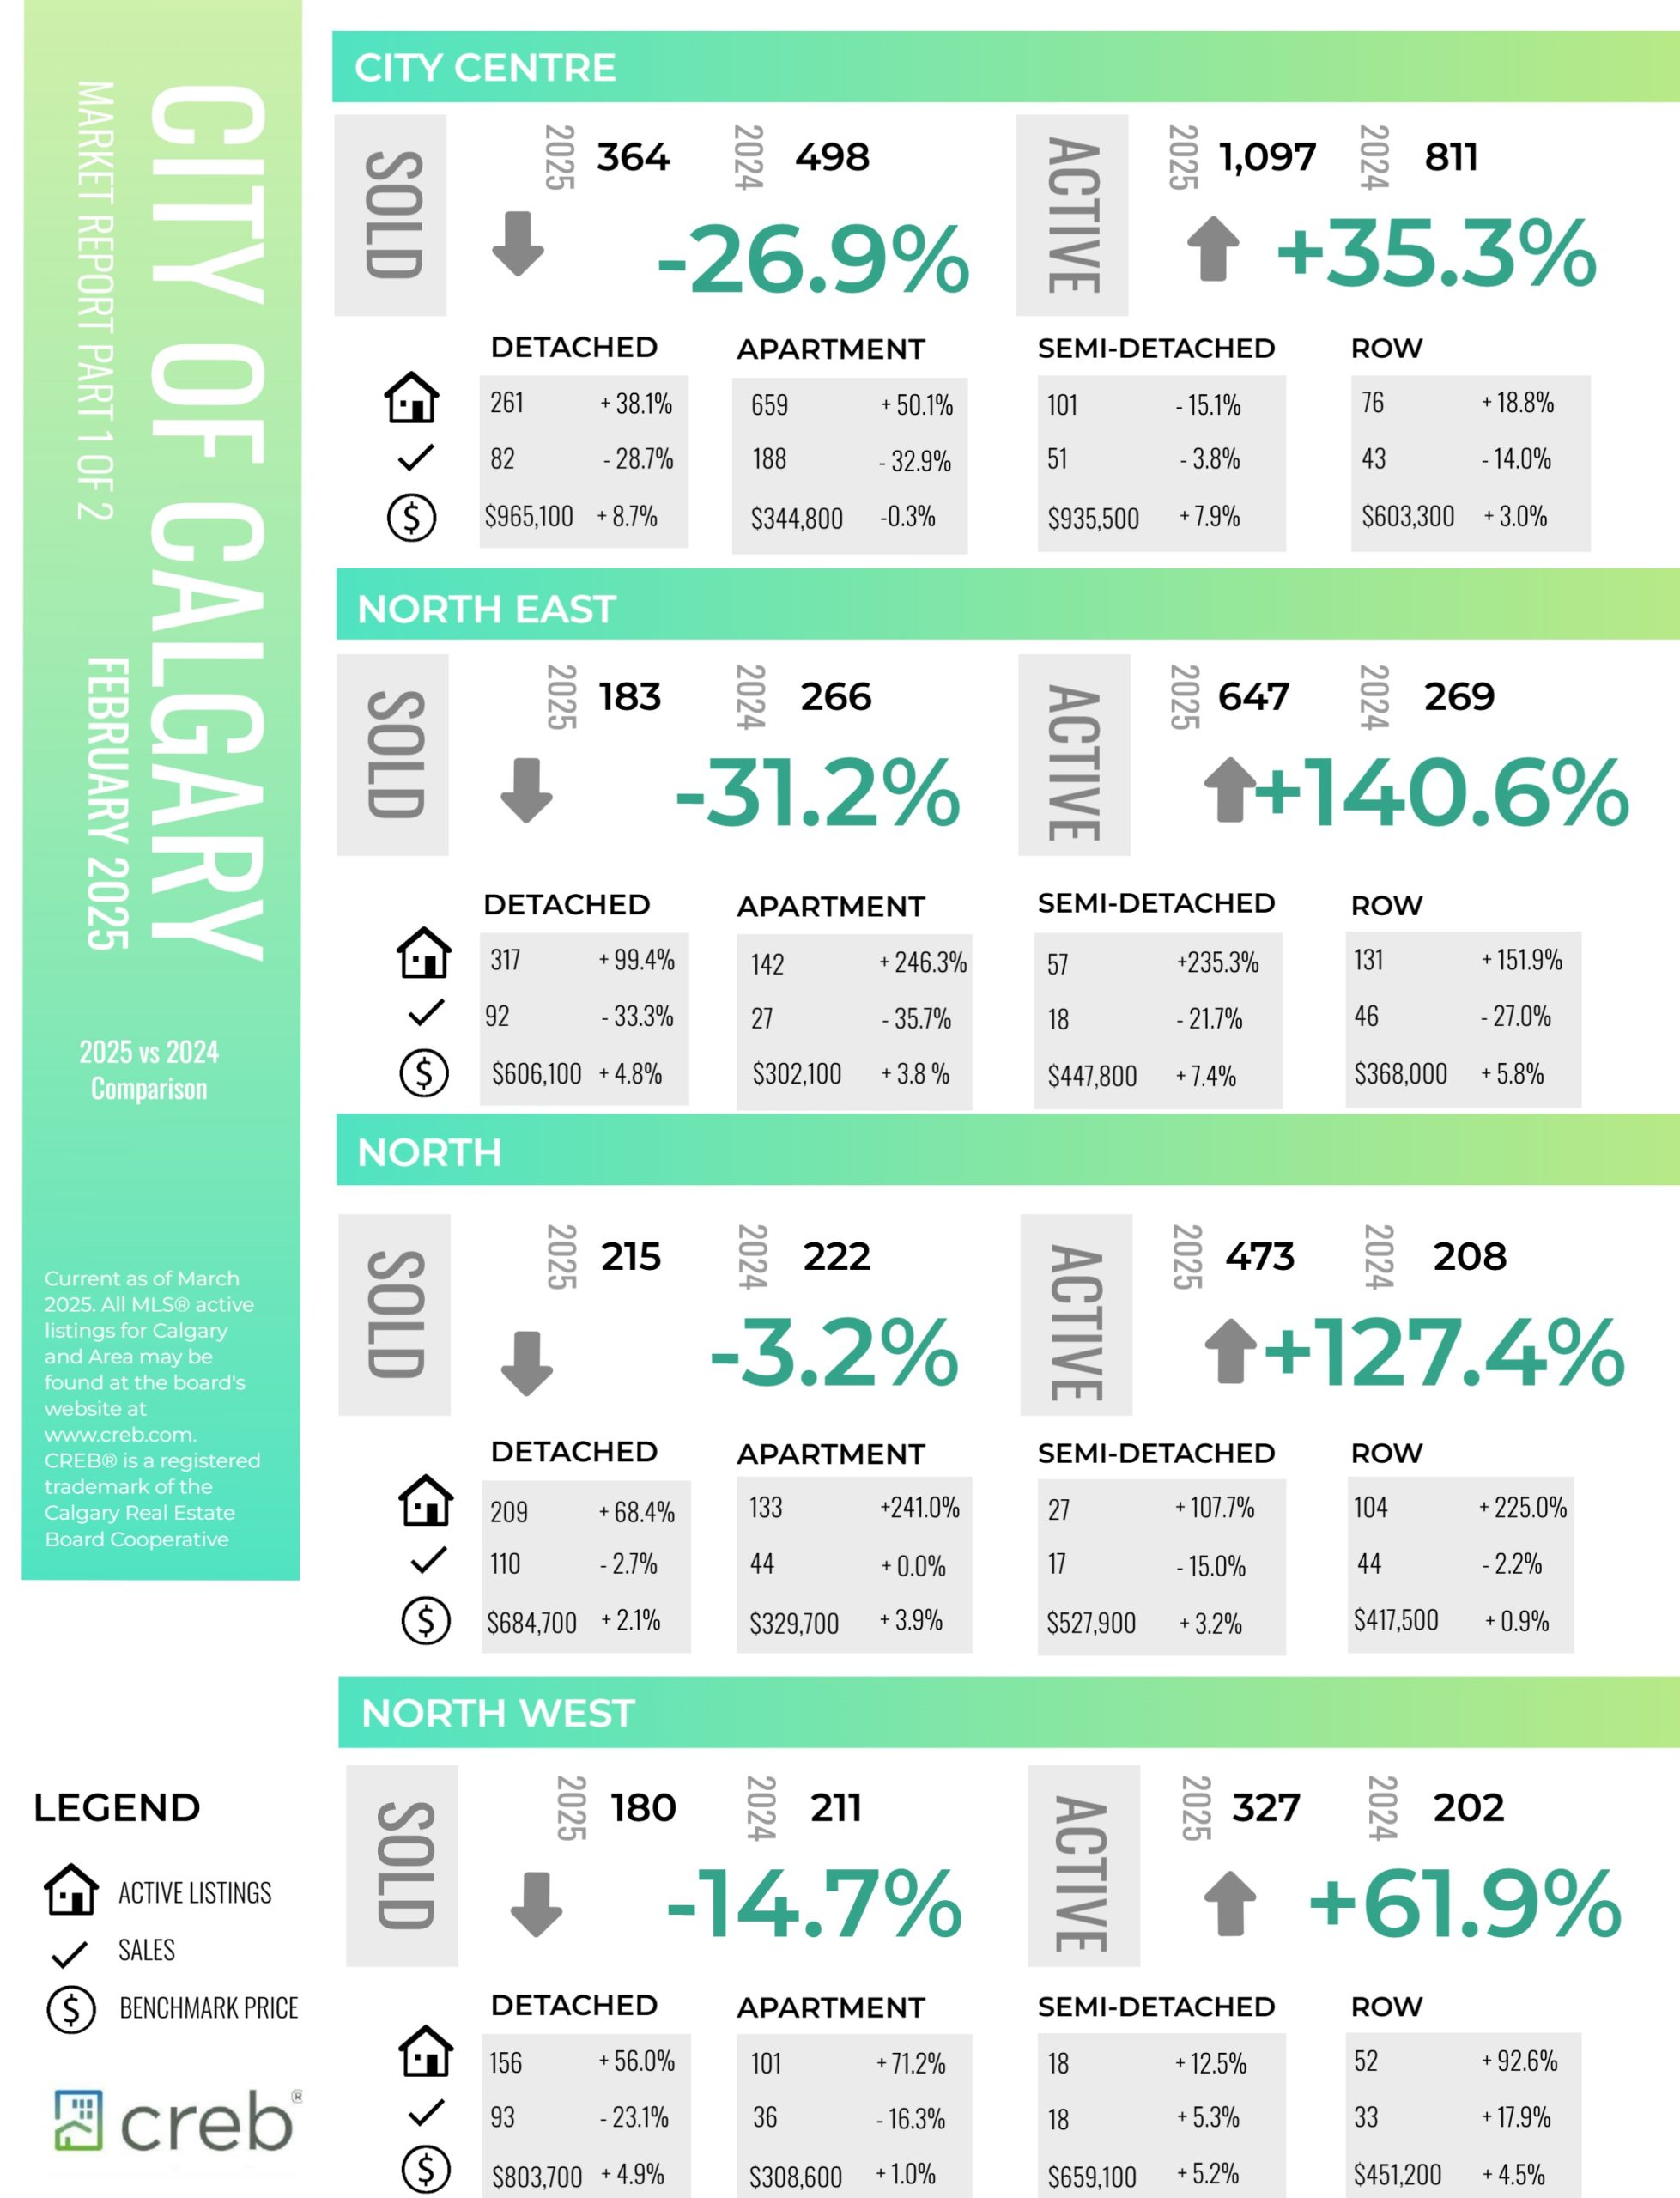
The following data is a comparison between February 2025 and February 2024 numbers, and is current as of March of 2025. For last month’s numbers, check out our previous infographic.
Or follow this link for all our CREB Infographics!
Click on the images for a larger view!
Download Printable Version – February 2025 CREB, City of Calgary Report Pages 1 and 2
Download Printable Version – February 2025 CREB, Calgary Region Report
Last Updated on March 9, 2025 by myRealPage
