INFOGRAPHICS: May 2026 CREB City And Region Market Reports
Apartment prices ease as inventory remains elevated
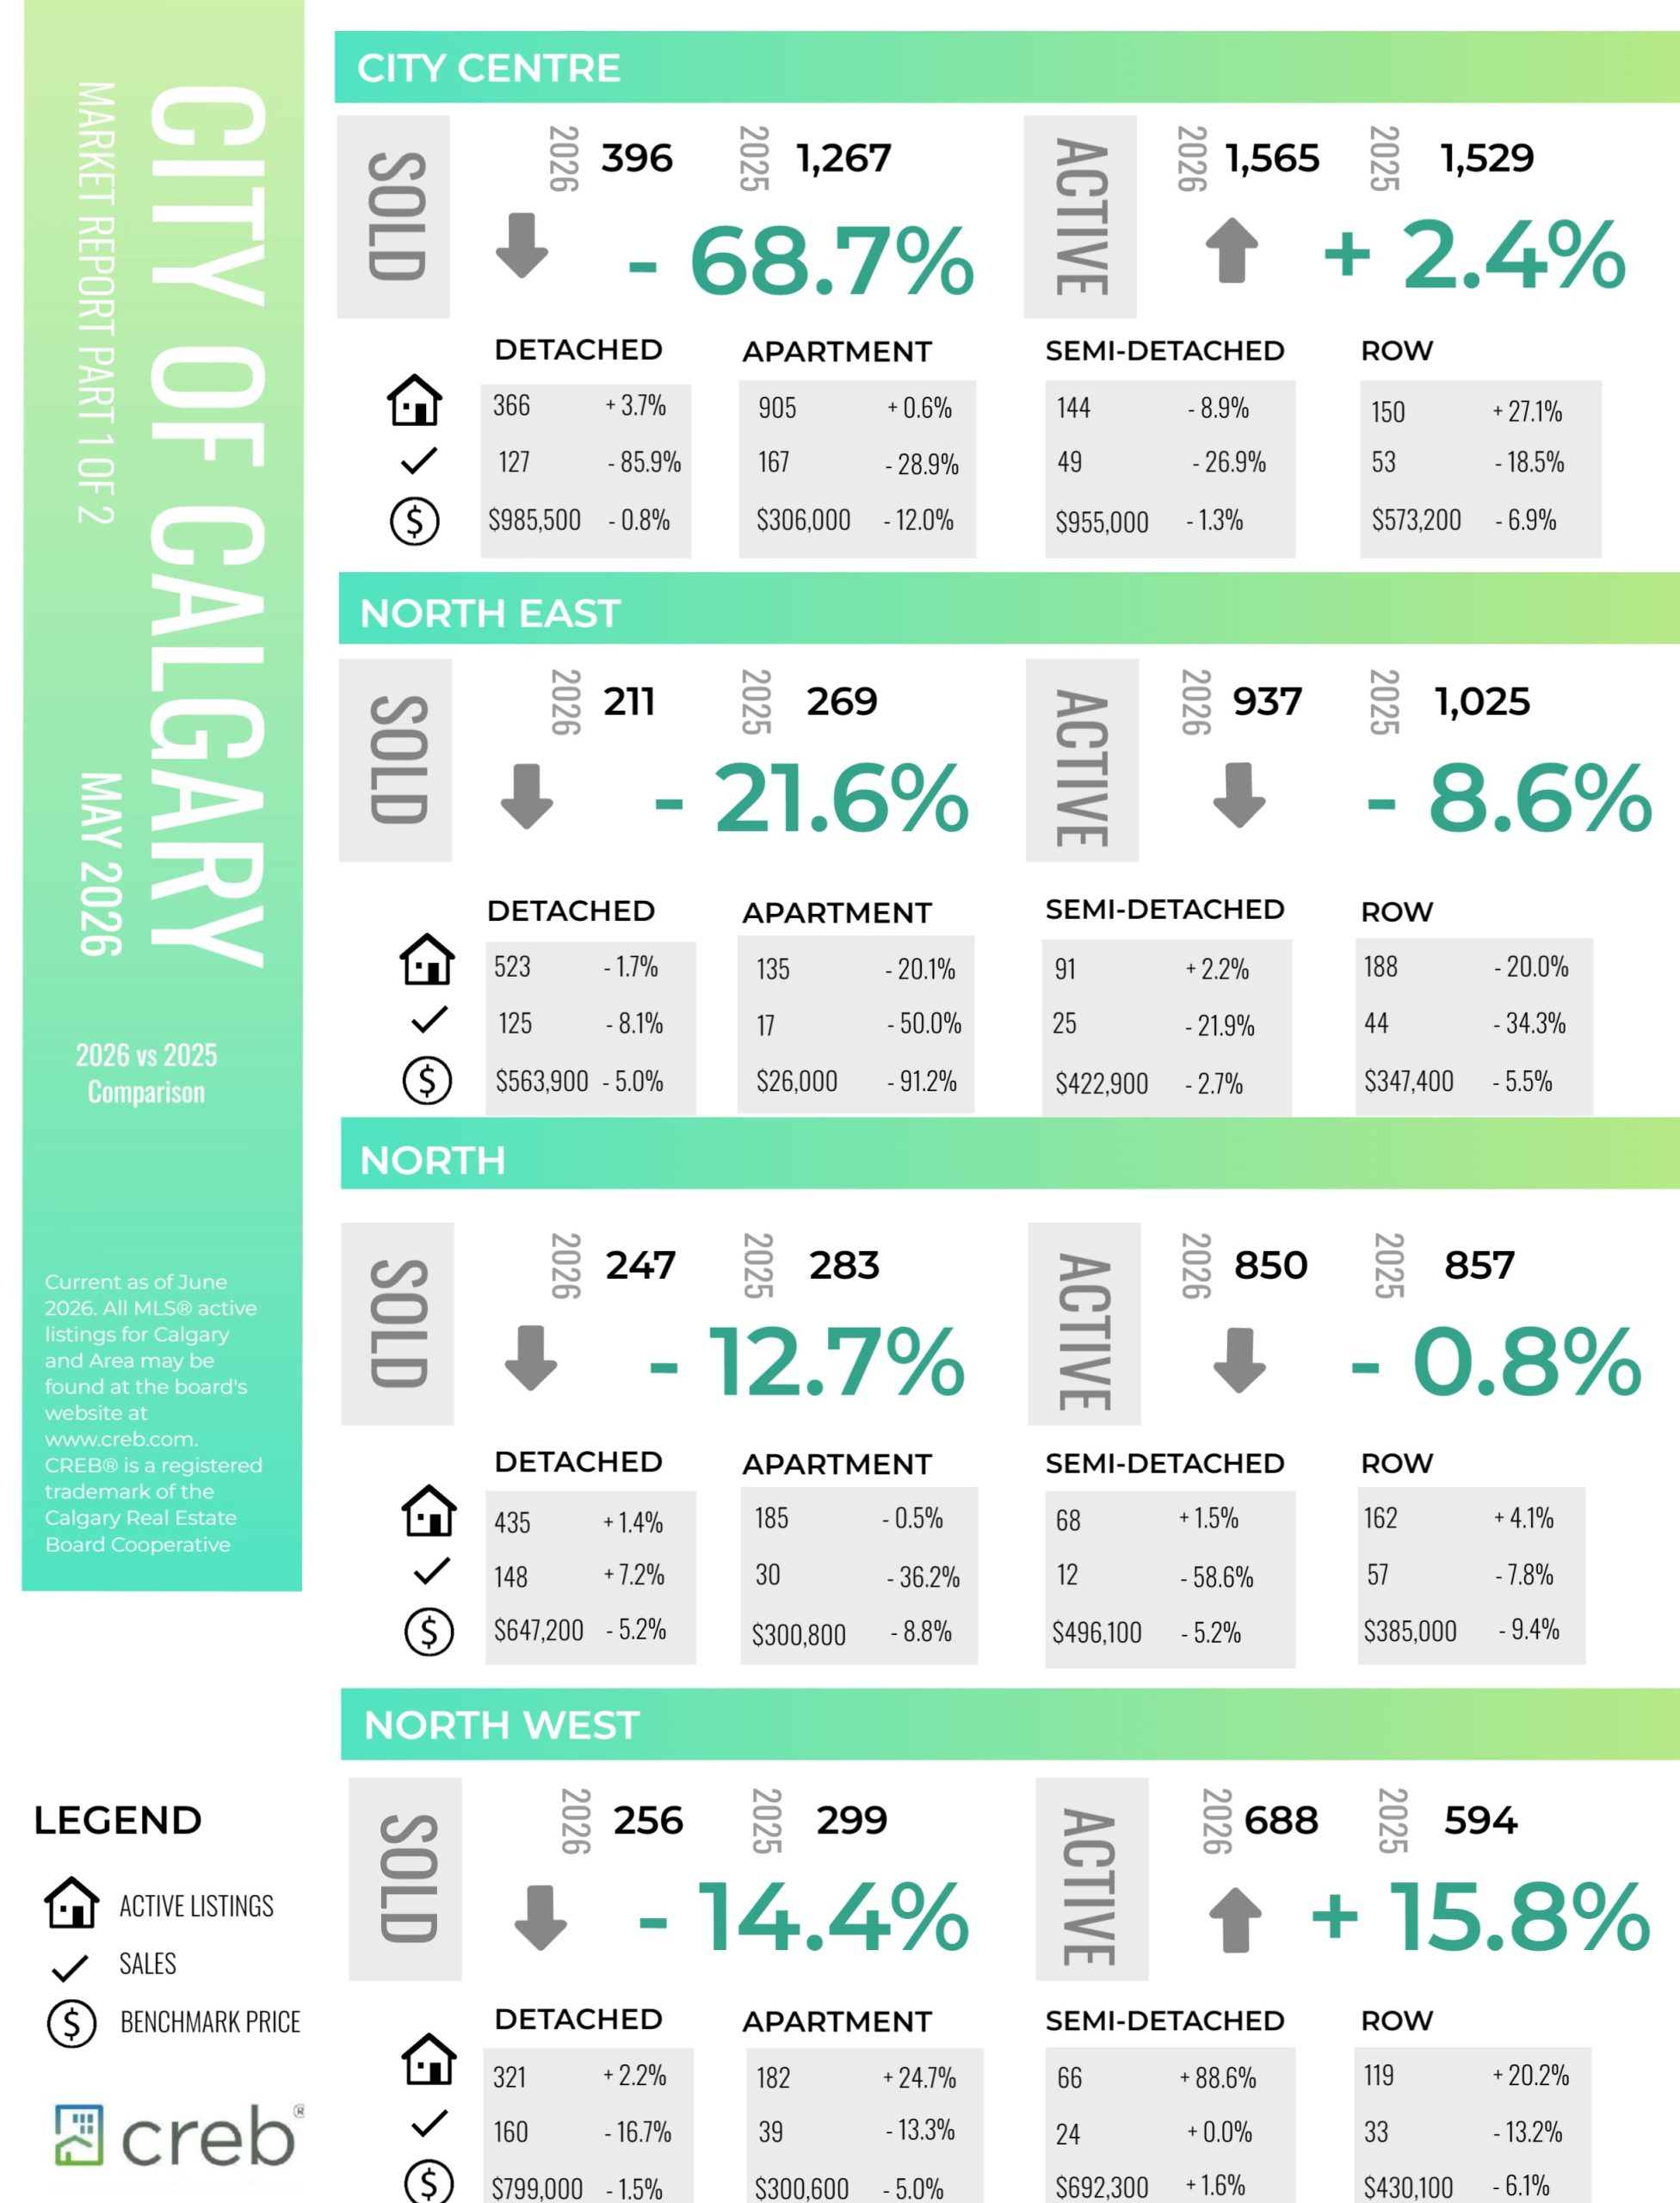
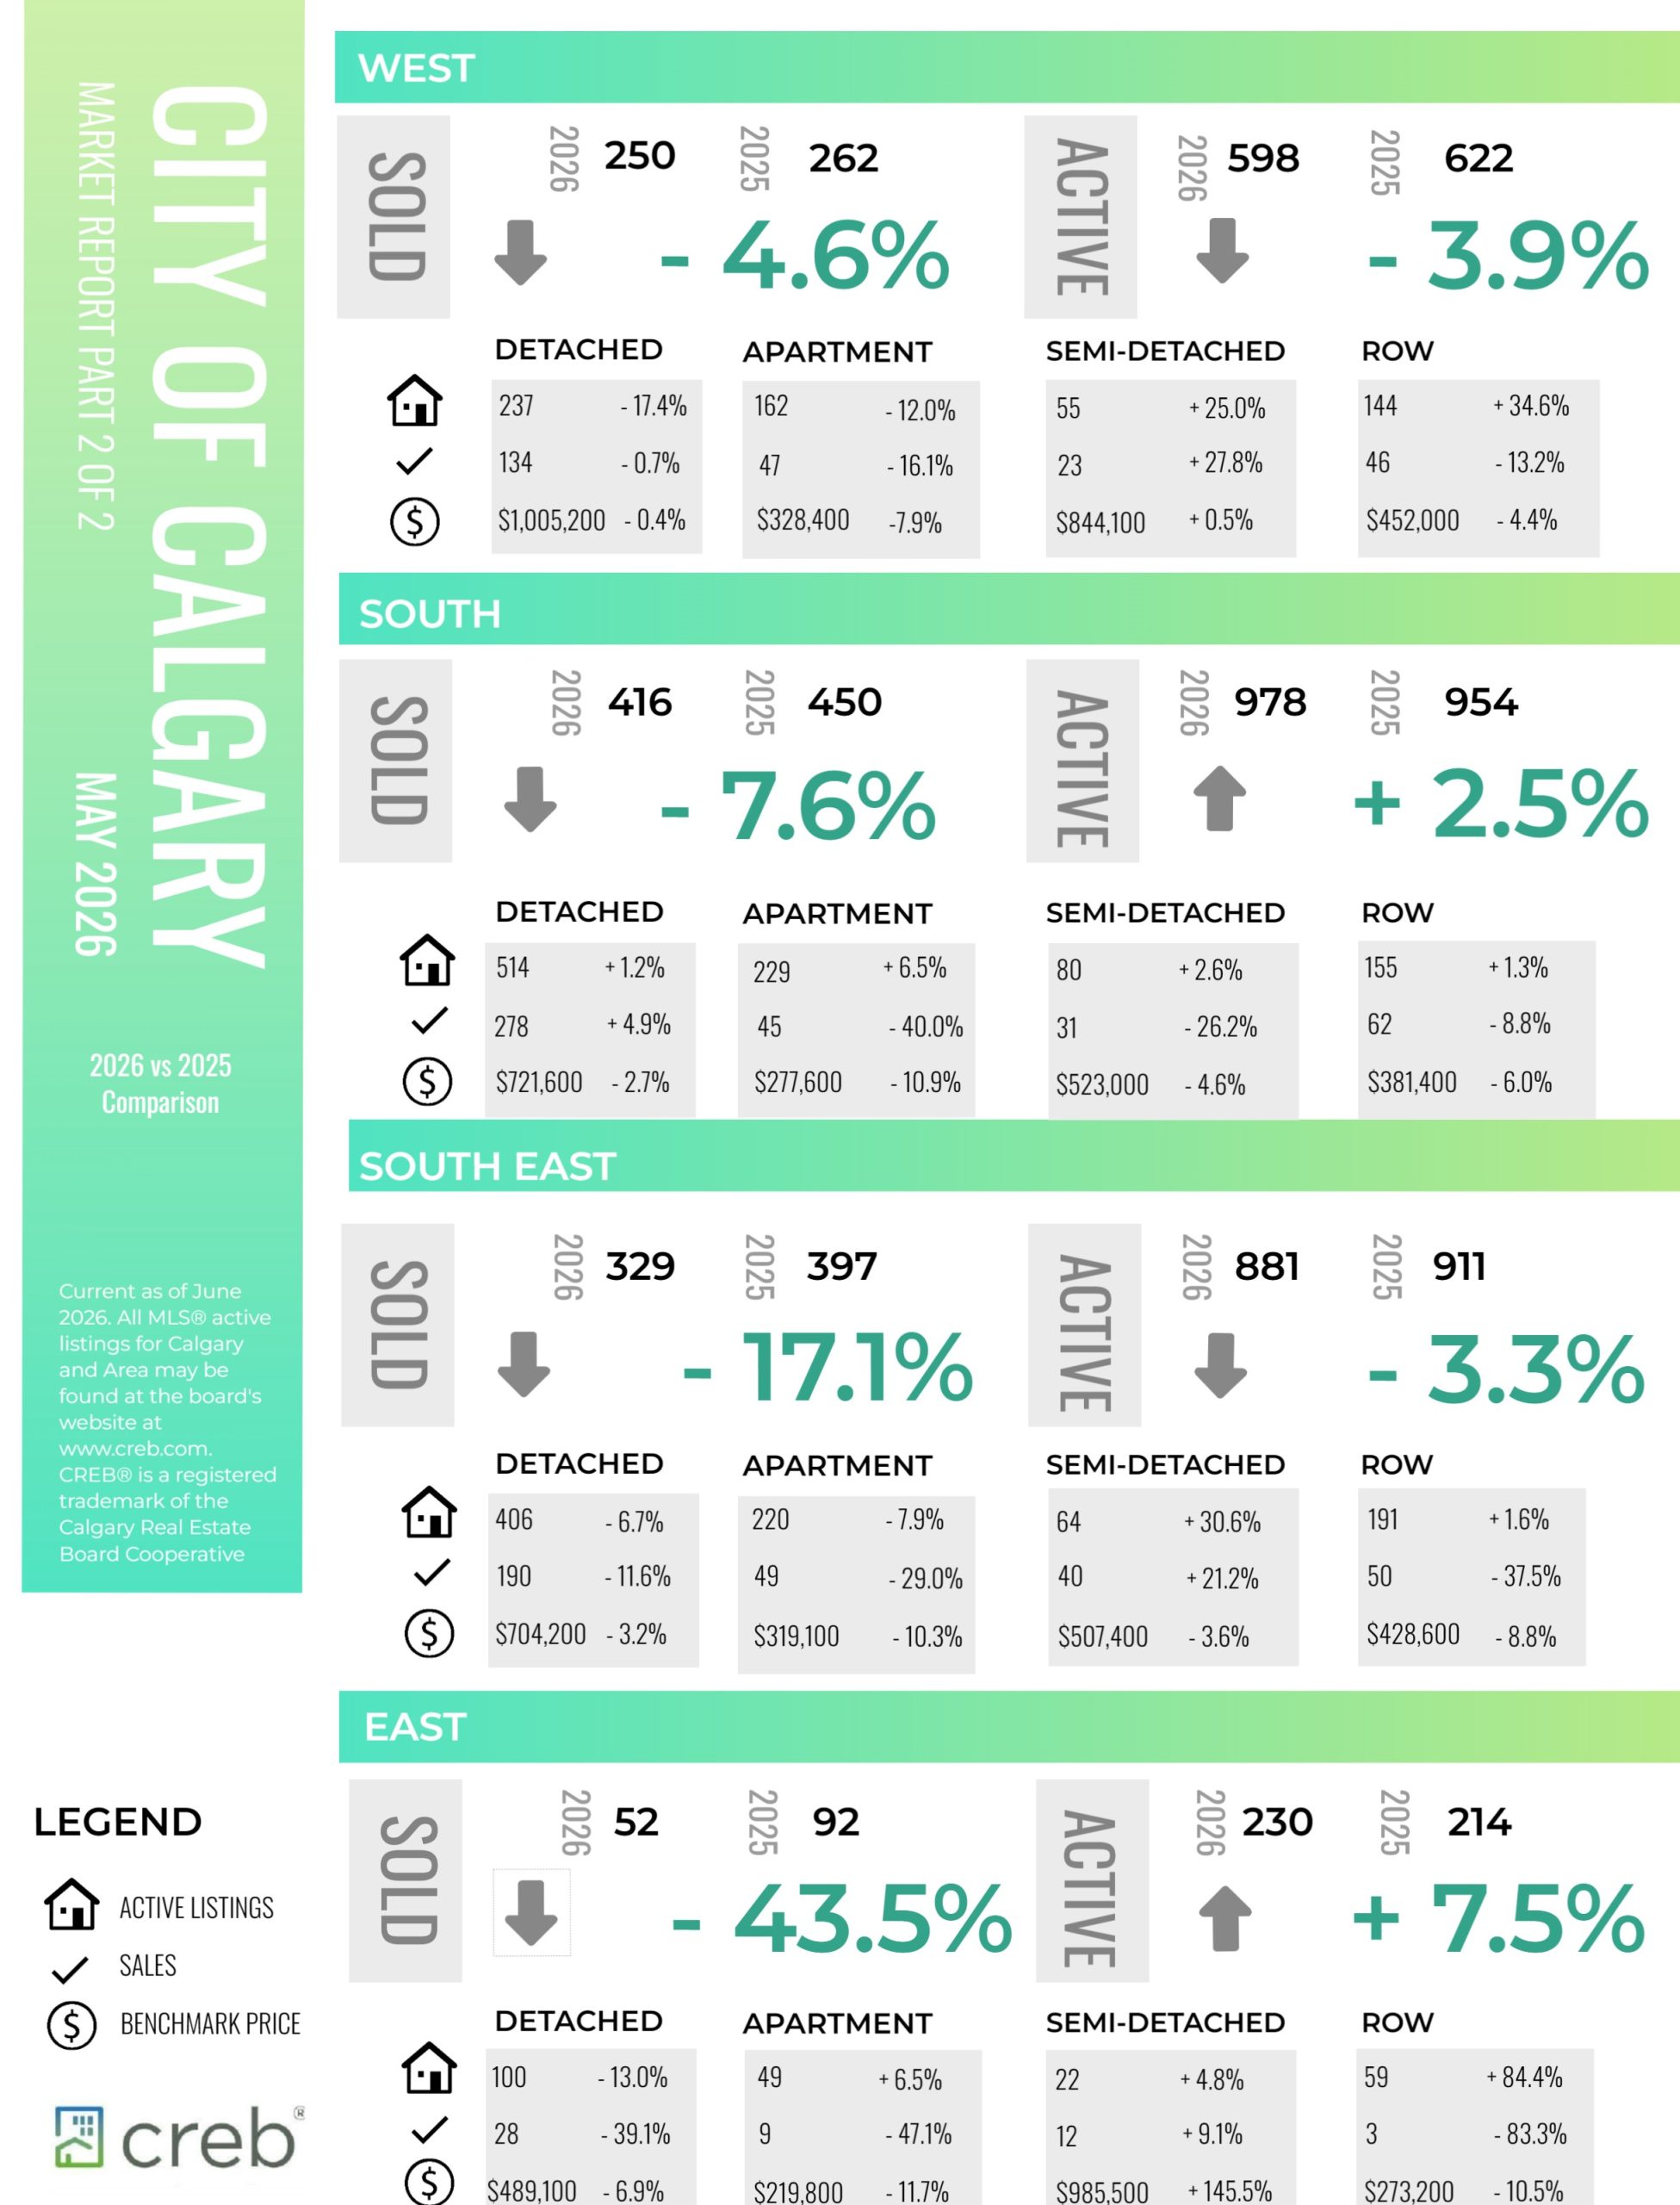
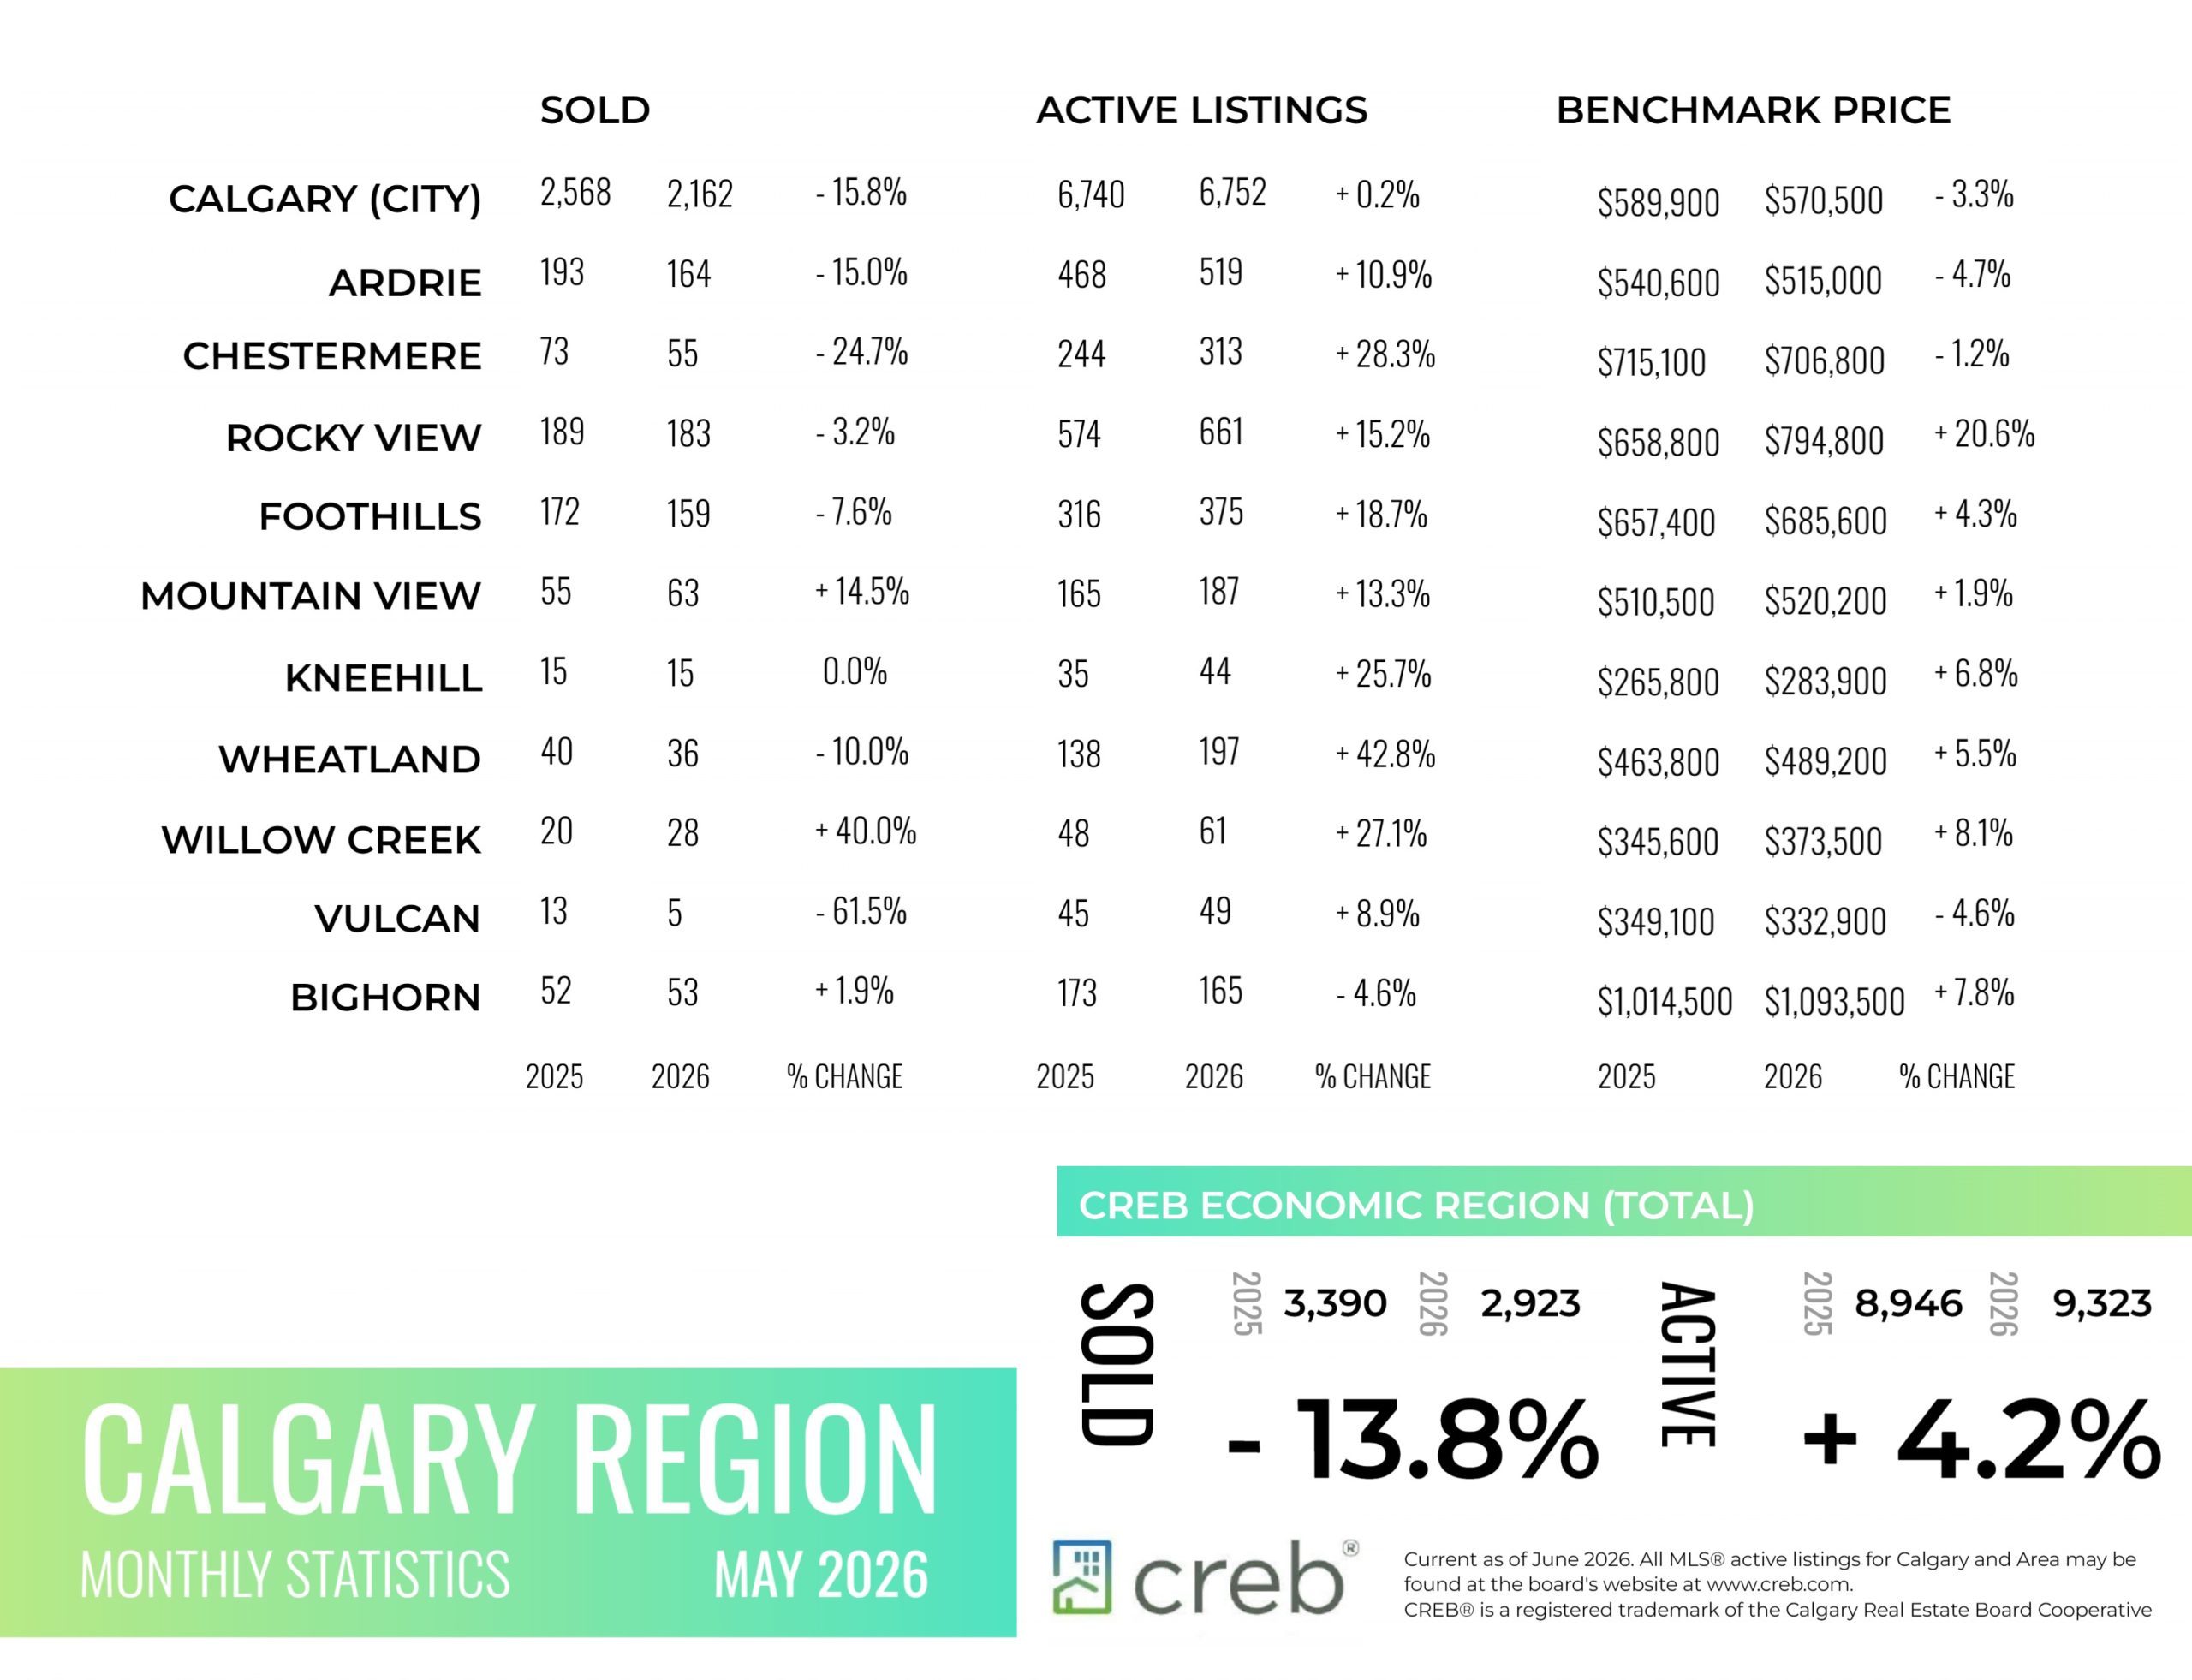
In line with seasonal trends, inventory has risen from the start of the year, reaching 6,752 units in May. While these levels are consistent with last May, they remain 11 per cent higher than longer-term trends for the month, thanks to higher supply levels of apartment and row-style homes. Meanwhile, inventory levels for detached homes are down three per cent compared with both last year and long-term trends.
At the same time, sales activity has been slowing. Calgary sales in May were 2,162 units, 16 per cent lower than last year’s levels and similar to sales reported in April. While new listings also slowed by 13 per cent compared with last year, it was not enough to offset the pullback in sales, causing the salesto-new-listings ratio to ease to 51 per cent. The lower ratio also contributed to some of the inventory build, causing the months of supply to rise. However, conditions do vary across the market, with a range of two-and-a-half months of supply in the detached market to more than five months of supply in the apartment condominium market.
“The shift in supply is being felt in the market. More supply choice in the new and rental markets has created a more competitive environment for potential buyers. At the same time, concerns over rising cost of living and slower migration are also weighing on consumers,” said Ann-Marie Lurie, Chief Economist at the Calgary Real Estate Board (CREB®). “While this has caused the overall resale market to shift to a balanced state, the supply pressure is having a more prevalent impact for apartment-style units, where conditions are favouring the buyer. This is also impacting price movements, with apartment prices continuing to trend down and other property types reporting a seasonal lift over the winter months.”
Read the full report on the CREB website!
The following data is a comparison between May 2026 and May 2025 numbers, and is current as of June 0f 2026. For last month’s numbers, check out our previous infographic.
Or follow this link for all our CREB Infographics!
Click on the images for a larger view!
Download Printable Version – May 2026 CREB, City of Calgary Report Pages 1 and 2
Download Printable Version – May 2026 CREB, Calgary Region Report
Last Updated on June 5, 2026 by myRealPage
