

INFOGRAPHICS: July 2026 CREB City And Region Market Reports

Price declines driven mostly by apartment condominiums
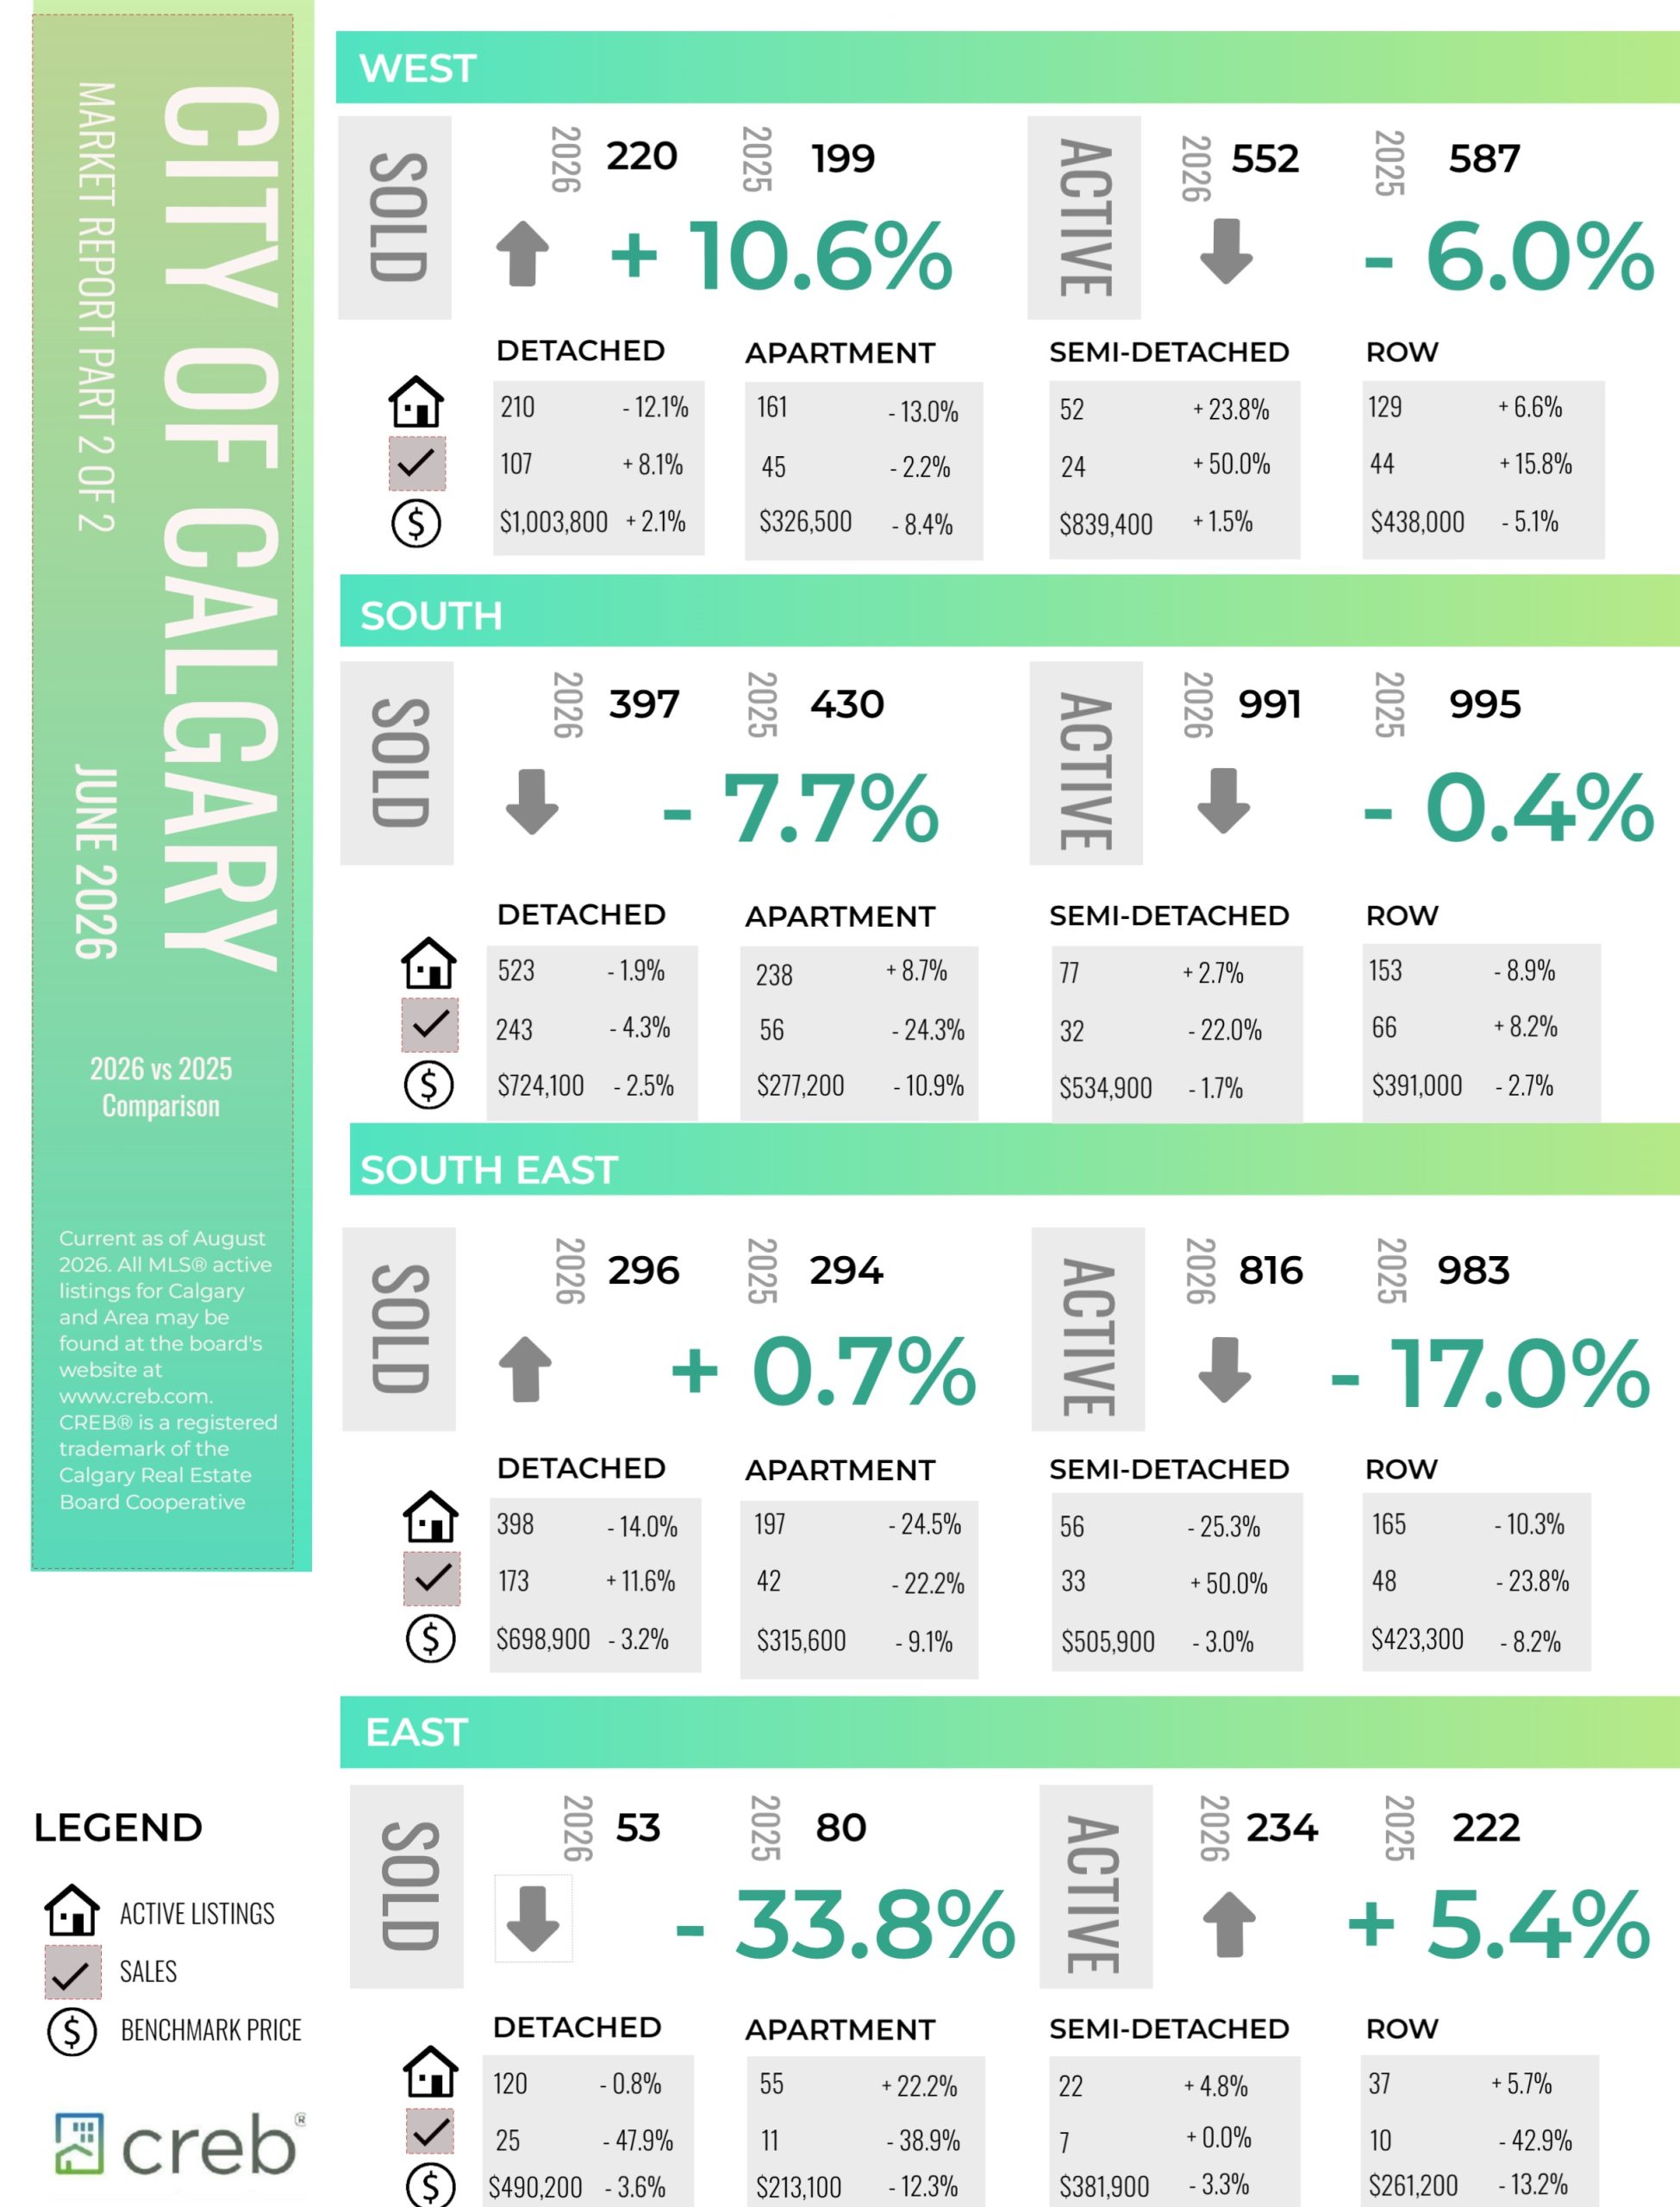
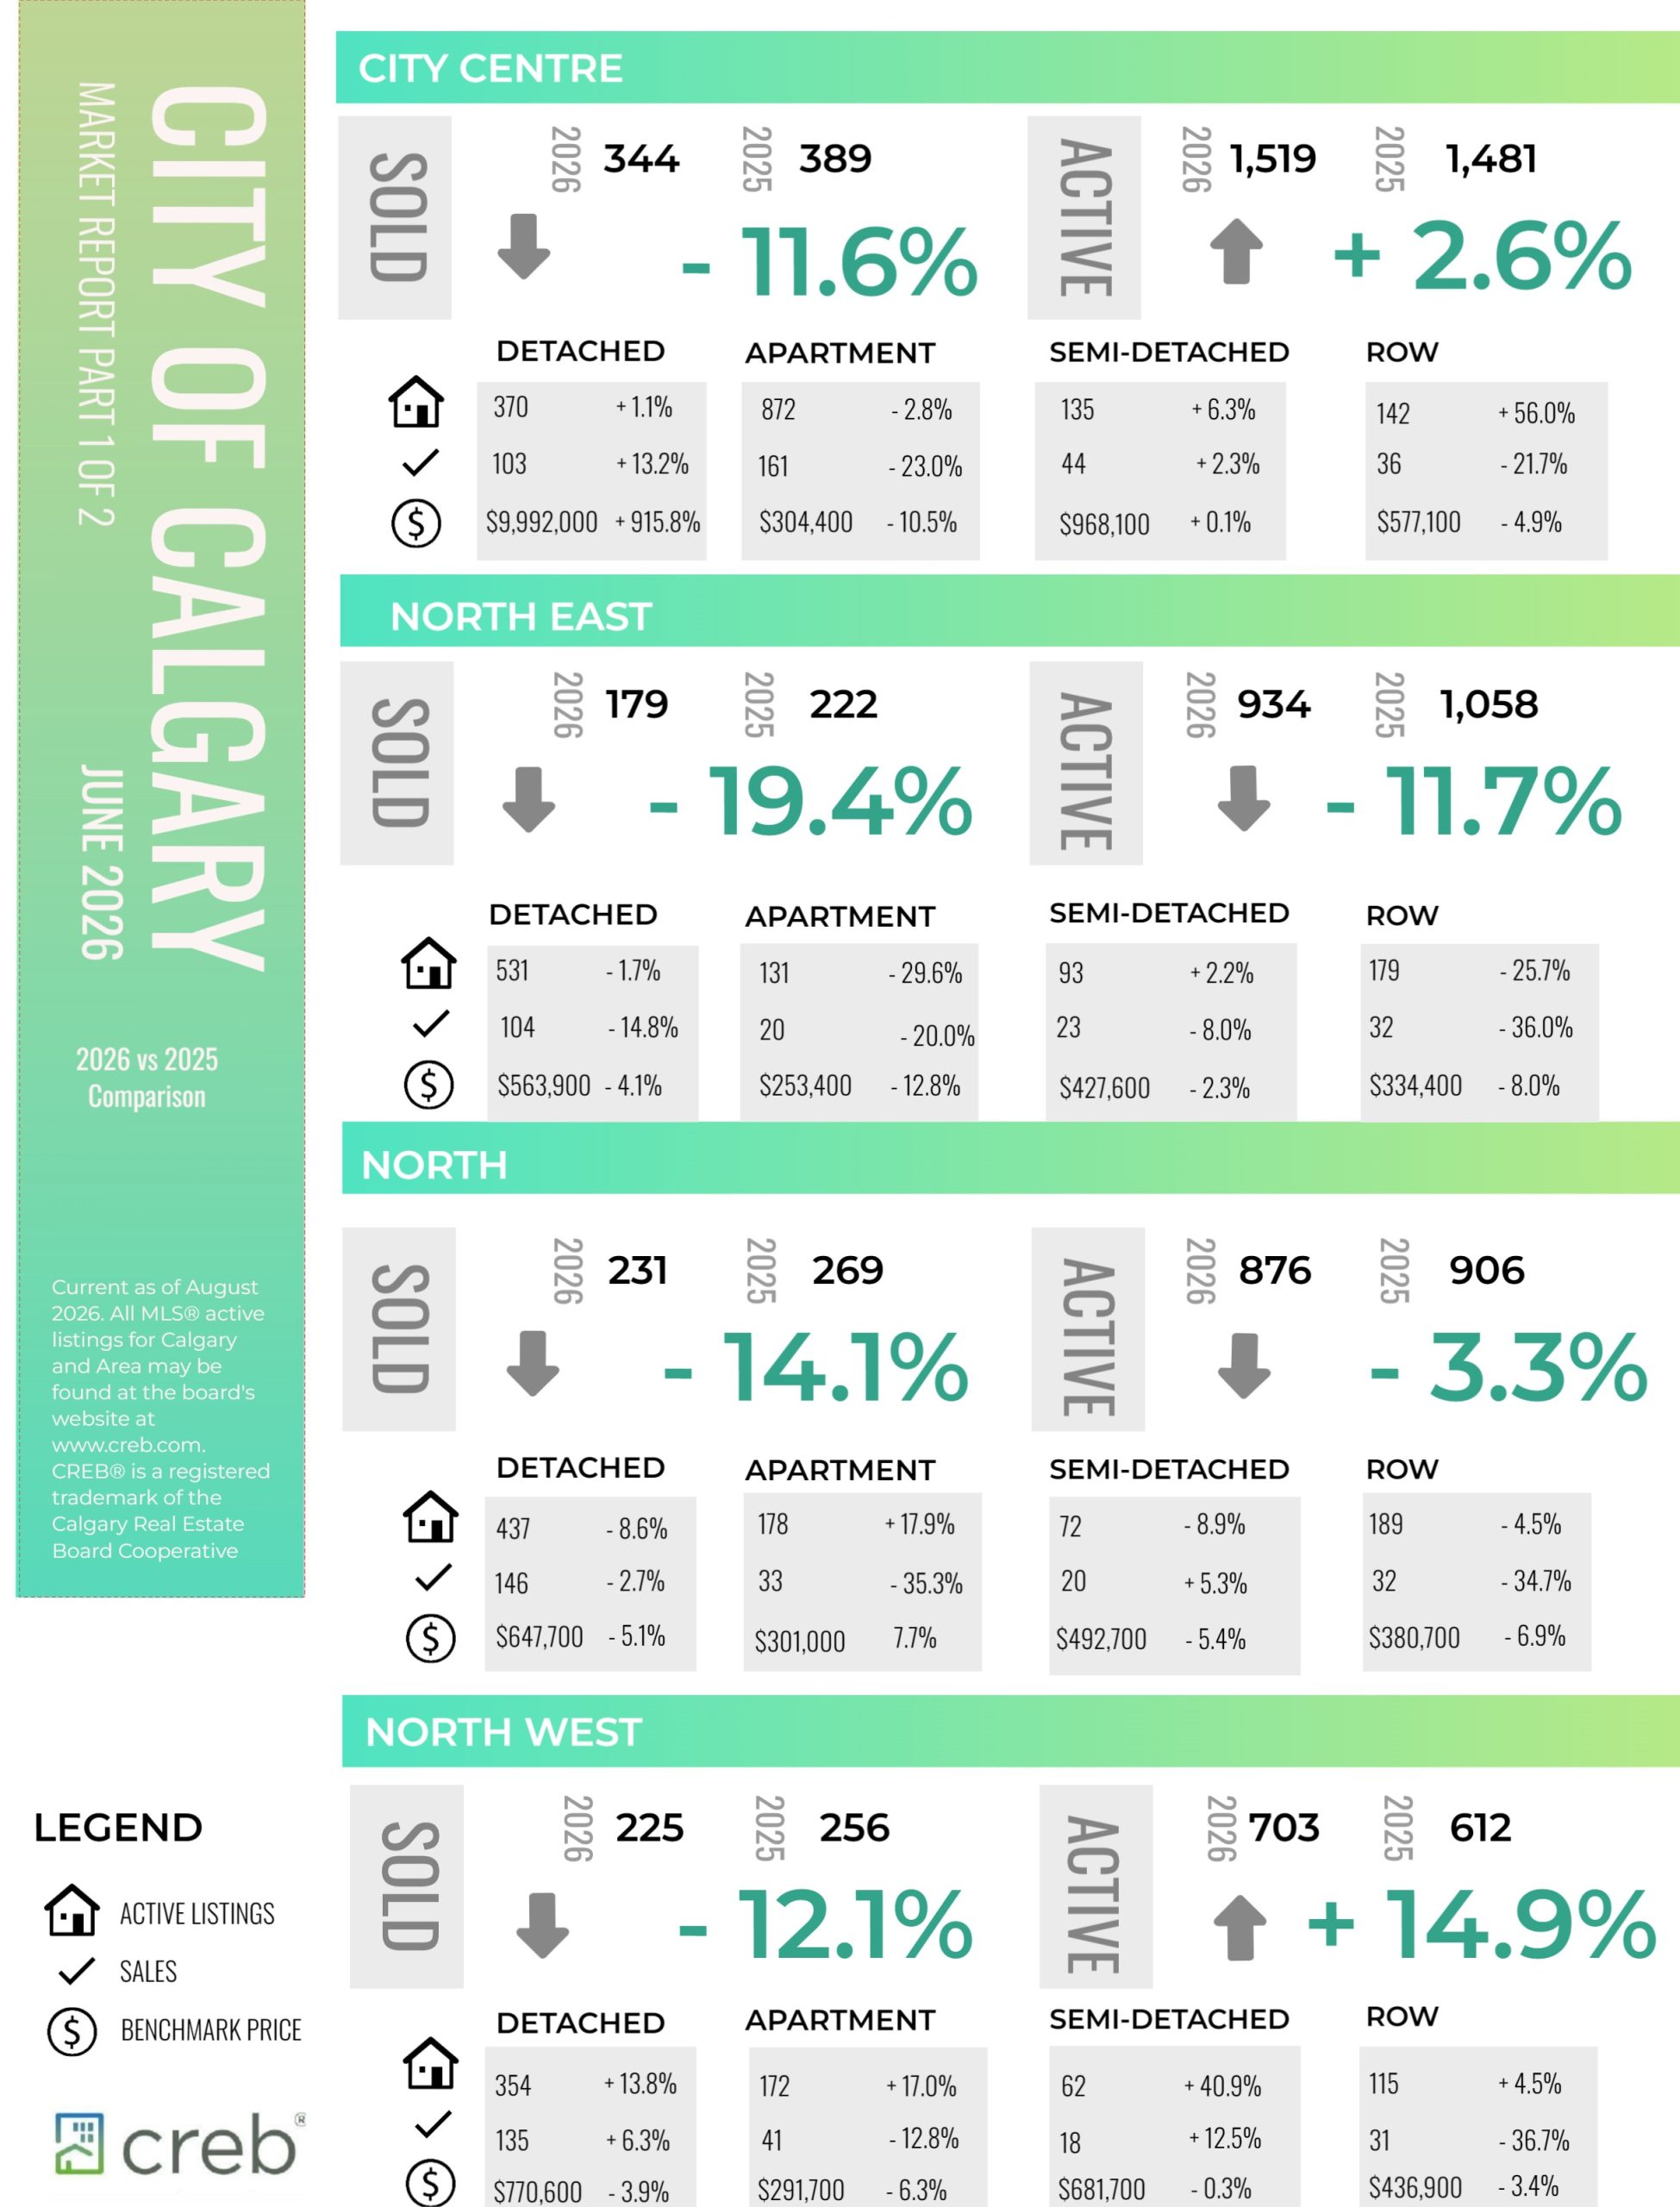
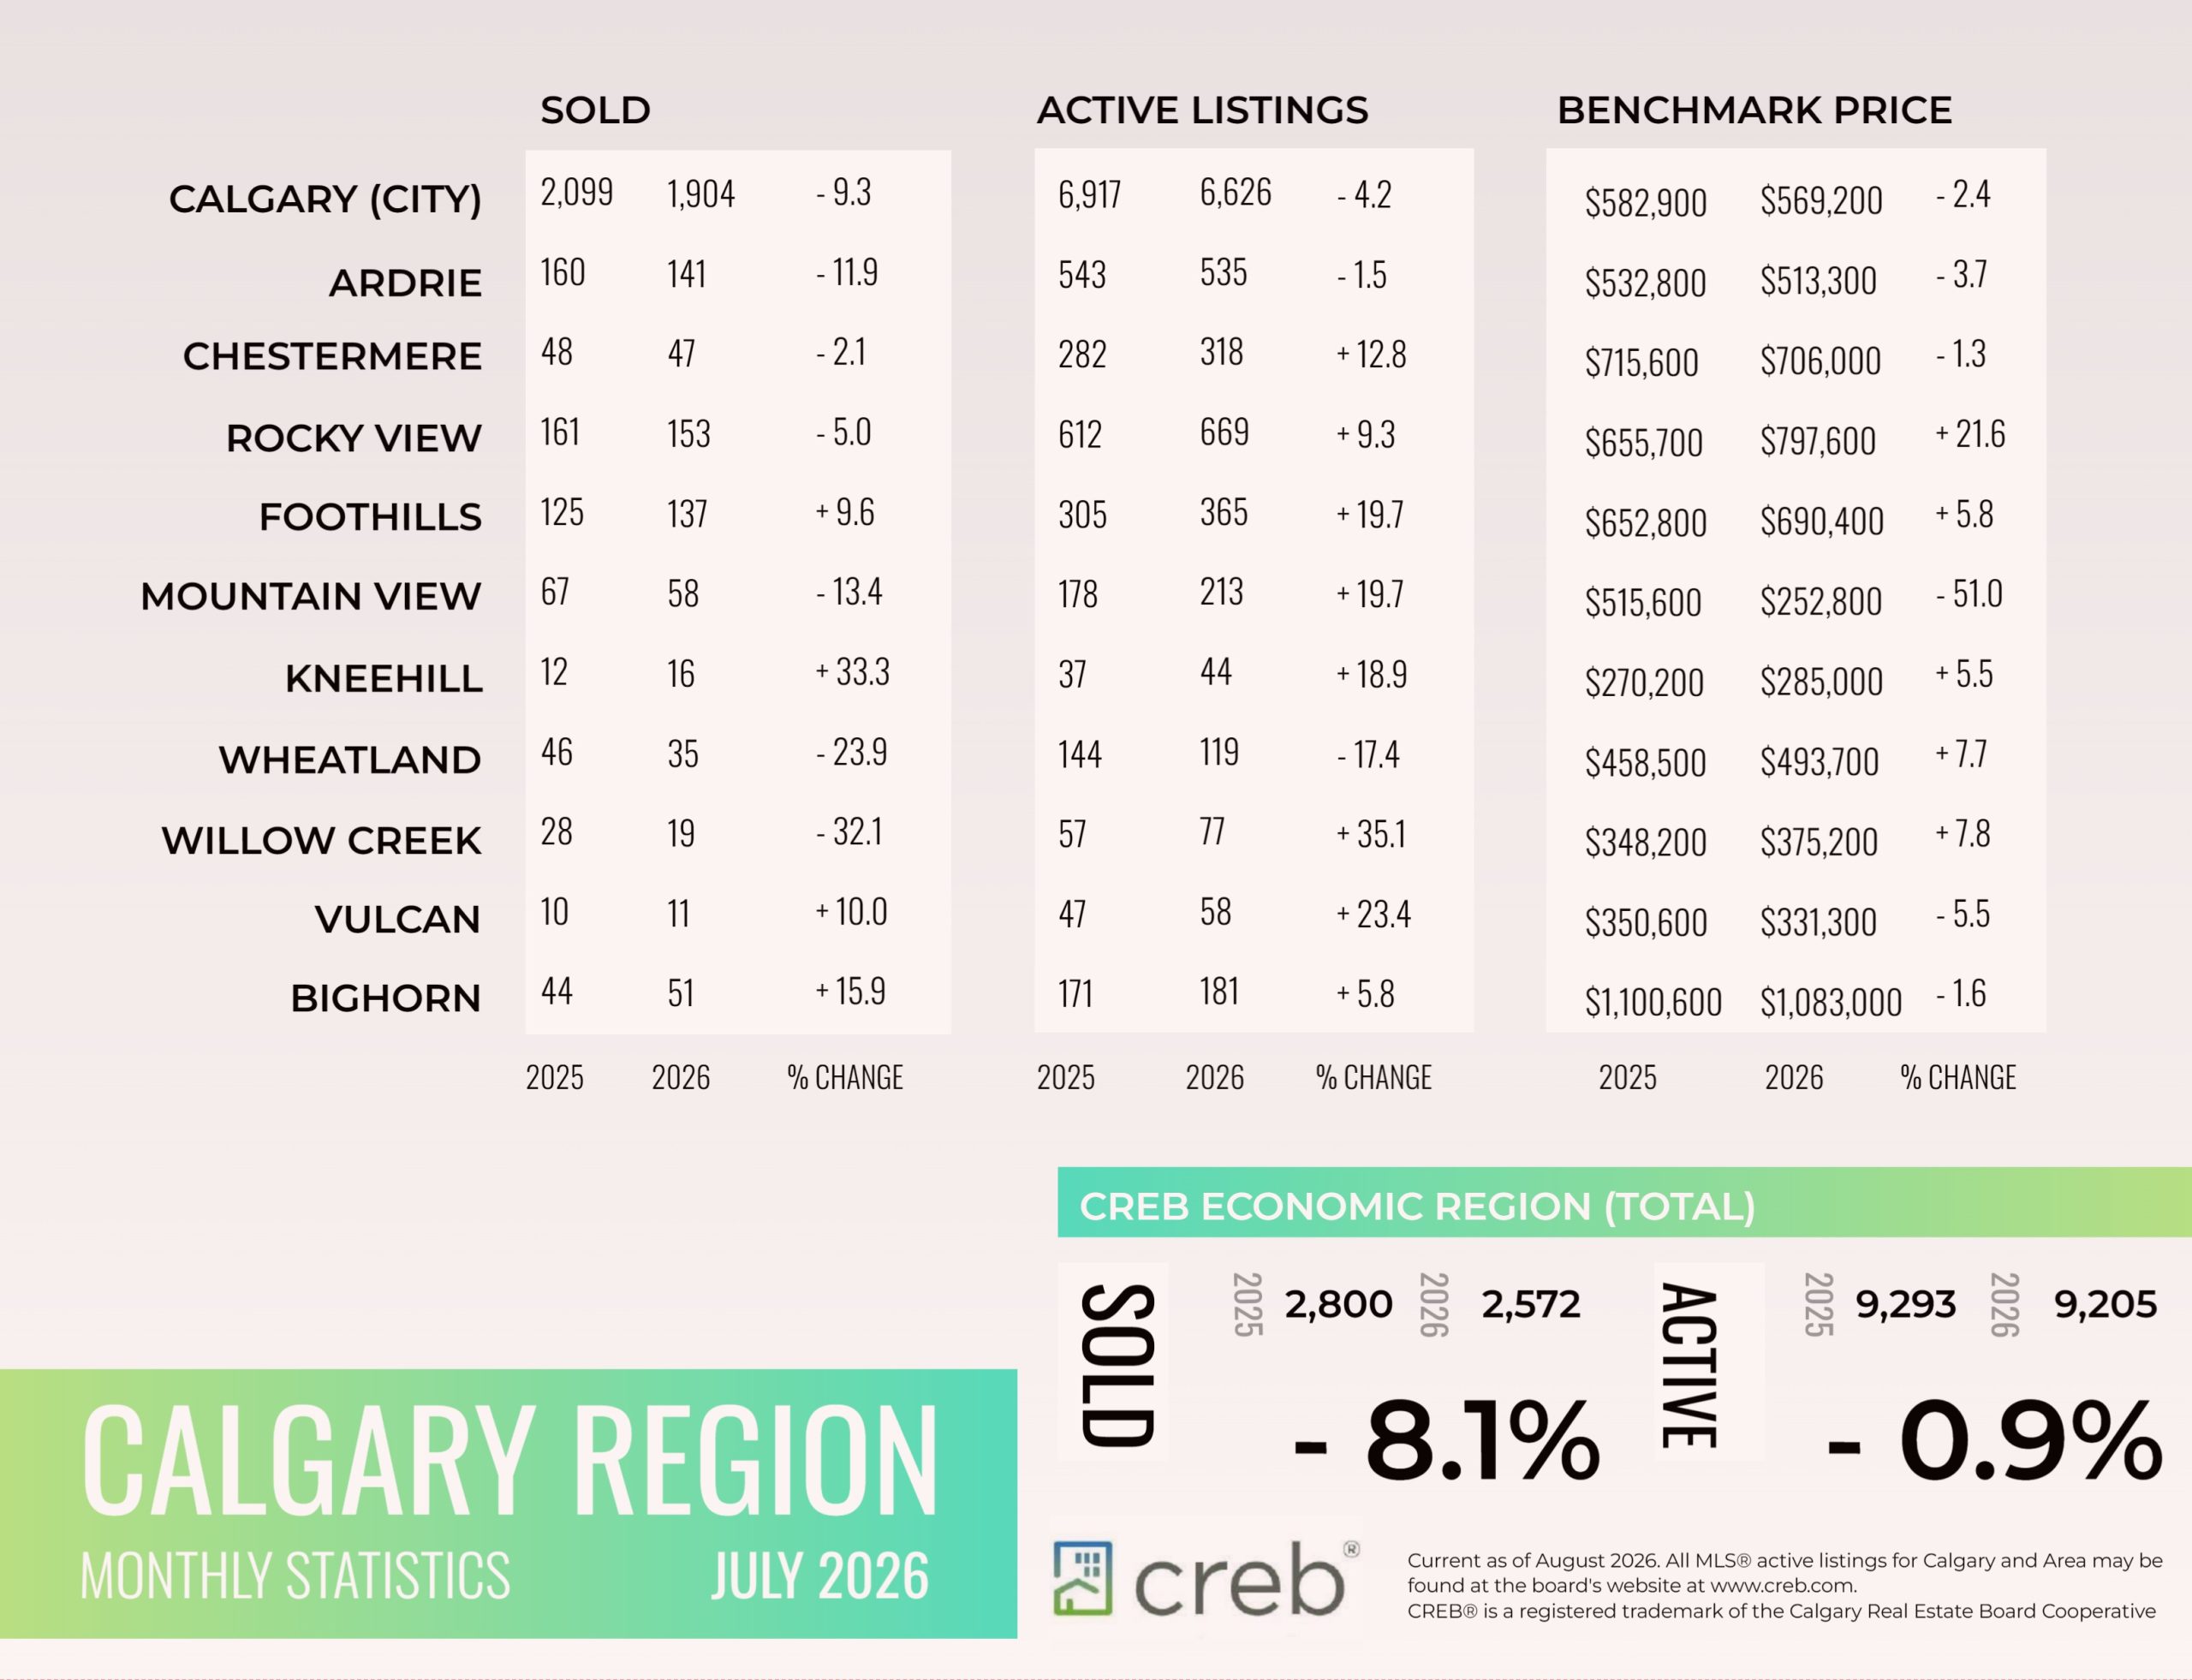
As we move into the second half of the year, it is not a surprise to see slower market activity. In July, both sales and new listings eased over June levels, declining to 1,904 sales and 3,323 new listings. Sales were nine per cent lower than last year’s levels, while new listings were 15 per cent lower. The adjustment in both sales and new listings caused little change in the sales-to-new-listings ratio, which sat at 57 per cent.
In July, the unadjusted total residential benchmark price was $569,200, down slightly over June and two per cent lower than levels reported last year. The persistent oversupply of apartment condos is contributing to a steeper price decline of over eight per cent. Meanwhile, at the other end of the spectrum, detached prices have eased by under two per cent compared to last year, mostly driven by adjustments in the North East and North Districts.
“Several consecutive years of high construction levels and the sudden drop in mostly international migration have contributed to the shift in housing market conditions mostly for higher-density homes, a transition that started in the second half of last year,” said Ann-Marie Lurie, Chief Economist at the Calgary Real Estate Board (CREB®). “While new home construction is slowing, there are over 17,000 apartment-style units under construction. This continues to weigh on rental and higher-density properties, driving price adjustments.”
Read the full report on the CREB website!
The following data is a comparison between July 2026 and July 2025 numbers, and is current as of August 0f 2026. For last month’s numbers, check out our previous infographic.
Or follow this link for all our CREB Infographics!
Click on the images for a larger view!
Download Printable Version – June 2026 CREB, City of Calgary Report Pages 1 and 2
Download Printable Version – July 2026 CREB, Calgary Region Report
Last Updated on August 10, 2026 by myRealPage
