

INFOGRAPHICS: September 2026 TRREB Toronto Market Reports

GTA REALTORS Release September Stats
Homebuyers were in a holding pattern in September, as uncertainty surrounding the economy, inflation and borrowing costs weighed on Greater Toronto Area (GTA) home sales.
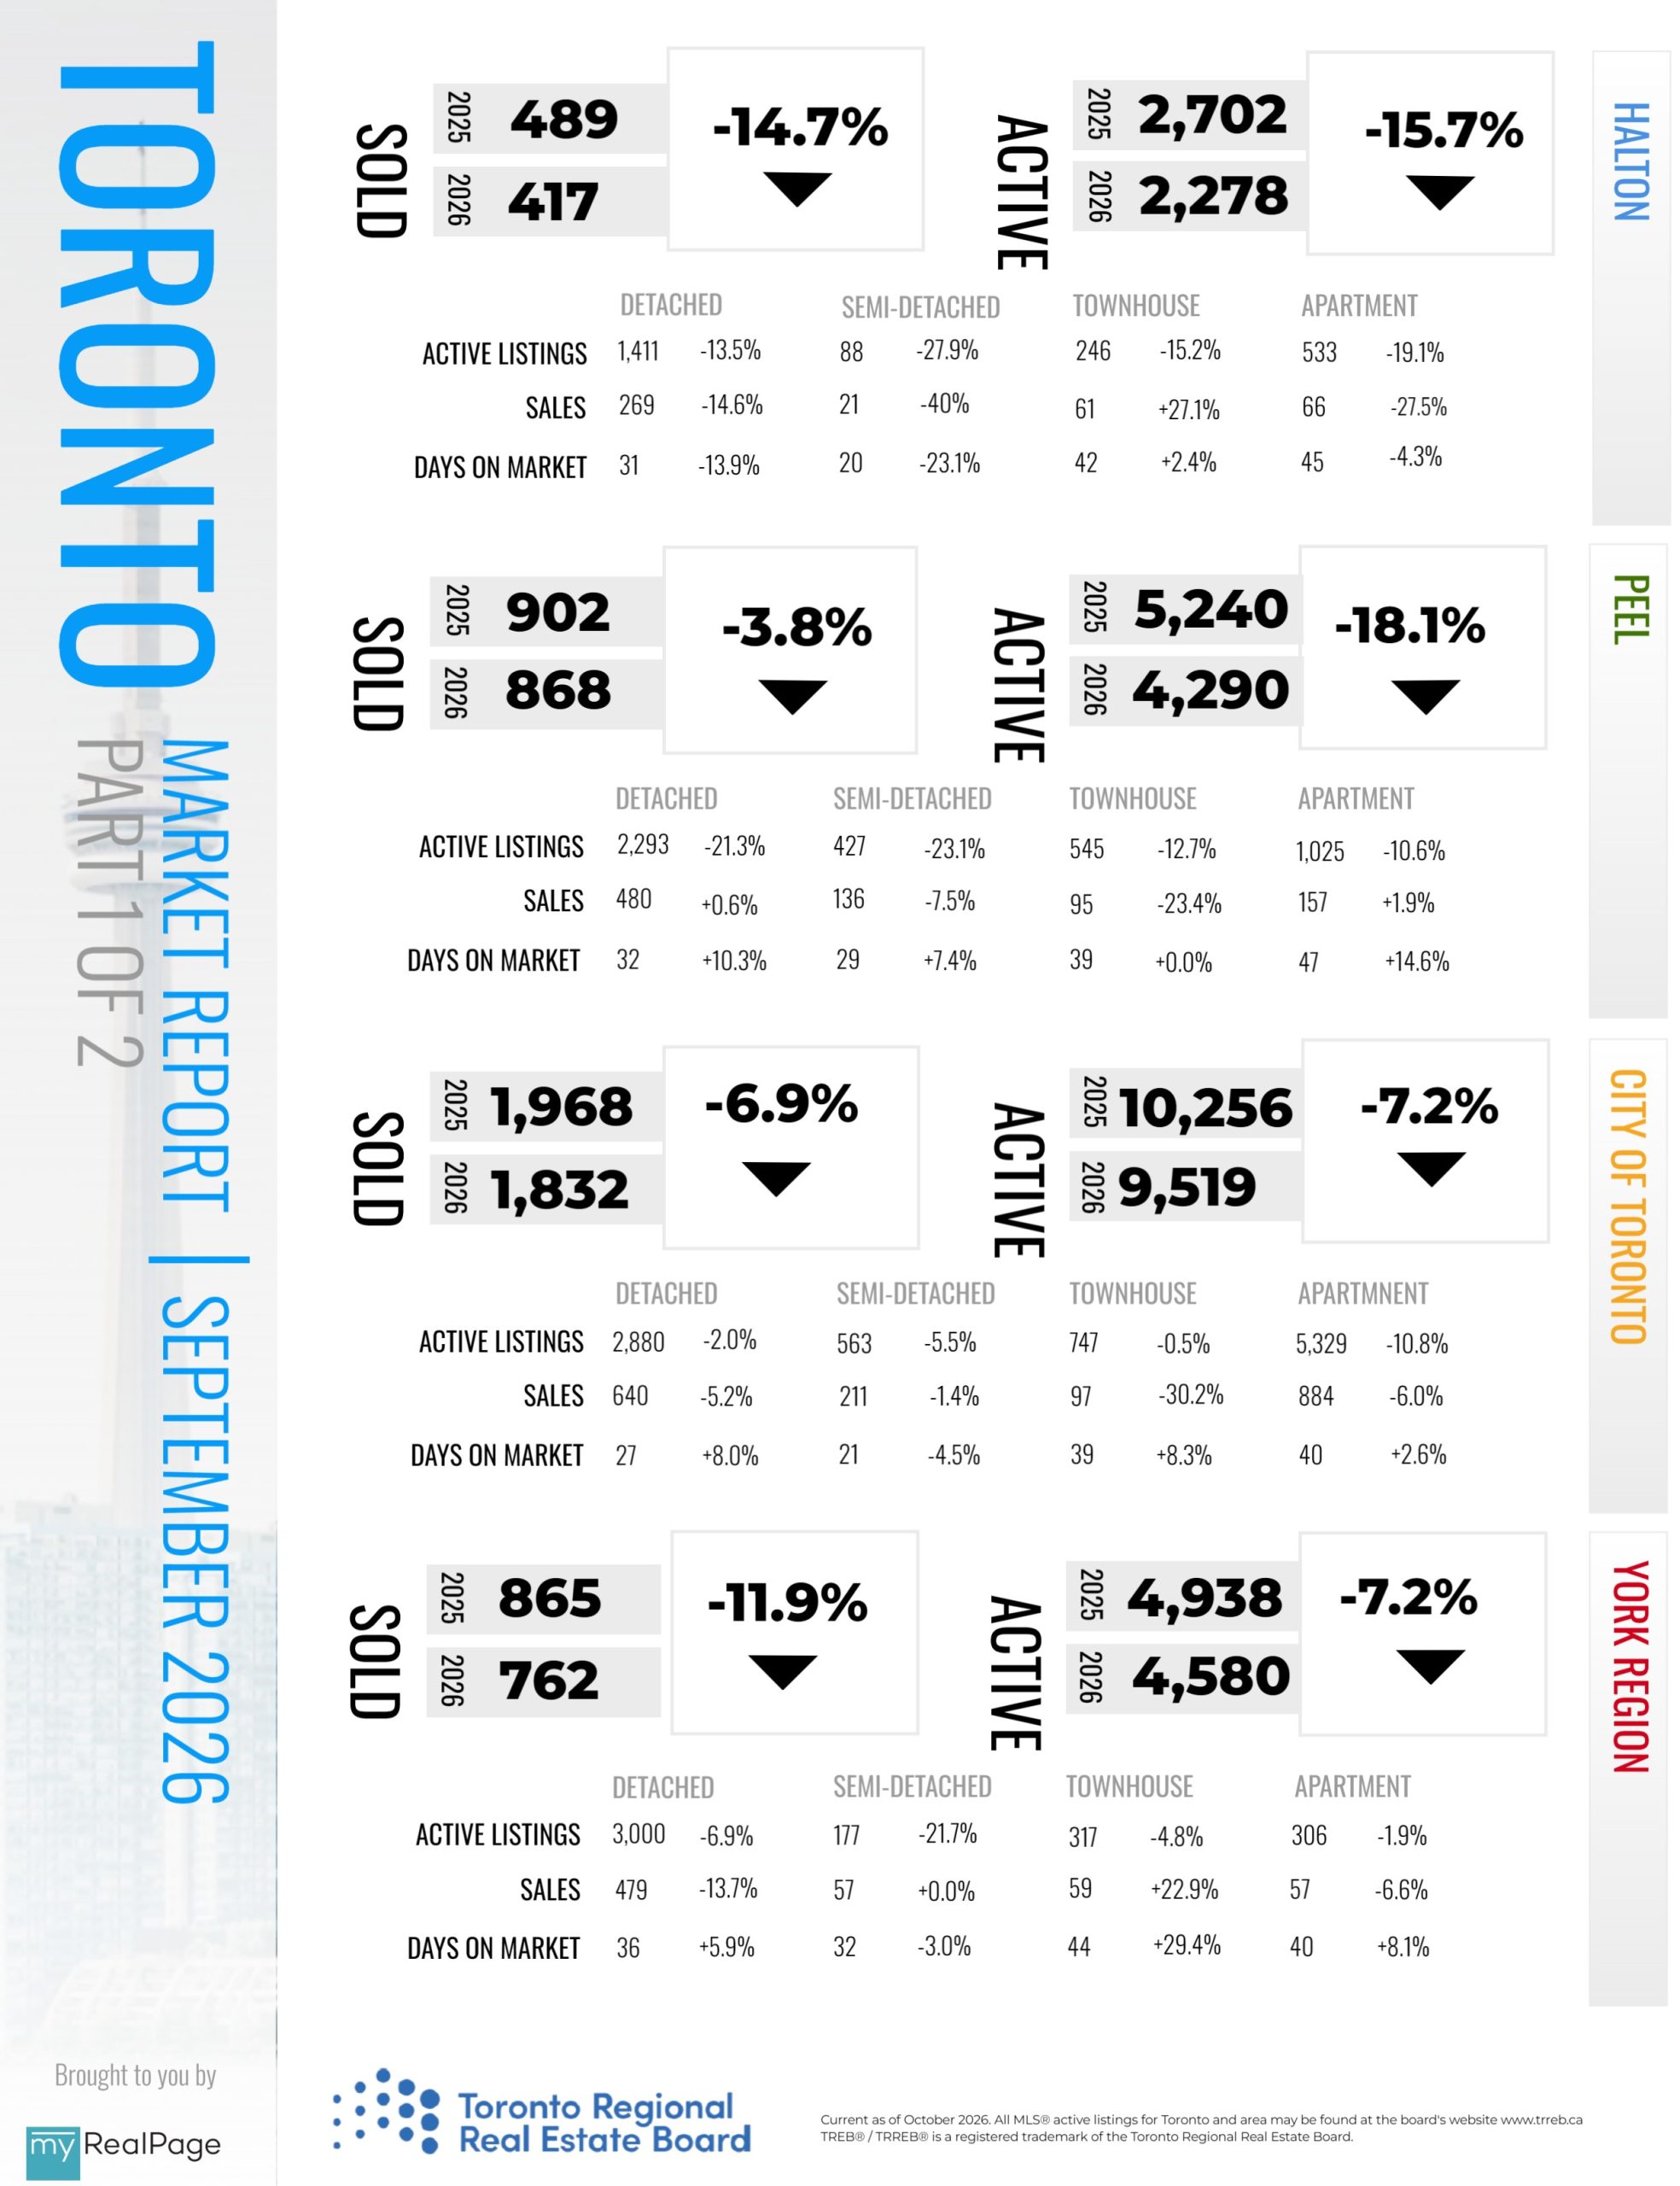
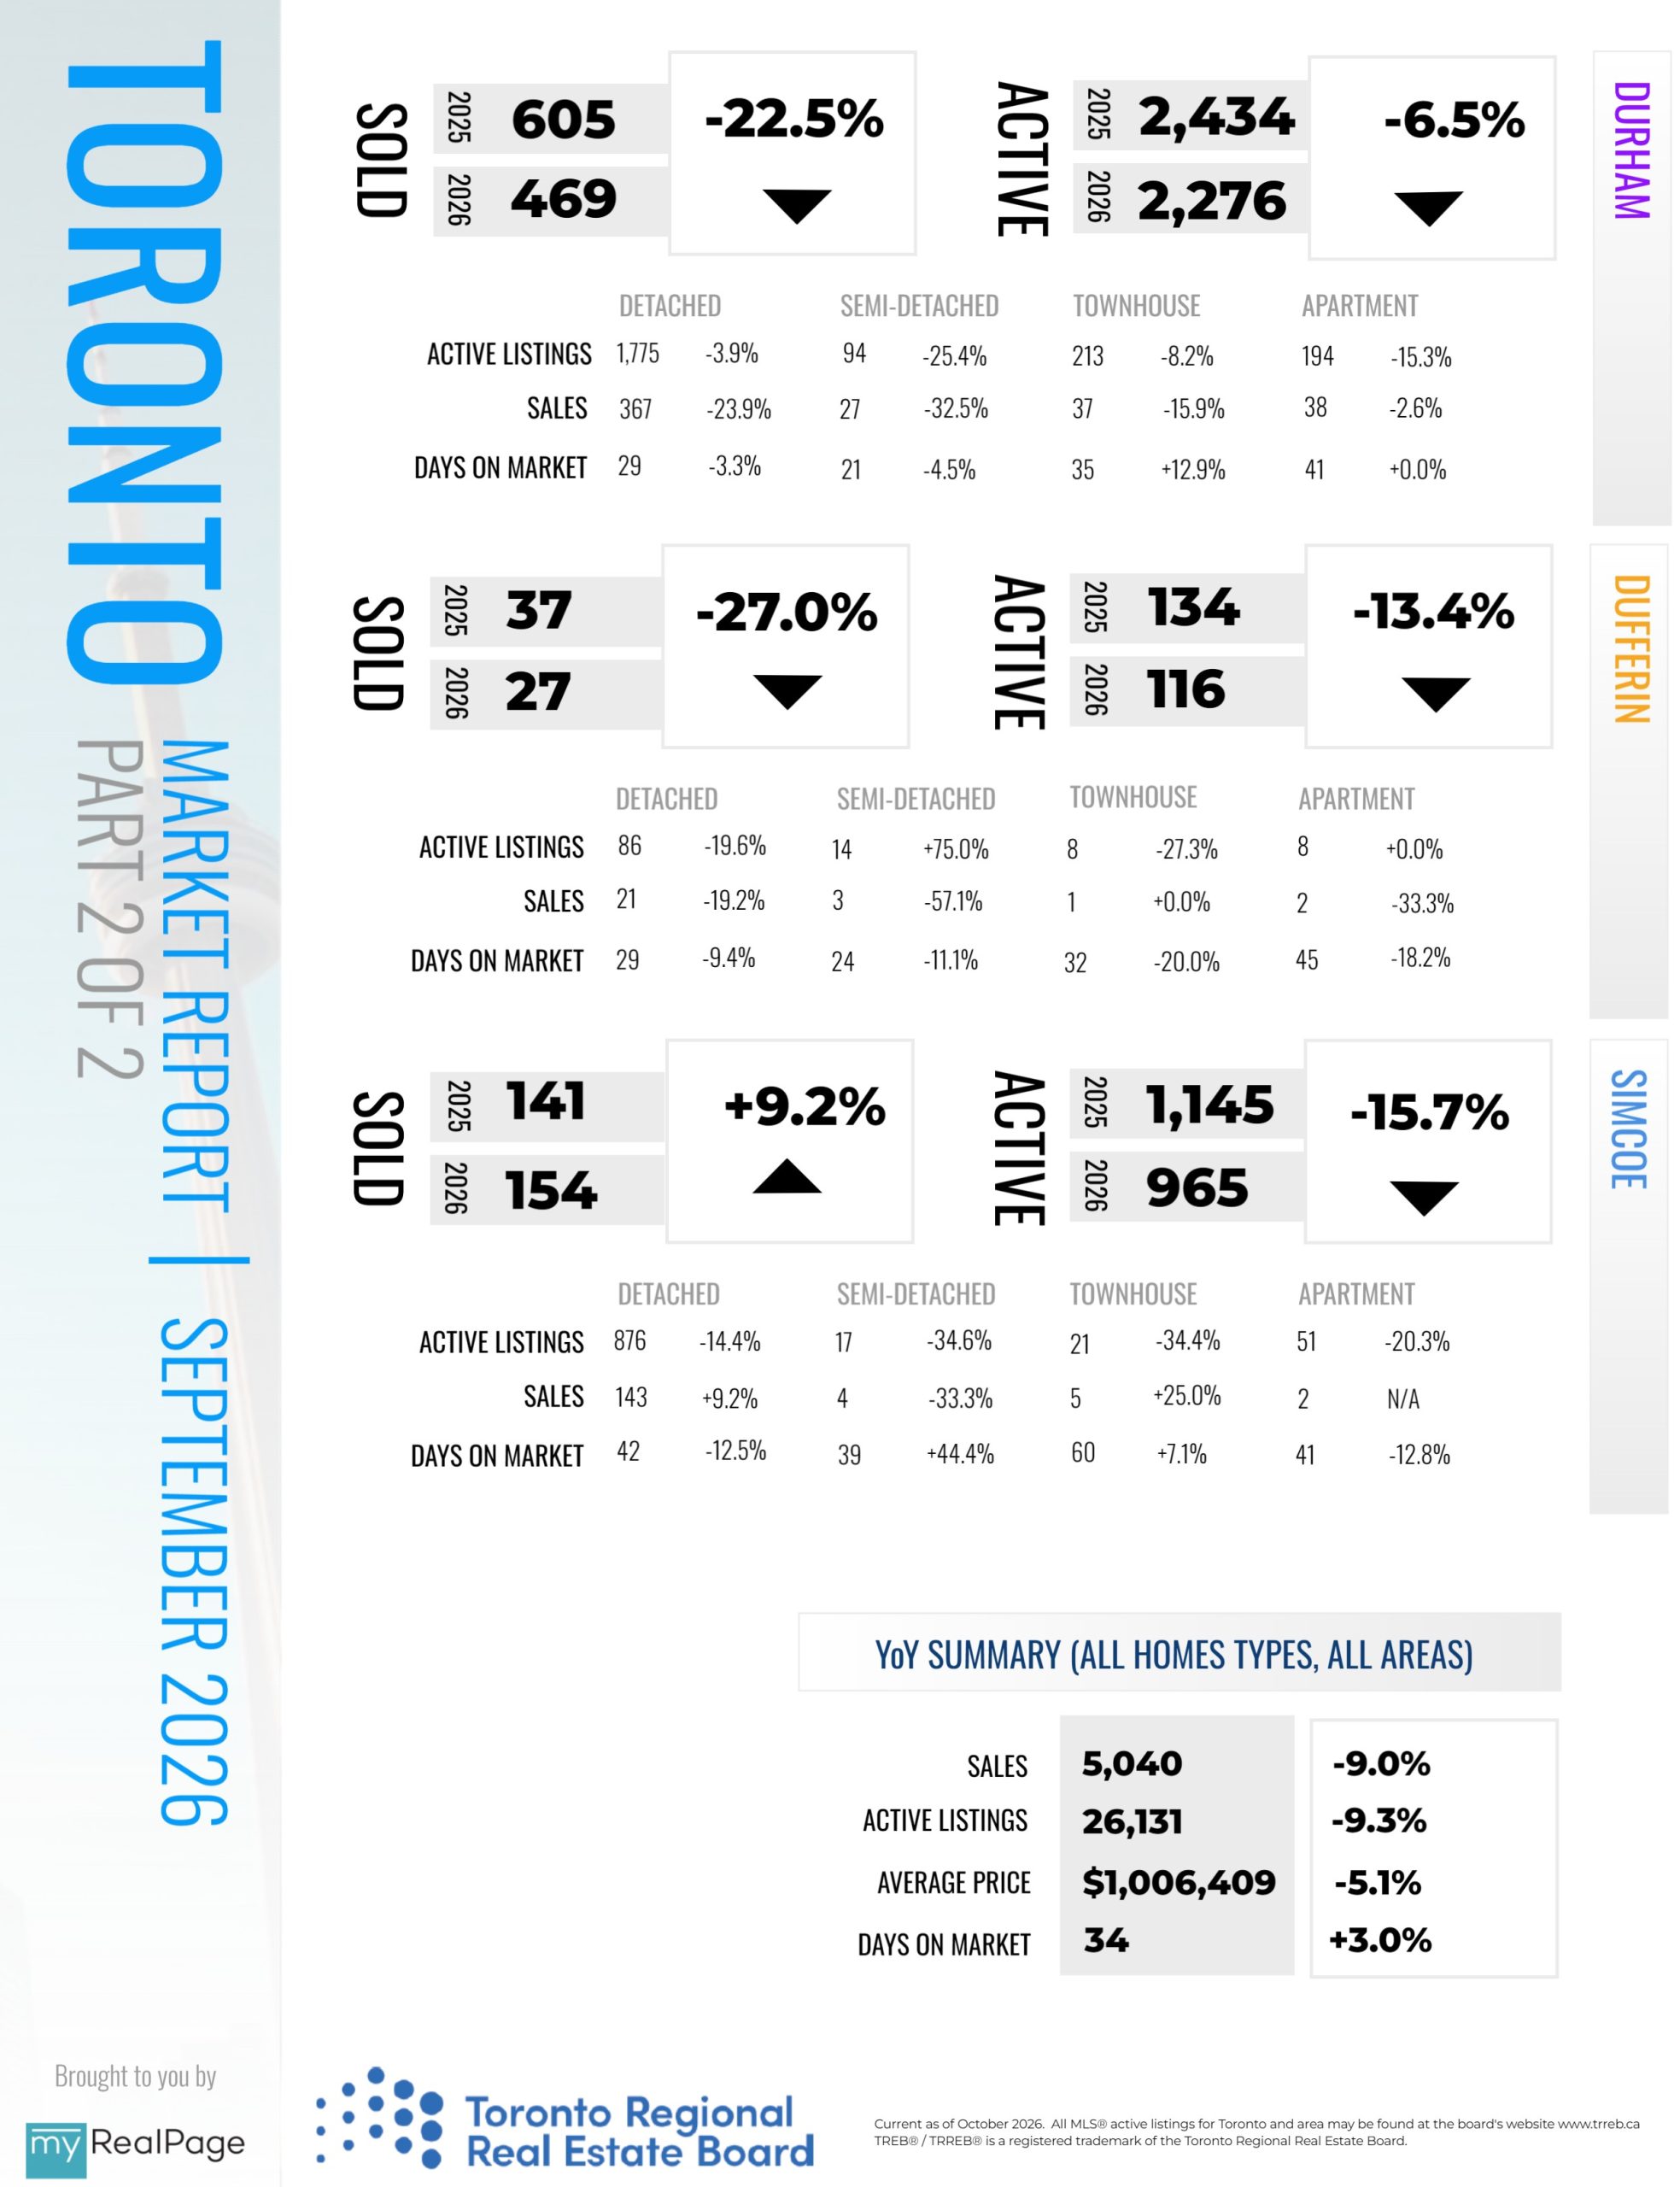
GTA REALTORS® reported 5,040 home sales through TRREB’s MLS® System in September 2026 – down nine per cent compared to September 2025. New listings entered into the MLS® System amounted to 16,500 – down by 14.4 percent year-over-year. On a seasonally adjusted basis, September 2026 home sales and new listings were down month-over-month compared to August 2026.
“Housing is one of the biggest issues on voters’ minds, and the upcoming municipal election will help shape housing policy across the GTA and Simcoe County for the next four years. The decisions our next mayors and councillors make on affordability, housing supply and the costs associated with buying a home can also influence buyer demand and confidence in the market,” said Toronto Regional Real Estate Board (TRREB) President Daniel Steinfeld.
The MLS® Home Price Index (MLS® HPI) Composite benchmark was down by 4.7 per cent year-over-year in September 2026. The average selling price, at $1,006,409, was down by 5.1 per cent. On a seasonally adjusted basis, both the MLS® HPI Composite and average selling price edged lower month-over-month compared to August 2026.
Read the full report on TRREB website!
The following data is a comparison between September 2025 and September 2026 numbers, and is current as of October of 2026. For last month’s numbers, check out our previous infographic!
Or follow this link for all our TREB / TRREB Infographics!
Download Printable Version – September 2026 TRREB, Toronto Market Report
Last Updated on October 9, 2026 by myRealPage
