INFOGRAPHICS: April 2019 VIREB Vancouver Island Market Reports

It’s once again time for our monthly market updates for areas covered by the Vancouver Island Real Estate Board (VIREB)!
In VIREB’s most recent media release, they emphasize that the mortgage stress test (Guideline B-20) continues to wreak havoc in the Vancouver, Fraser Valley, and Lower Mainland housing markets, which is spilling over, albeit more slowly, onto Vancouver Island. While the B.C. economy continues to be highly supportive of housing demand, the negative shock to affordability and purchasing power created by the stress test is making it extremely difficult for some buyers, particularly millennials, to enter the housing market. Prospective buyers who can afford monthly mortgage payments are unable to qualify because Guideline B-20 has eroded their purchasing power by as much as 20%.
Weak housing demand has also contributed to an increase in total active residential listings across the province. Whether rising inventory levels will be enough to lower prices and make housing more affordable remains to be seen.
However, despite decreased demand, prices in the VIREB area are still rising, although those increases are softening. VIREB REALTORS® are seeing price reductions on higher-priced homes while demand is still relatively strong for houses in the $400,000 to $550,000 range.
Trend-wise, VIREB’s housing market has transitioned from one favouring sellersto one that is balanced. Balanced markets offer buyers more choice and more room to negotiate. Sellers need to curb their expectations but, in turn, buyers must also be willing to pay a fair price.
According to Kaye Broens, VIREB President,
“We’re seeing many sellers who want to list their homes at 2016 and 2017 prices, expecting to get the same amount of money their neighbour did two years ago, which isn’t realistic. On the other hand, some buyers are questioning the fair market value of a home they’re interested in and choosing not to purchase, which is counterproductive.”
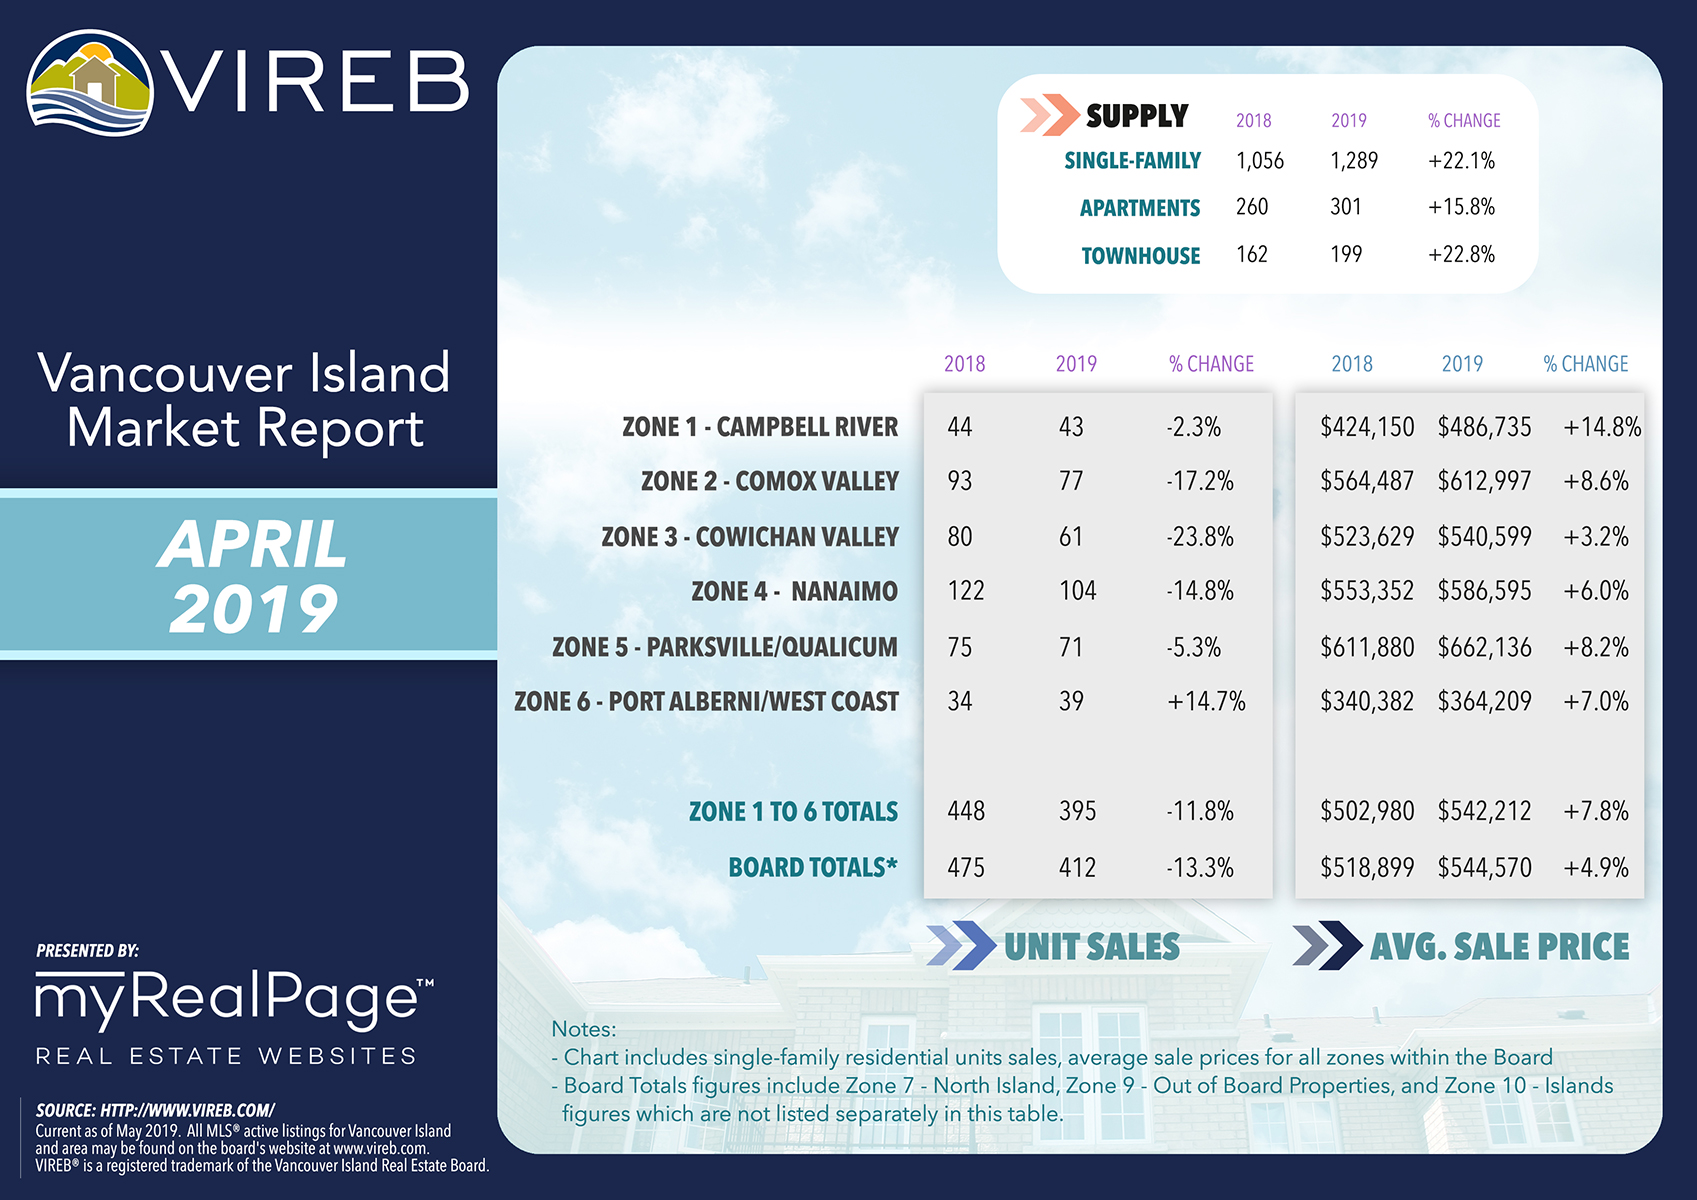
The following data is a comparison between April 2018 and April 2019 numbers, and is current as of May 2019. Click here to check out last month’s infographics.
You can also view all our VIREB infographics by clicking here.
Click on the images for a larger view!
(Protip: Make sure to grab the printable PDF versions, too! It fits best when printed on A4-sized sheets, AND we’ve added an area on the sheet where you can attach your business card! 🙂 )
Download Printable Version – April 2019 VIREB Market Report

(Image Source: VIREB Twitter)
Last Updated on July 25, 2022 by myRealPage
