INFOGRAPHICS: March 2019 VIREB Vancouver Island Market Reports

As we head right into Spring, we’ve put together your request for some infographics for VIREB. So here it is! Here are this month’s market updates for areas covered by the Vancouver Island Real Estate Board (VIREB)!
In their most recent media release, it appears that Guideline B-20 continues to hamper housing sales within VIREB.
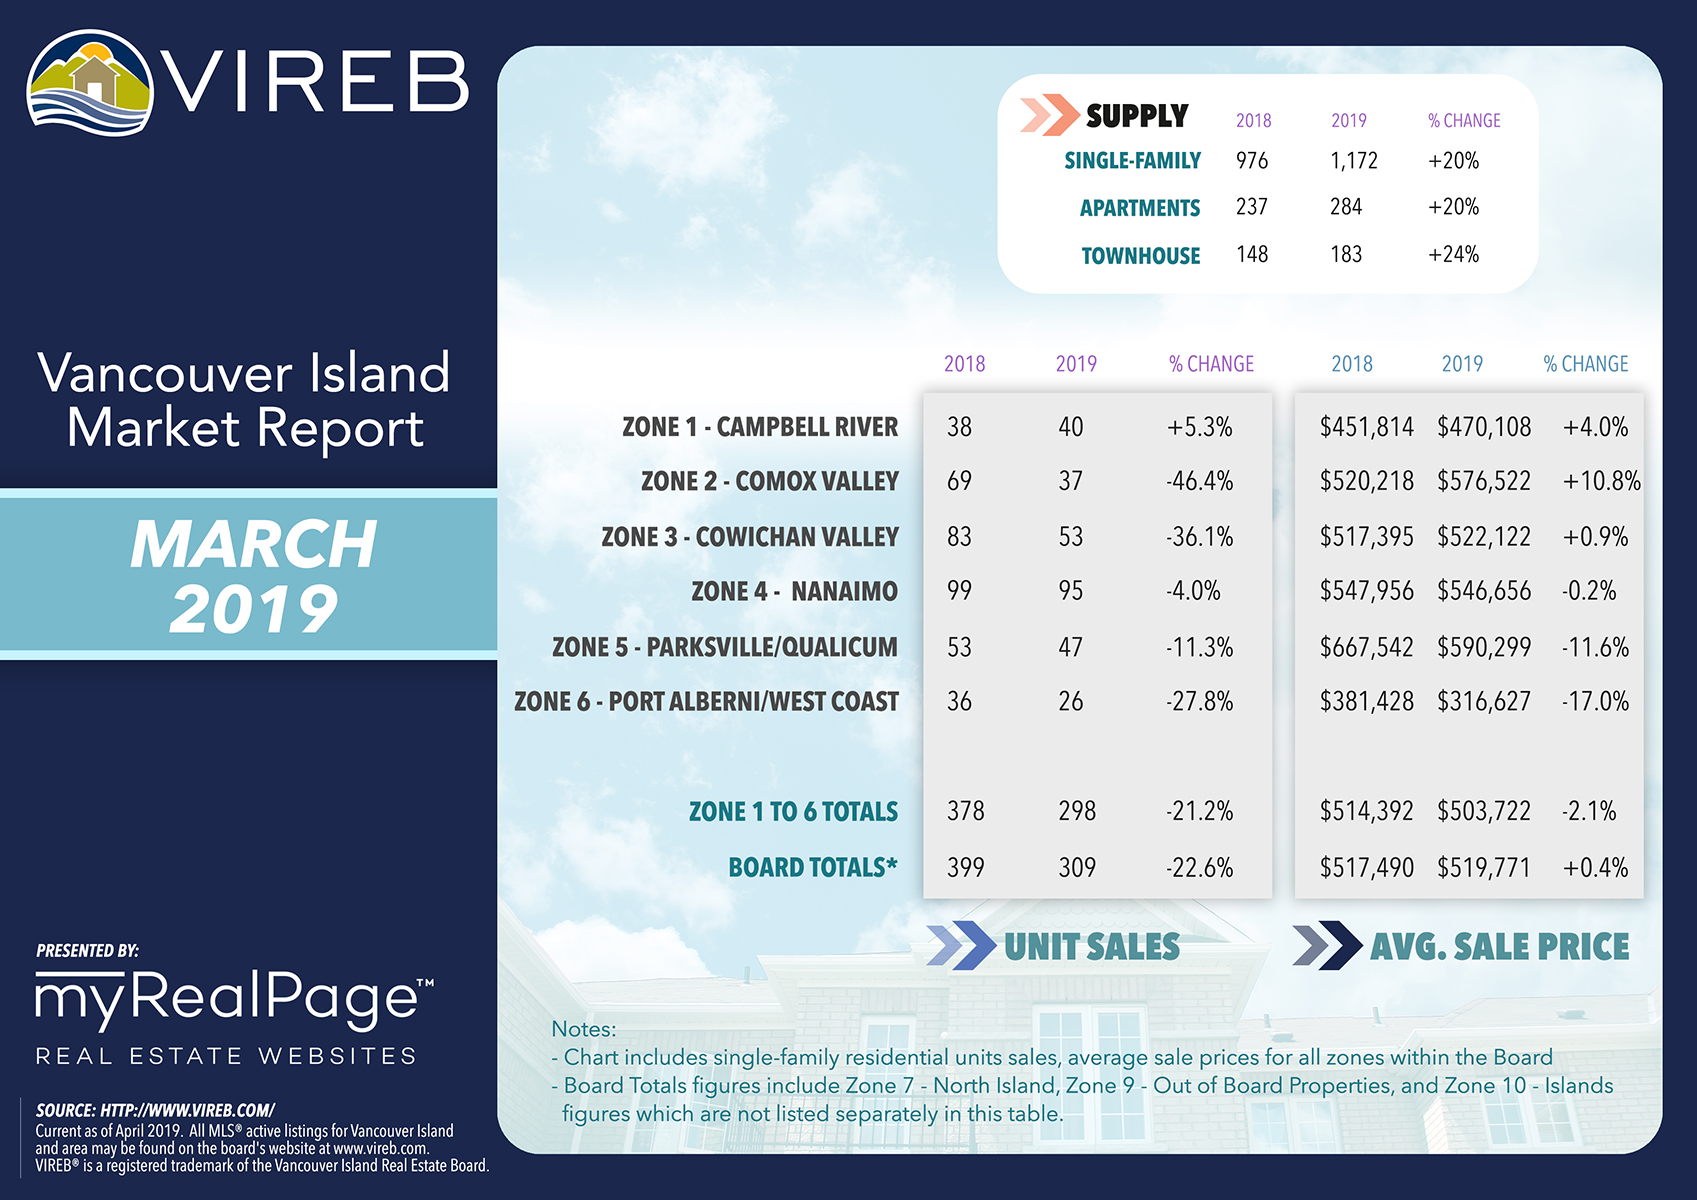
According to the report, sales of single-family homes in March board-wide dipped by 23% year over year but were up 36% from February. Last month, 309 single-family homes sold on the MLS,  compared to 399 in March 2018, and 227 in February 2019.
In the apartment and townhouse categories, sales dropped by 10% and 30% respectively. Housing sales have weakened throughout most of the province, which the British Columbia Real Estate Association largely attributes to the mortgage stress test (Guideline B-20).
While the B.C. economy continues to be highly supportive of housing demand, the negative shock to affordability and purchasing power created by the stress test is expected to continue preventing many buyers, particularly millennials, from entering the housing market.
In the VIREB area, the stress test is helping reduce demand for higher-priced properties and pushing buyers towards less expensive homes. In turn, this is compressing the lower end of the market.
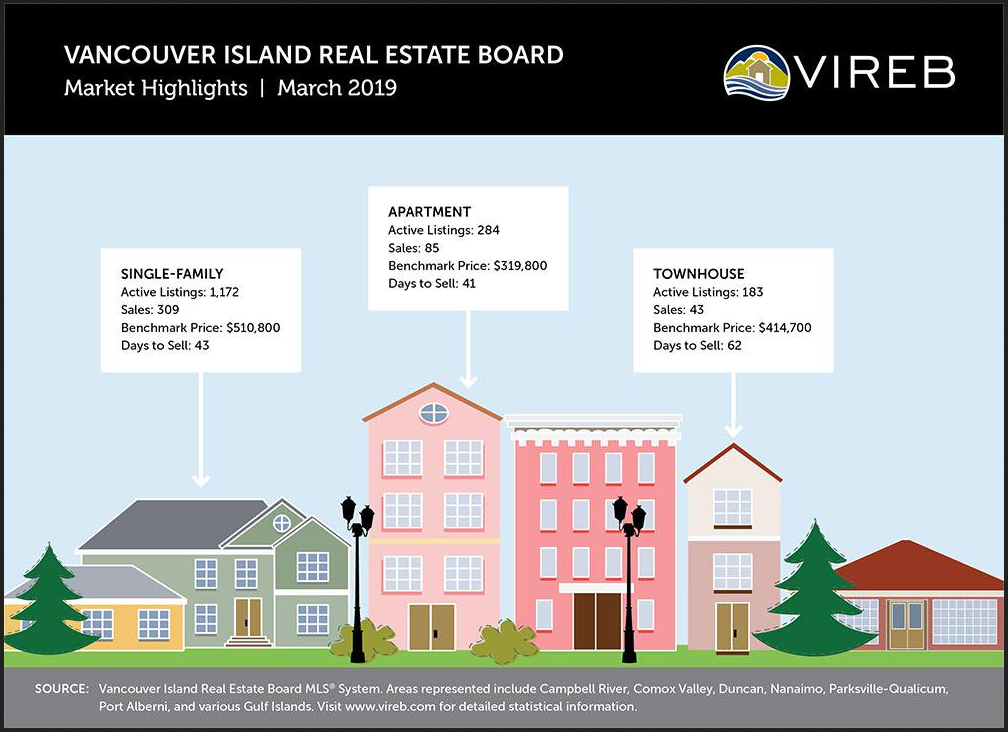
Weakened housing demand has also contributed to an increase in total active residential listings across the province. In the VIREB area, inventory of single-family homes in March rose by 20% from one year ago, (976 to 1,172), while active listings of apartments climbed by 20% (237 to 284) year over year, and townhouses by 24% (148 to 183).
However, despite decreased demand, prices in the VIREB area continue to rise over last year, although increases are expected to soften in the coming months.
The following data is a comparison between March 2018 and March 2019 numbers, and is current as of April 2019.
You can also view all our VIREB infographics by clicking here.
Click on the images for a larger view!
(Protip: Make sure to grab the printable PDF versions, too! It fits best when printed on A4-sized sheets, AND we’ve added an area on the sheet where you can attach your business card! 🙂 )
Download Printable Version – March 2019 VIREB Market Report
(Image Source: VIREB Twitter)
Last Updated on July 25, 2022 by myRealPage
