INFOGRAPHICS: April 2020 TRREB Toronto Market Reports

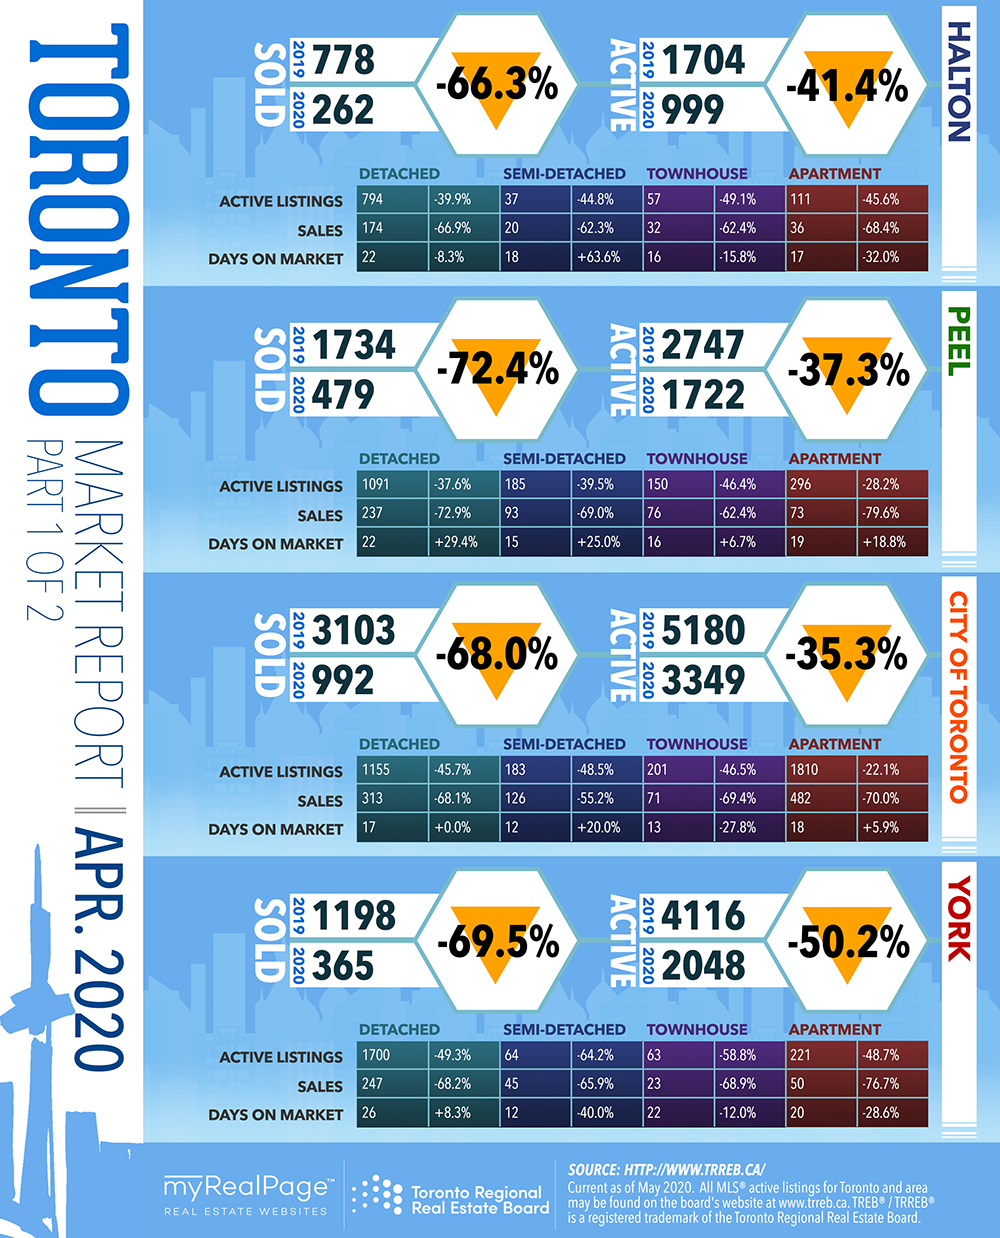
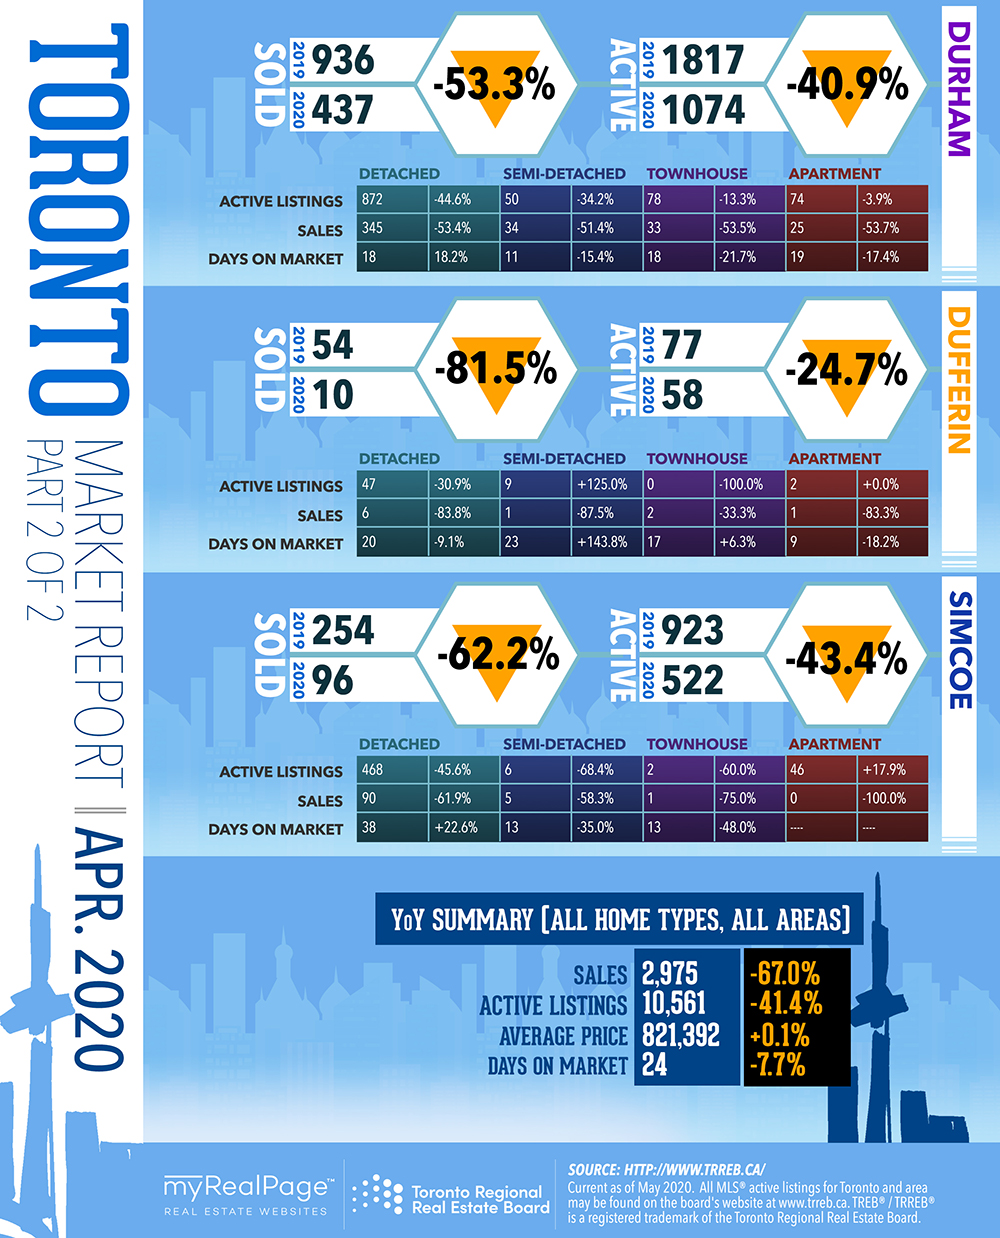
Toronto Regional Real Estate Board President Michael Collins released the following key housing market statistics for April 2020.
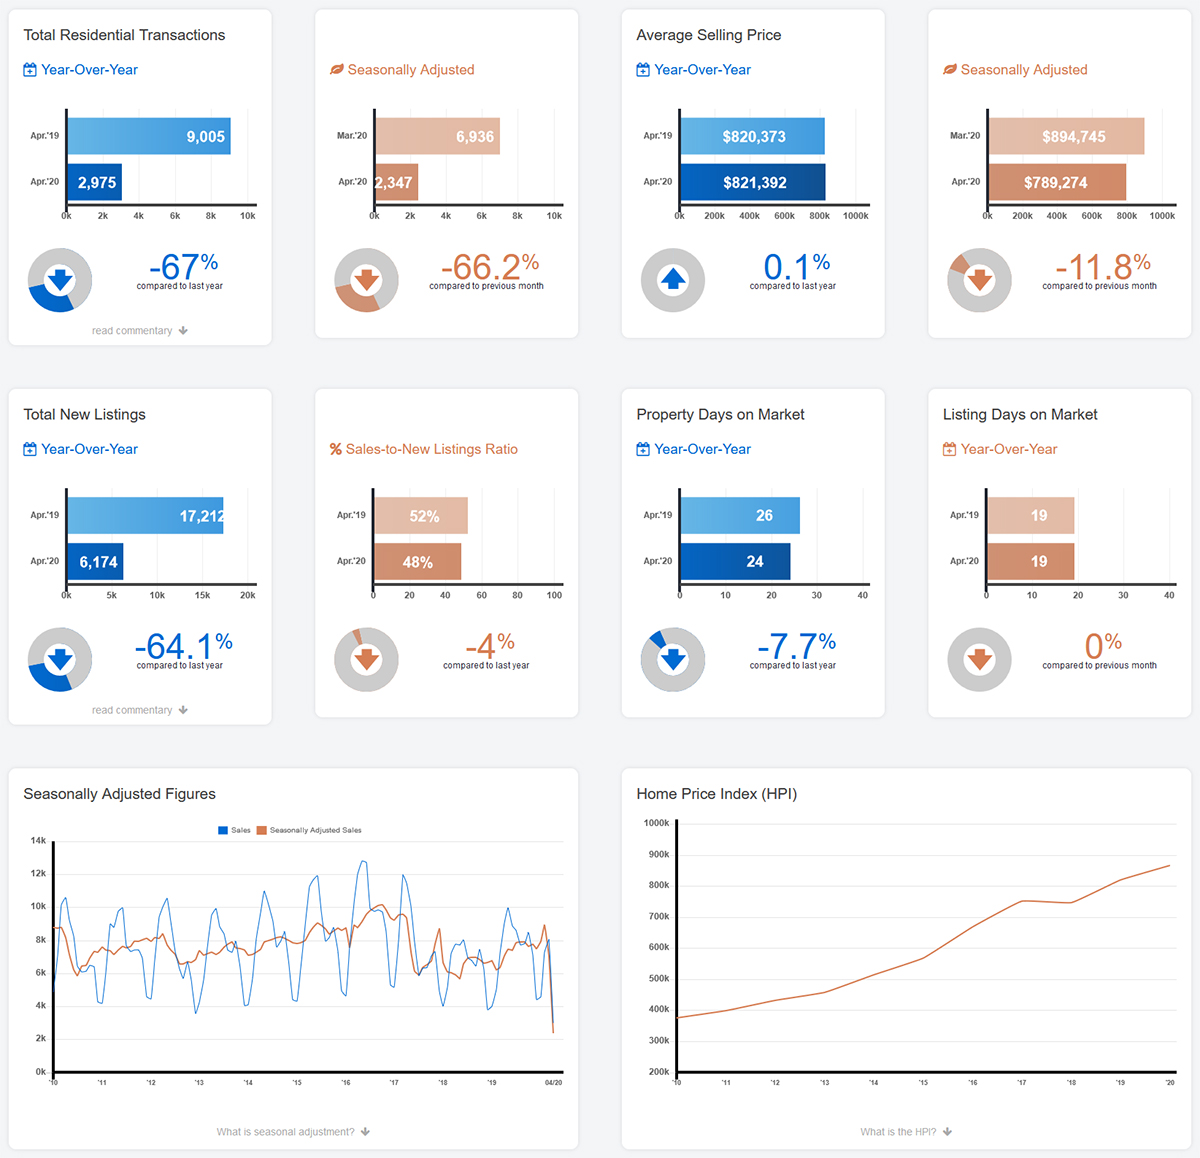
Greater Toronto Area REALTORS® reported 2,975 residential transactions through TRREB’s MLS® System. This result was down by 67% compared to April 2019. Weekday sales remained within a relatively steady range during the month, averaging 130 per day. New listings amounted to 6,174 in April 2020 – down on a year-over-year basis by a similar rate compared to sales (-64.1%).
Read the full report over on the TRREB website.
The following data is a comparison between April 2019 and April 2020 numbers, and is current as of May 2020. For last month’s numbers, check out our previous infographic!
Or follow this link for all our TREB / TRREB Infographics!
Click on the images for a larger view! (Protip: Make sure to grab the printable PDF versions, too! It fits best when printed on A4-sized sheets, AND we’ve added an area on the sheet where you can attach your business card! 🙂 )
Download Printable Version – April 2020 TRREB, Toronto Market Report
-
- (Image Source: TRREB.ca)
Last Updated on July 25, 2022 by myRealPage
