INFOGRAPHICS: March 2020 TRREB Toronto Market Reports

With the current situation, we hope that everyone is healthy and well. Here are the latest real estate market updates for areas covered by the Toronto Regional Real Estate Board (TRREB, formerly TREB)!
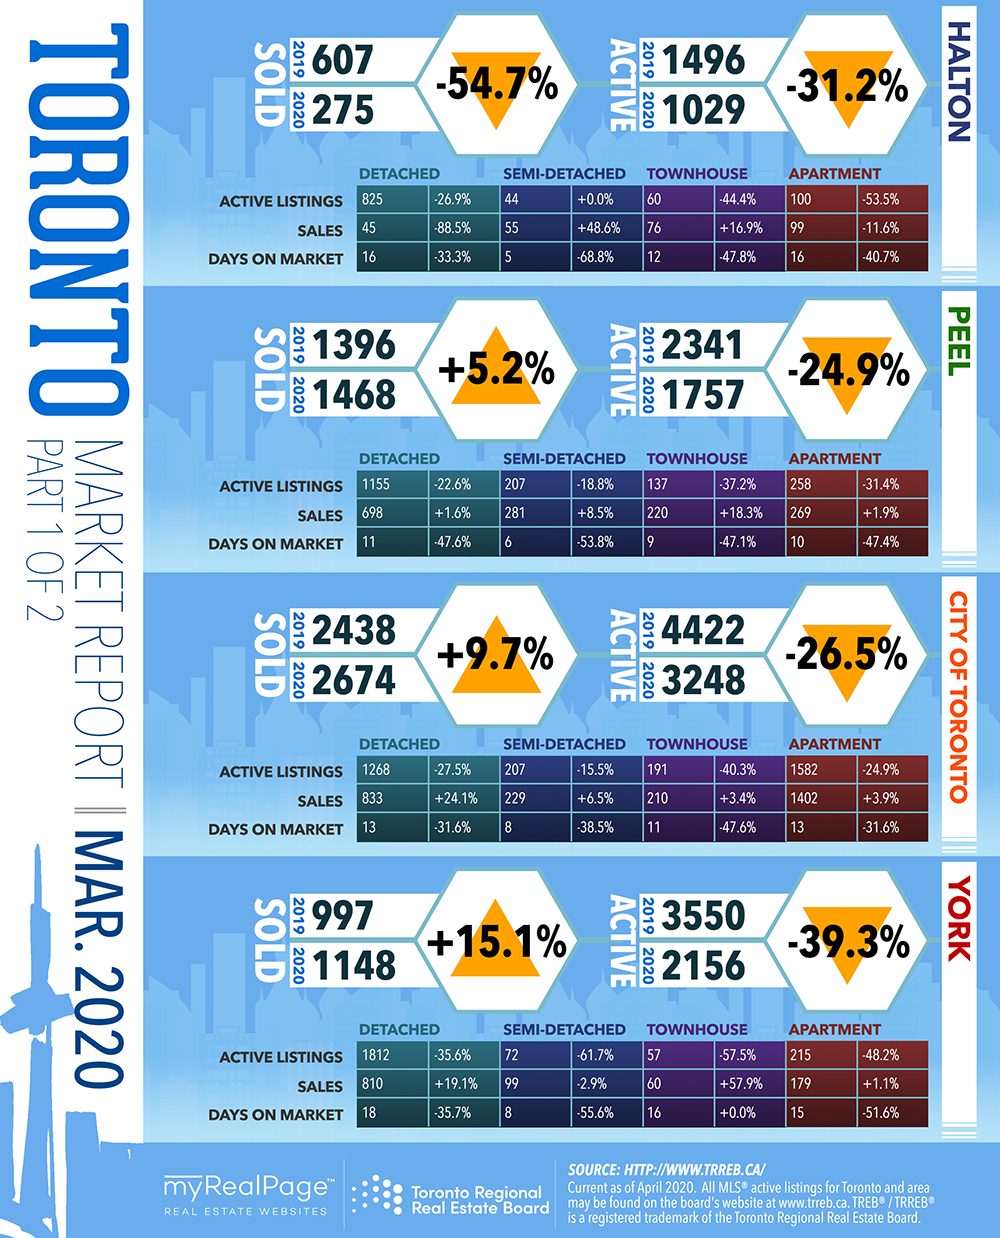
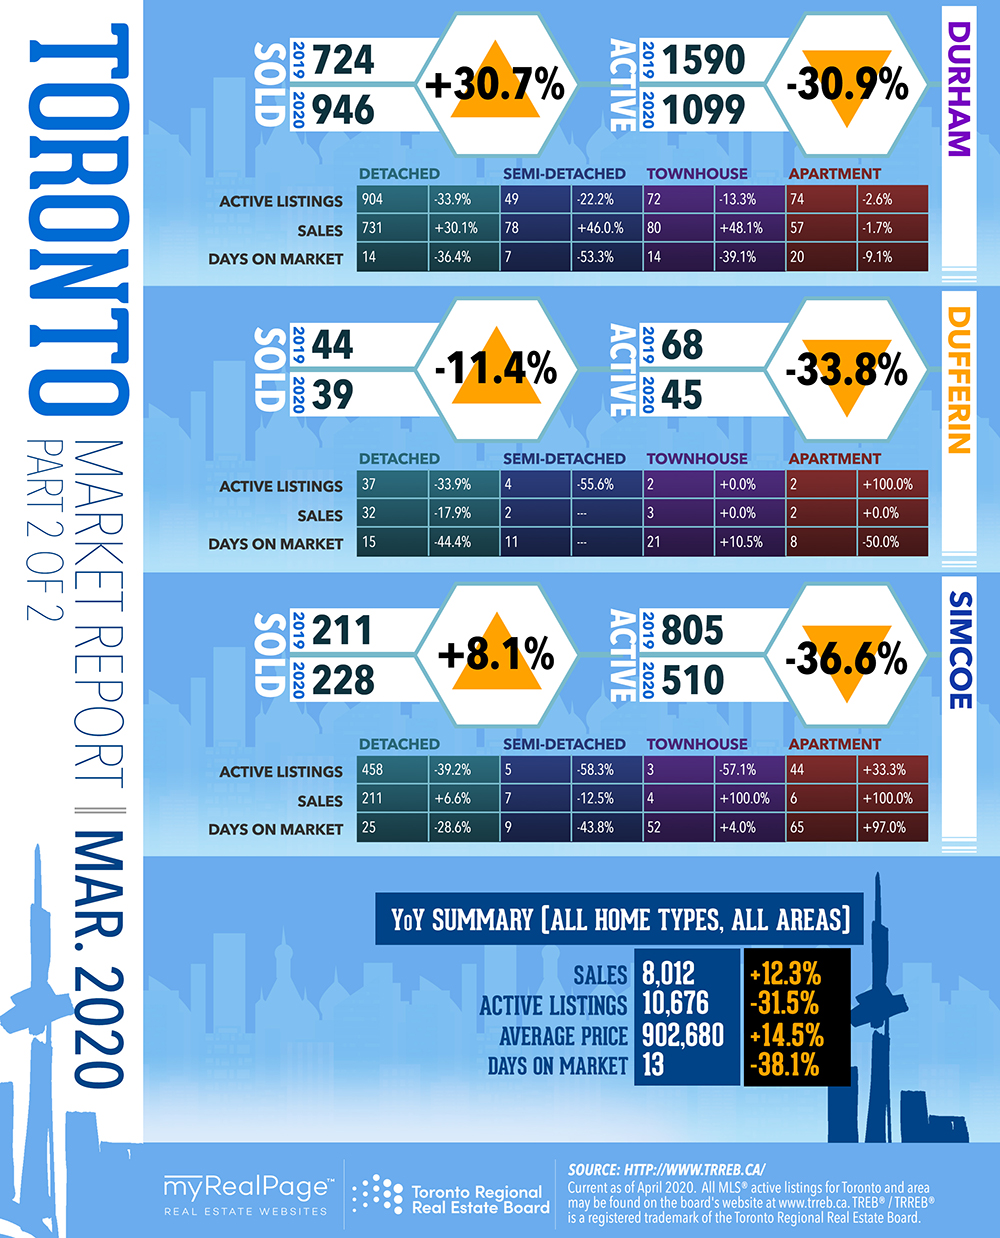
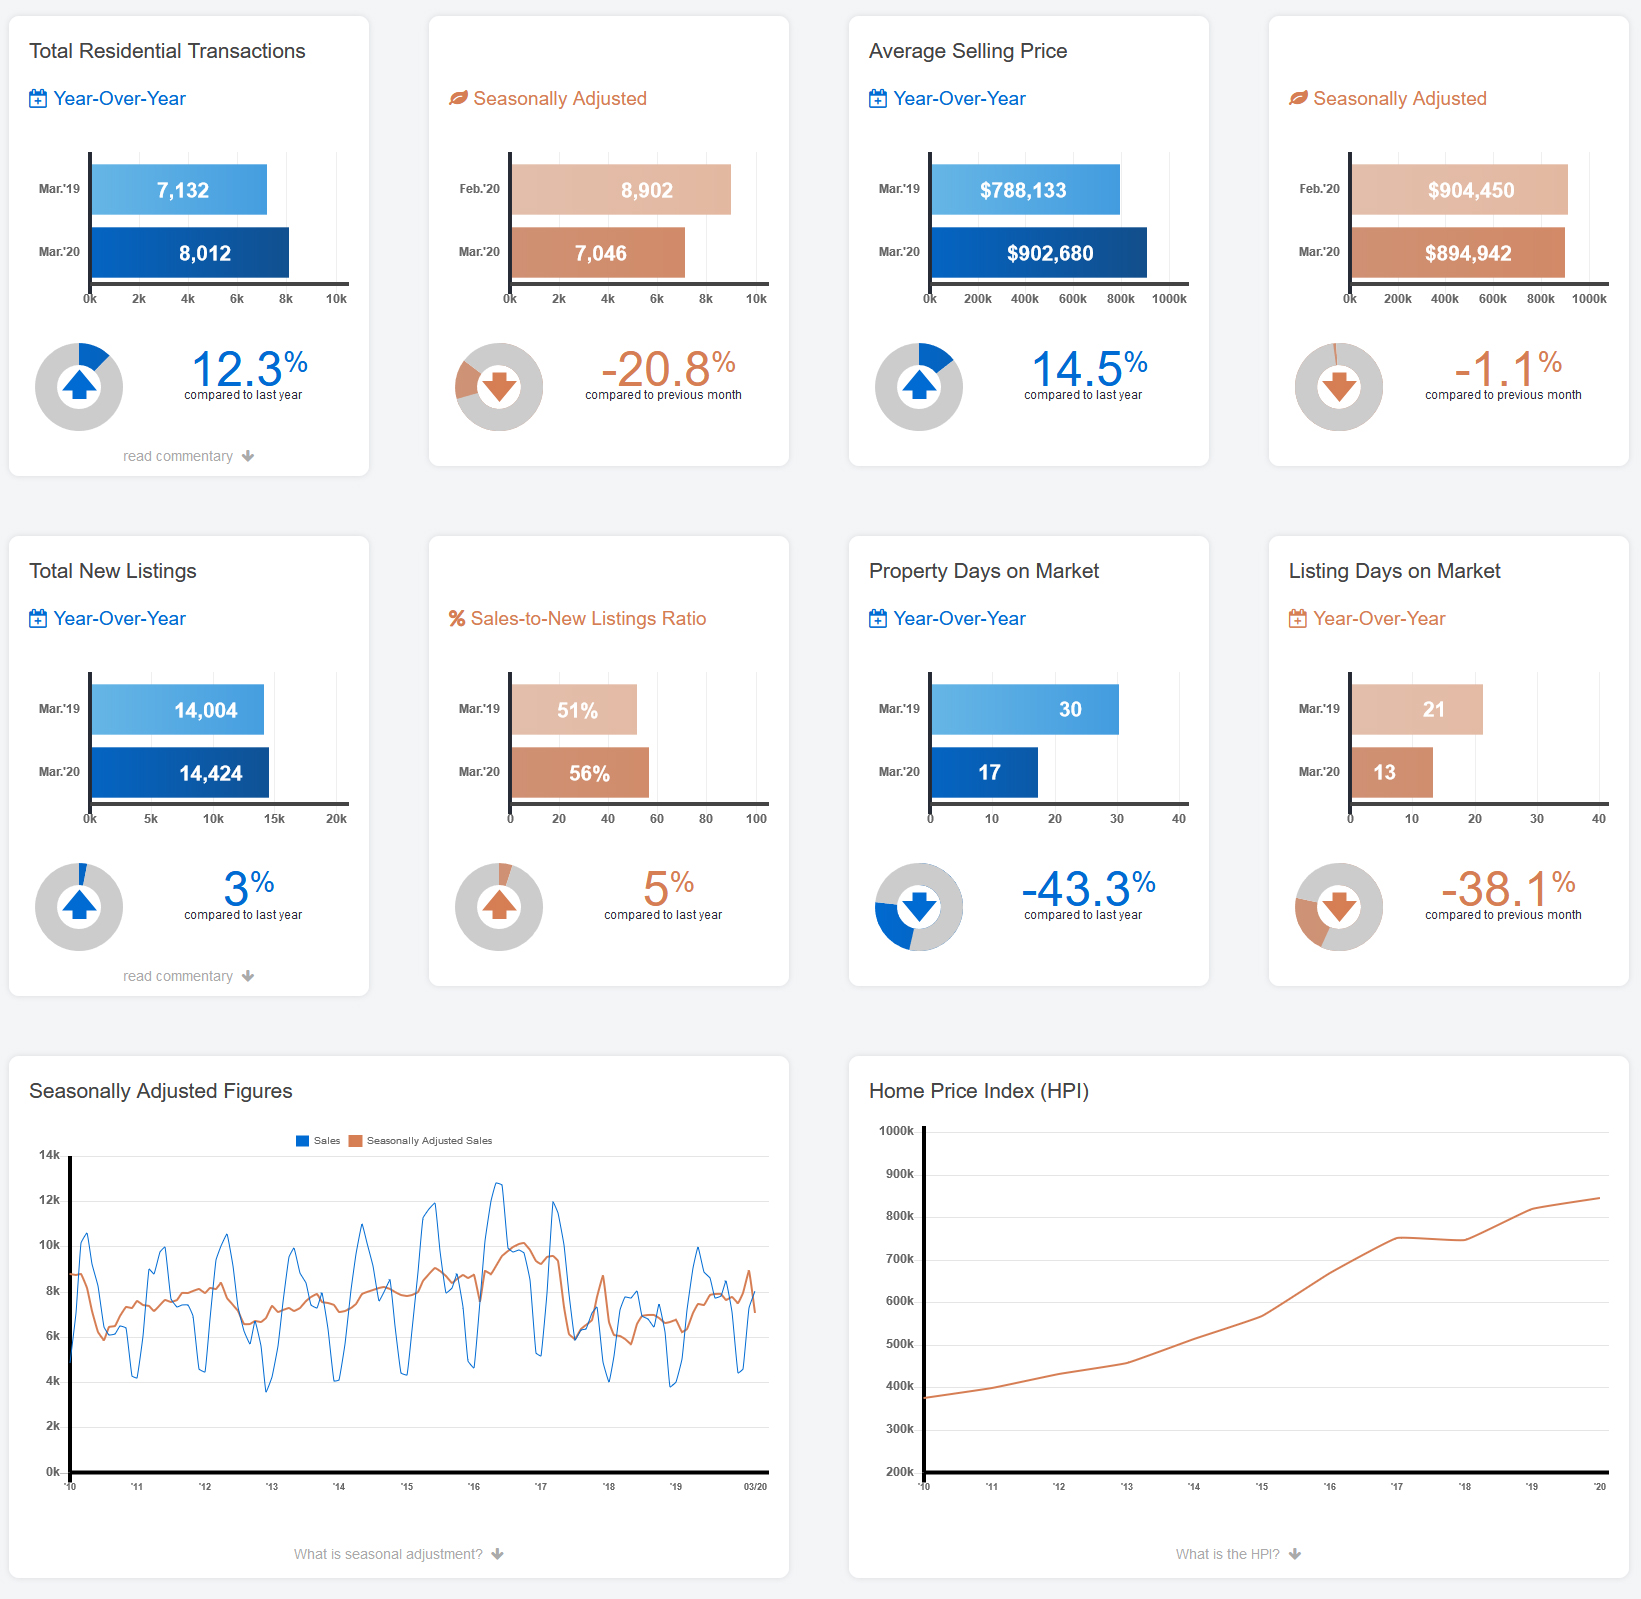
As noted in their latest reports, Toronto Regional Real Estate Board President Michael Collins announced that Greater Toronto Area REALTORS® reported 8,012 home sales through TRREB’s MLS® System in March 2020 – up by 12.3% compared to 7,132 sales reported in March 2019.
However, despite a strong increase in sales for March 2020 as a whole, there was a clear break in market activity between the pre-COVID-19 and post-COVID-19 periods. For the purposes of this release, the start of the post-COVID-19 period was the week beginning Sunday, March 15.
- The overall March sales result was clearly driven by the first two weeks of the month. There were 4,643 sales reported in the pre-COVID-19 period, accounting for 58% of total transactions and representing a 49% increase compared to the first 14 days of March 2019.
- There were 3,369 sales reported during the post-COVID-period – down by 15.9% compared to the same period in March 2019.
For March as a whole, new listings were up by 3% year-over-year to 14,424. However, similar to sales, new listings dropped on a year-over-year basis during the second half of the month (beginning March 15) by 18.4%.
The MLS® Home Price Index Composite Benchmark price was up by 11.1% year-over-year in March 2020. The average selling price for March 2020 as a whole was $902,680 – up 14.5% compared to March 2019. The average selling price for sales reported between March 15 and March 31, was $862,563 – down from the first half of March 2020, but still up by 10.5% compared to the same period last year.
It should also be noted that TRREB has issued a Frequently Asked Questions (FAQ) guidance to its 56,000 REALTOR® Members on the provincial shutdown, as it relates to trading in real estate. The key message is to avoid in-person business, such as open houses and showings with clients, during the provincial state of emergency. Geneva This will include home sellers, buyers, tenants and business clients. You can view the guide below.
The following data is a comparison between March 2019 and March 2020 numbers, and is current as of April 2020. For last month’s numbers, check out our previous infographic!
Or follow this link for all our TREB / TRREB Infographics!
Click on the images for a larger view!
(Protip: Make sure to grab the printable PDF versions, too! It fits best when printed on A4-sized sheets, AND we’ve added an area on the sheet where you can attach your business card! 🙂 )
Download Printable Version – March 2020 TRREB, Toronto Market Report
TRREB COVID-19 Frequently Asked Questions Guidance
(Image Source: TRREB.ca)
Last Updated on July 25, 2022 by myRealPage
