INFOGRAPHICS: April 2021 FVREB Fraser Valley, South Surrey, Etc. Market Reports

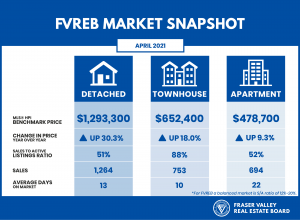
Monthly sales and new listings in the Fraser Valley continue blistering pace; surge in inventory starting to calm prices
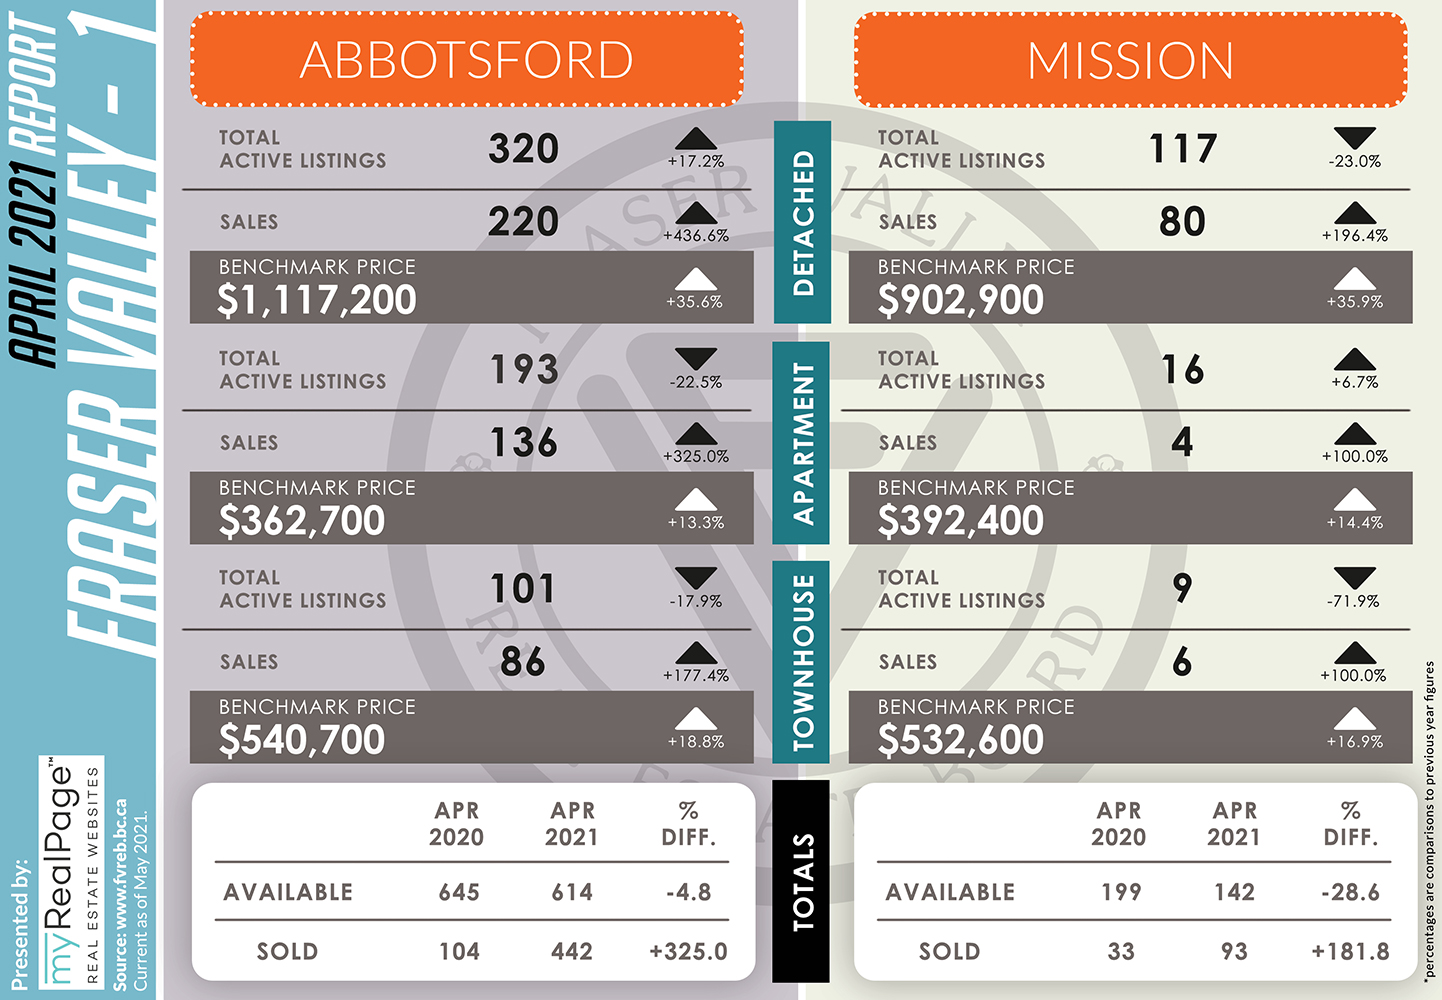
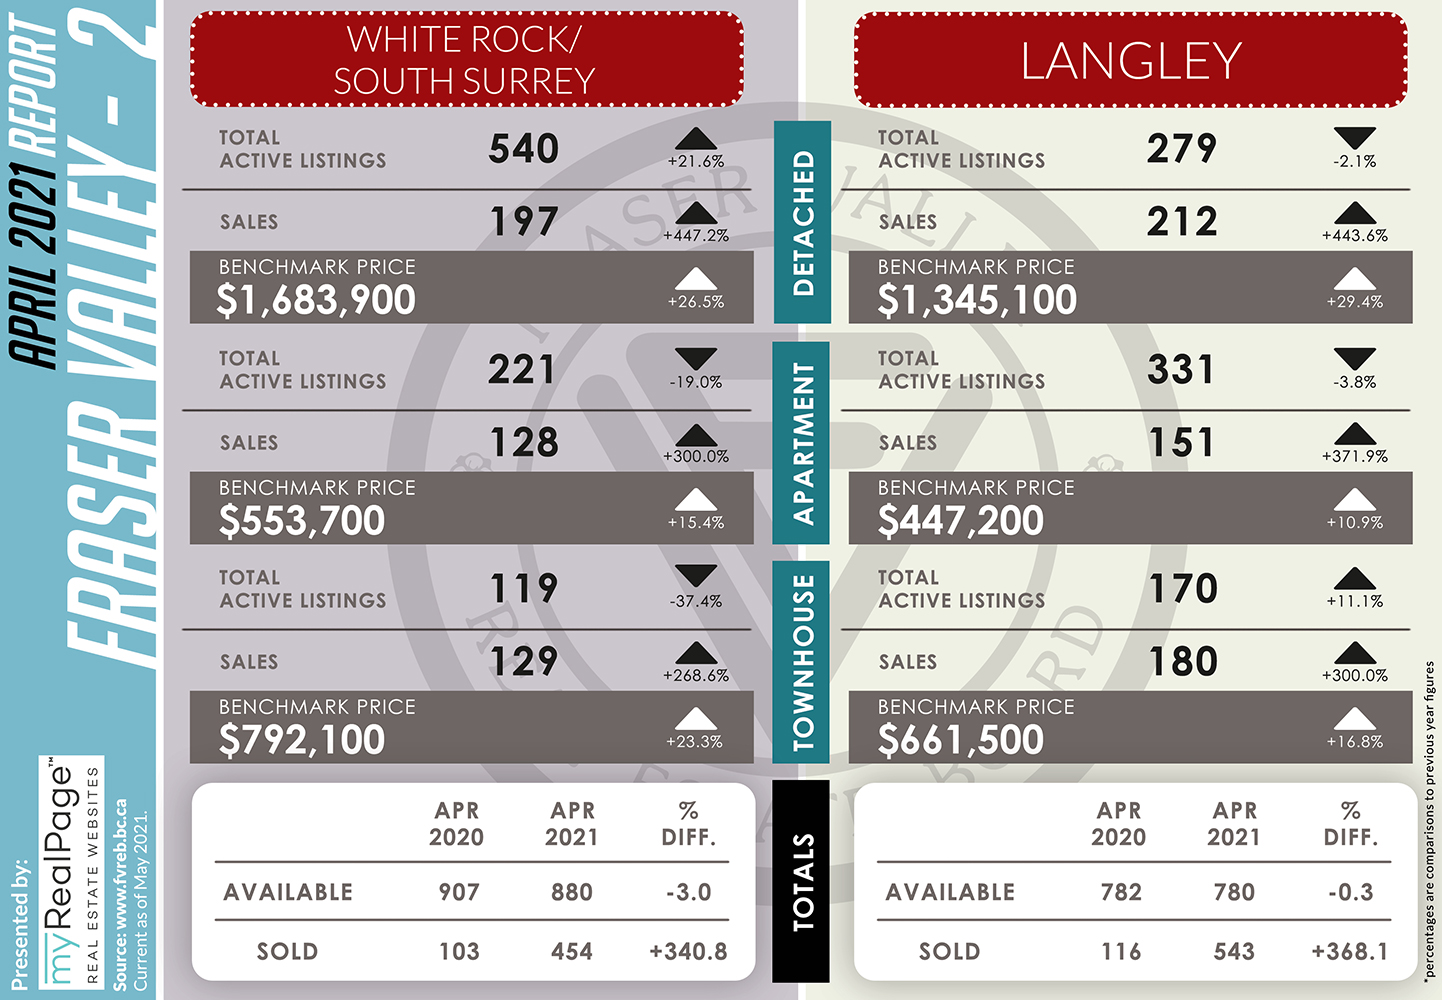
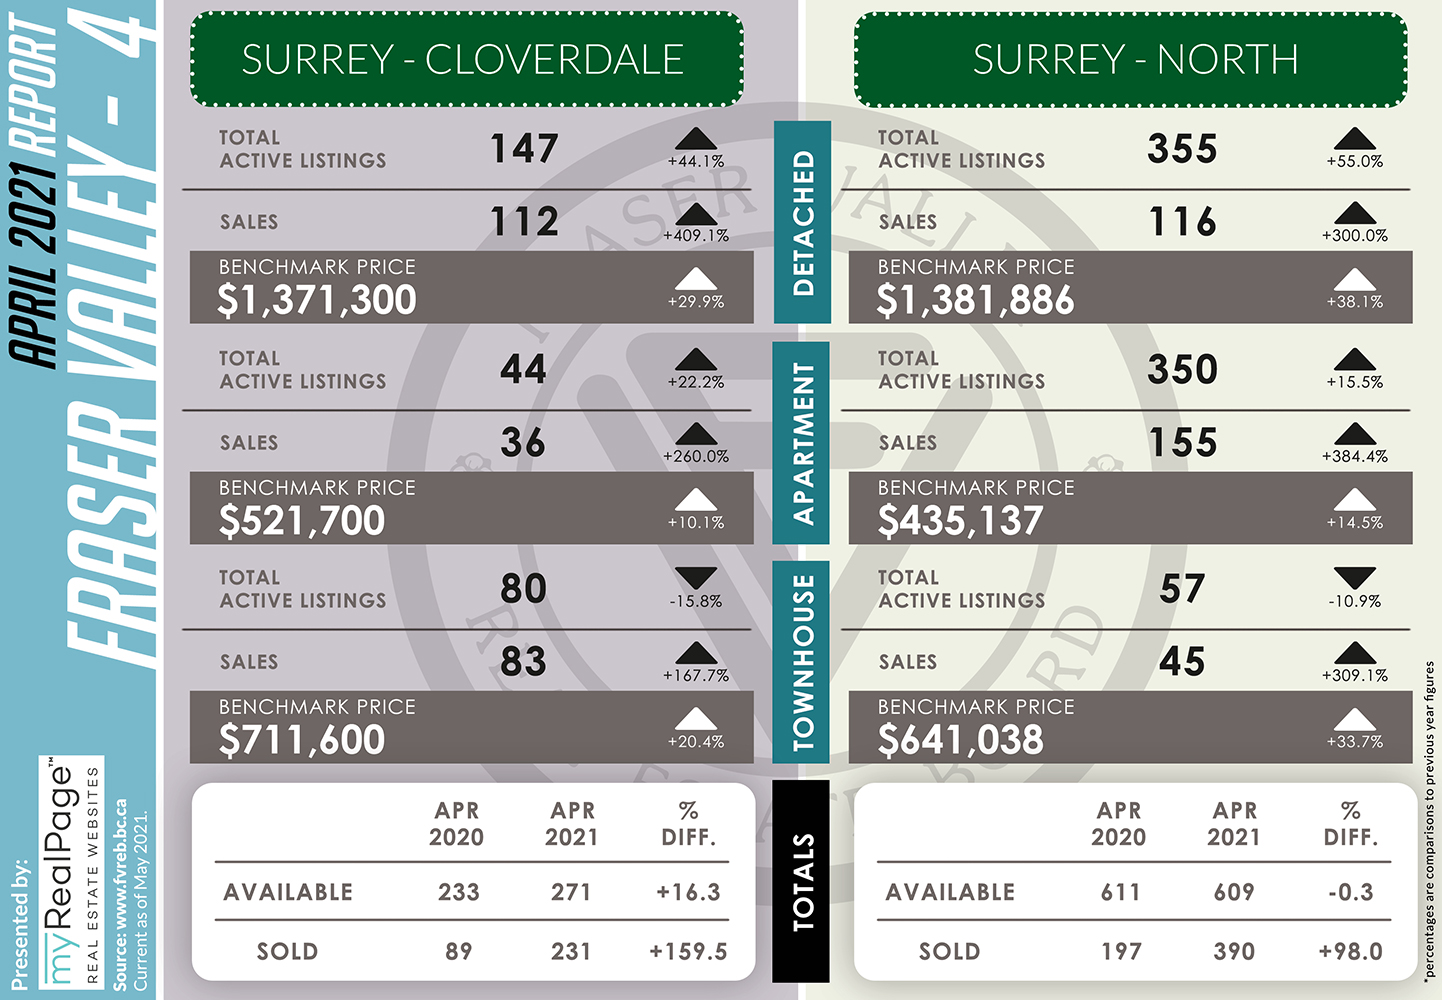
For the eighth consecutive month, Fraser Valley real estate saw record-breaking sales with April topping the previous monthly high set in 2016. The 2020/2021 pandemic seller’s market in the Fraser Valley has now surpassed the previous longest stretch of seven consecutive, record-breaking months, last set in 2015/2016.
In April, the Fraser Valley Real Estate Board (FVREB) processed 3,016 sales on its Multiple Listing Service® (MLS®), an increase of 338% compared to April 2020 and a 9% decrease compared to March. (Note that sales and new listings in April 2020 were significantly restricted due to the pandemic lockdown.) The previous record high for sales in April was 2,969 in 2016.
Read the full report on the FVREB website!
The following data is a comparison between April 2020 and April 2021 numbers, and is current as of May 2021. For last month’s report, check out our previous infographic!
Or follow this link for all our FVREB Infographics!
These infographics cover current trends in Fraser Valley neighbourhoods that are within the FVREB. Click on the images for a larger view! (Protip: Make sure to grab the printable PDF version, too! It fits best when printed on A4-sized sheets, AND we’ve added an area on the sheet where you can attach your business card! 🙂 )
Download Printable Version – FVREB April 2021 Market Report

-
- (from FVREB Twitter)

-

- (from FVREB Twitter)

Last Updated on July 25, 2022 by myRealPage
