INFOGRAPHICS: March 2021 FVREB Fraser Valley, South Surrey, Etc. Market Reports

March shatters monthly sales and new listings records in the Fraser Valley
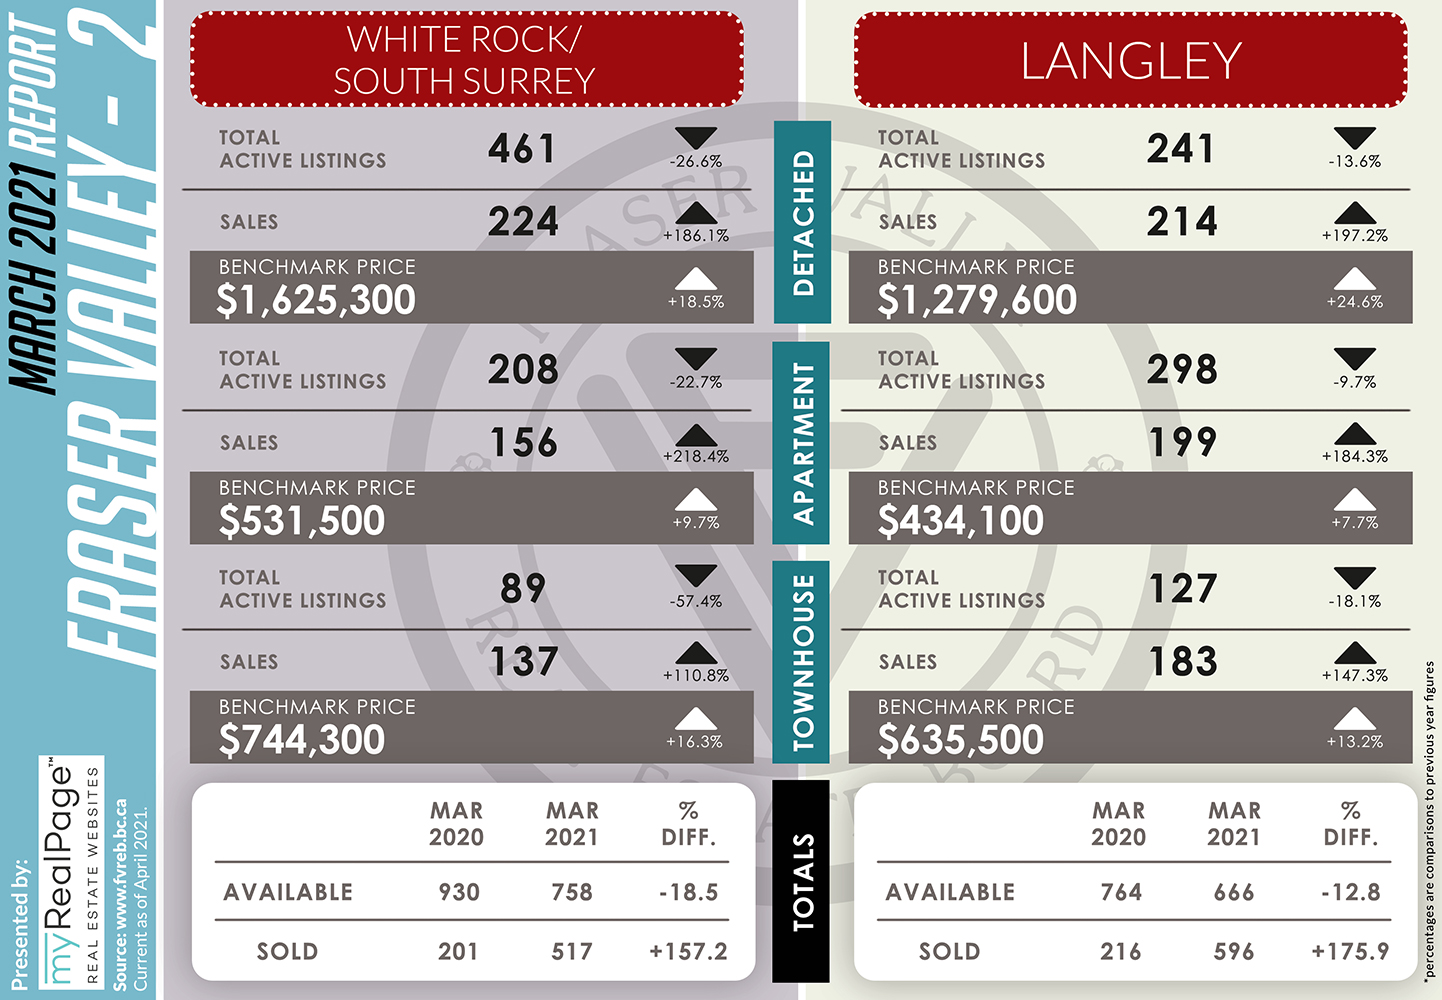
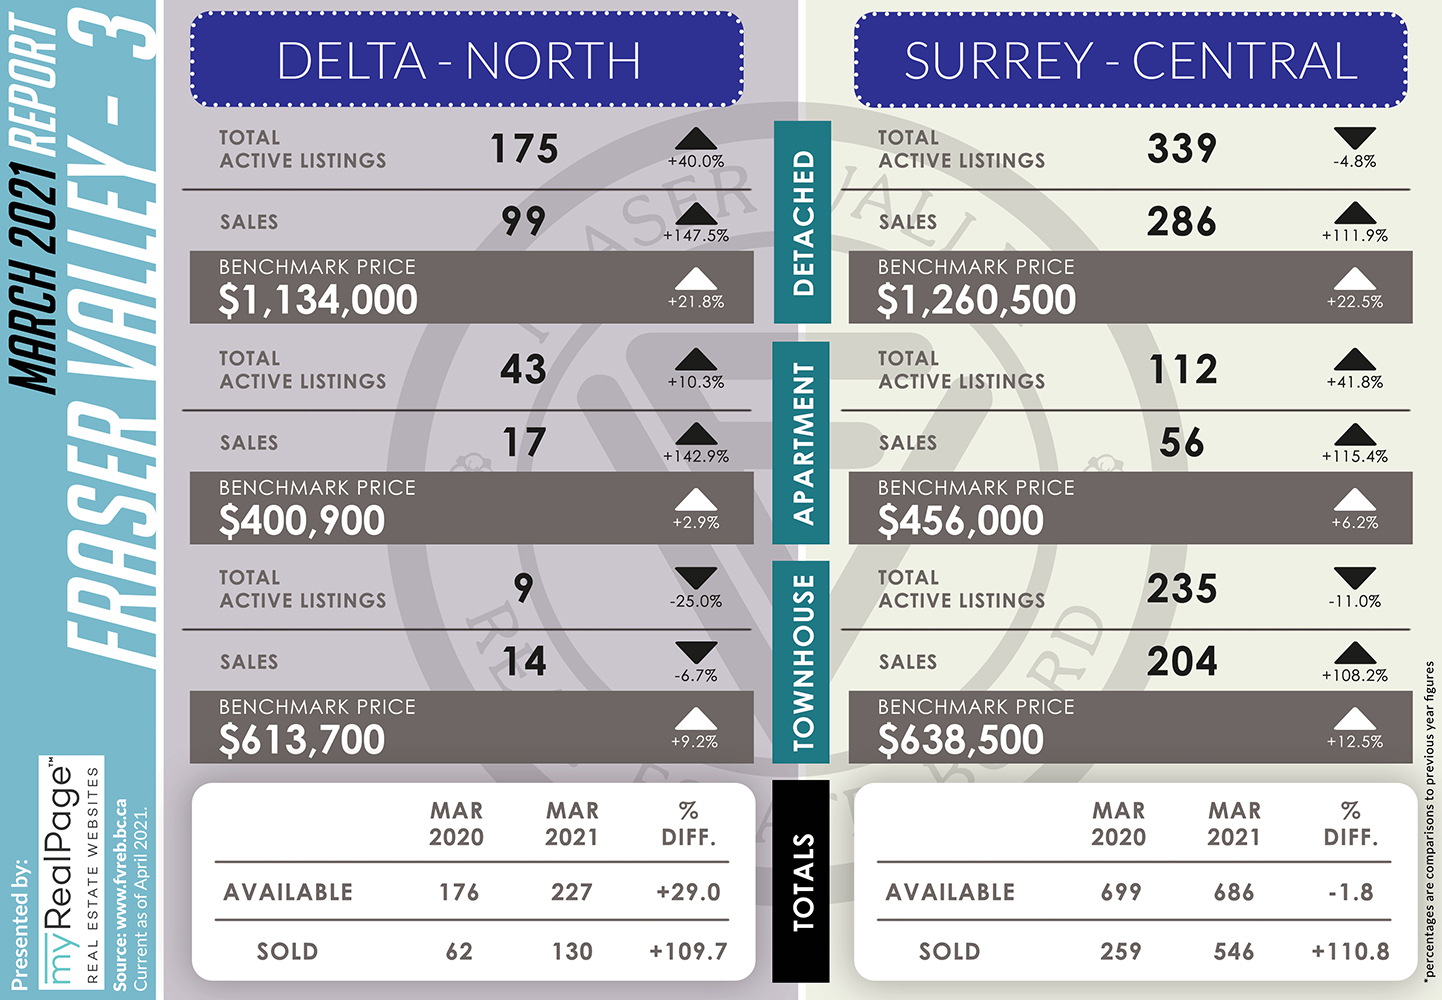
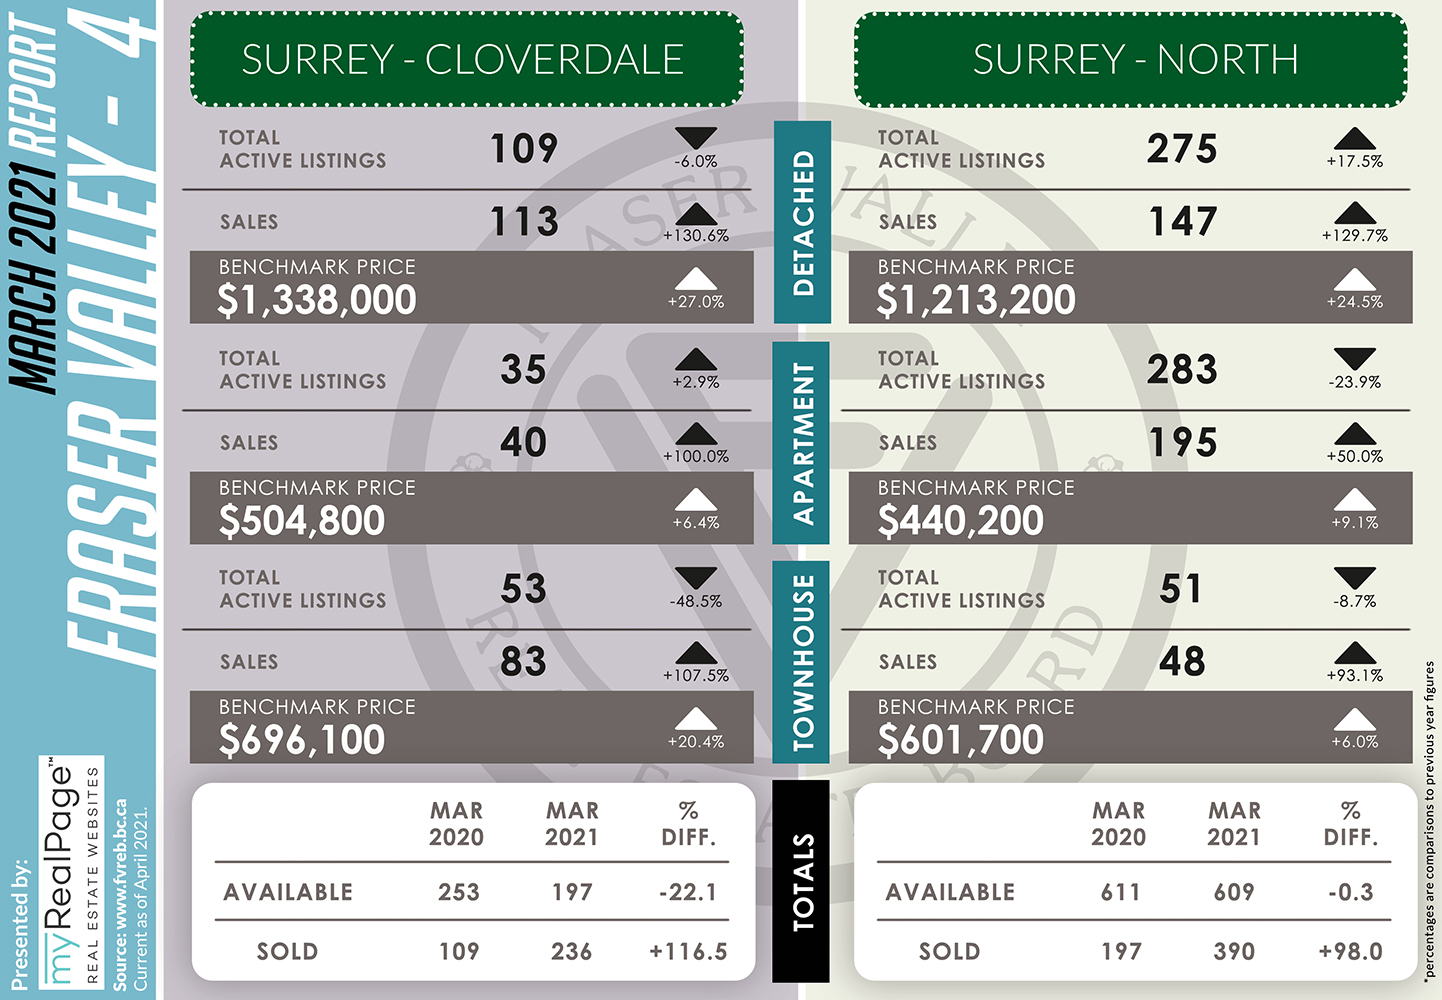
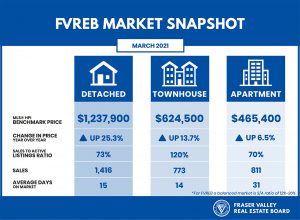
Fraser Valley real estate hit two historical highs in March, setting records for both sales and new listings processed in one month since the Fraser Valley Real Estate Board’s (FVREB) inception in 1921.
In March, the FVREB processed 3,329 residential and commercial sales on its Multiple Listing Service® (MLS®), an increase of 131% compared to March 2020 and 18% more than were processed in February. The previous record of 3,006 sales was set in March of 2016.
Larry Anderson, President of the Board, said of this month’s statistics, “This market is uncharted territory for Fraser Valley real estate. The surprising strength of the economy, the influence of the pandemic and a lack of inventory of all property types has created unprecedented demand for housing in our region.
Read the full report on the FVREB website!
The following data is a comparison between March 2020 and March 2021 numbers, and is current as of April 2021. For last month’s report, check out our previous infographic!
Or follow this link for all our FVREB Infographics!
These infographics cover current trends in Fraser Valley neighbourhoods that are within the FVREB. Click on the images for a larger view! (Protip: Make sure to grab the printable PDF version, too! It fits best when printed on A4-sized sheets, AND we’ve added an area on the sheet where you can attach your business card! 🙂 )
Download Printable Version – FVREB March 2021 Market Report

-
- (from FVREB Twitter)

Last Updated on July 25, 2022 by myRealPage
