INFOGRAPHICS: February 2021 FVREB Fraser Valley, South Surrey, Etc. Market Reports

Another month, another record for property sales in the Fraser Valley
For the sixth consecutive month, Fraser Valley’s real estate market experienced property sales at levels never seen before in the 100-year history of the Fraser Valley Real Estate Board (FVREB).
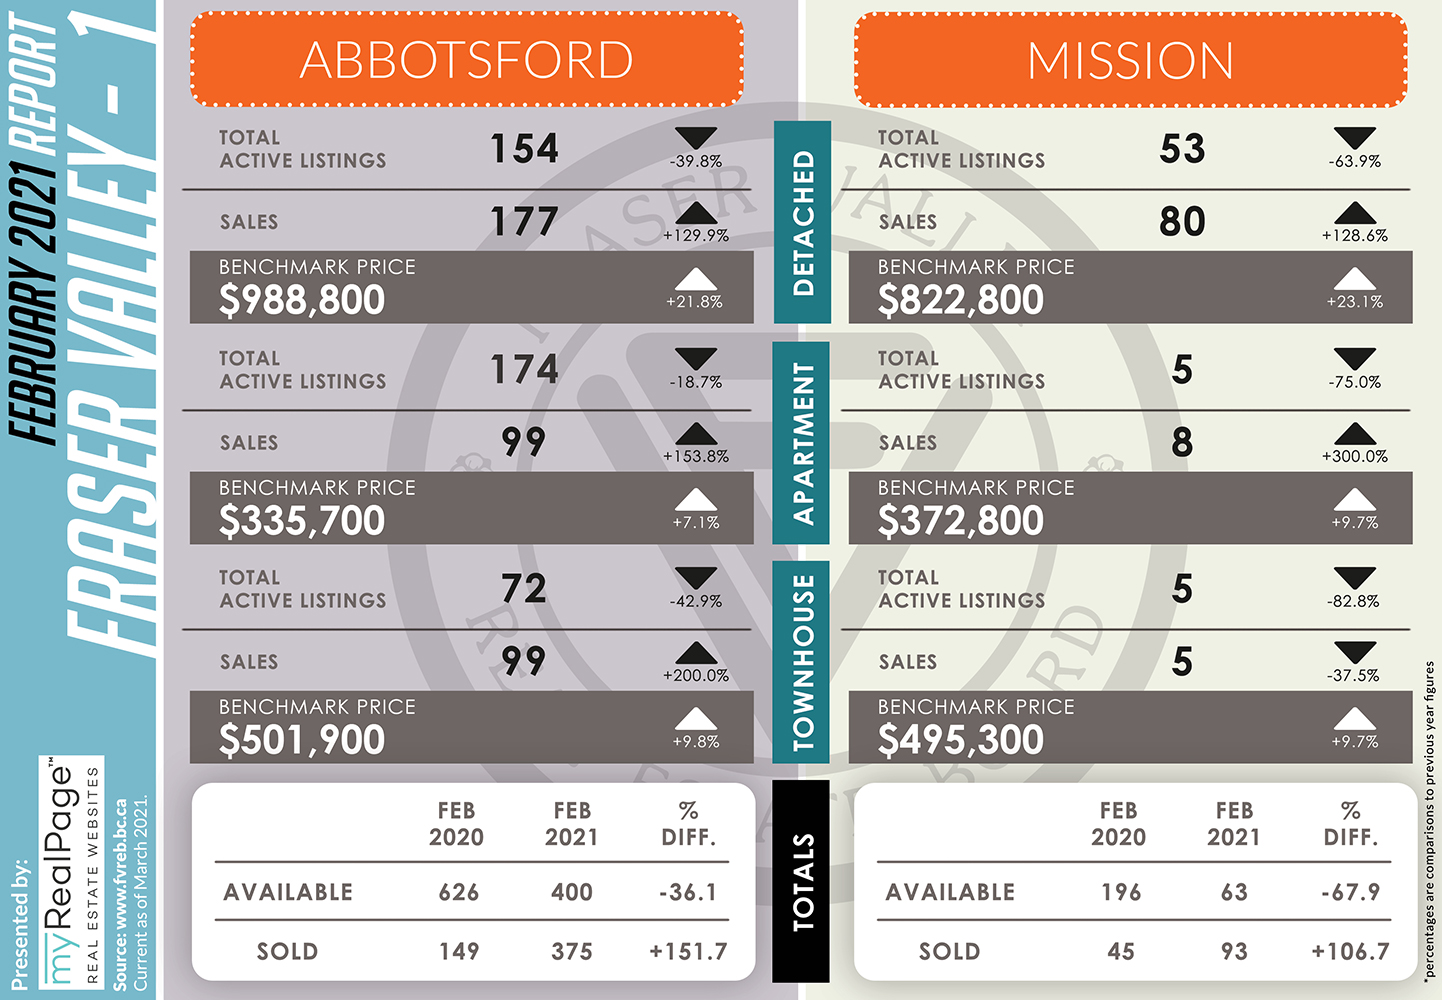
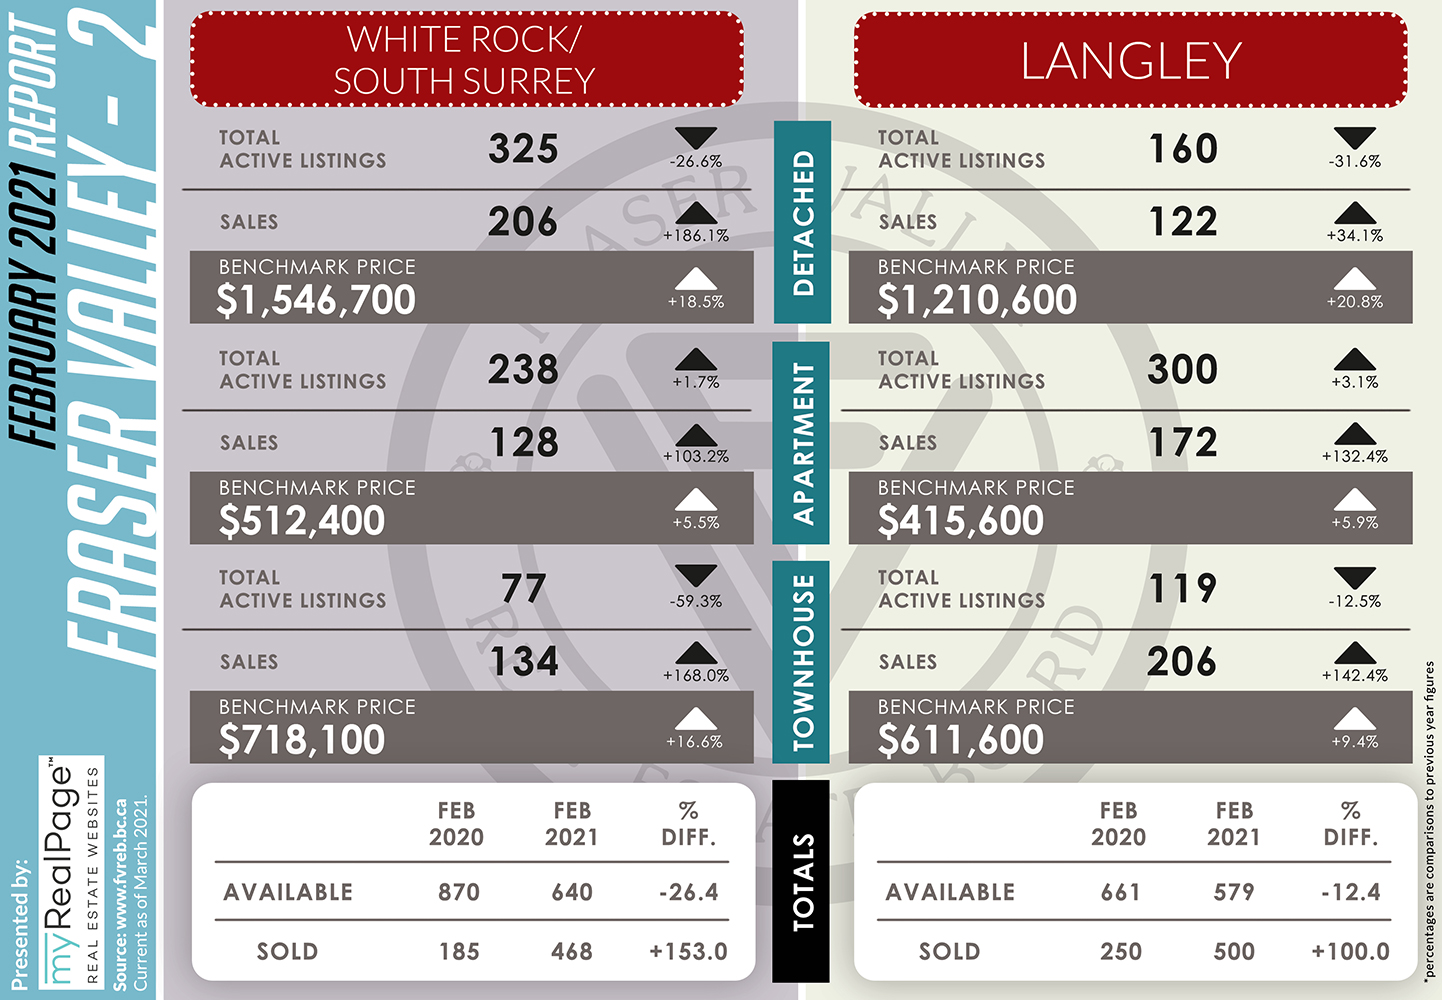
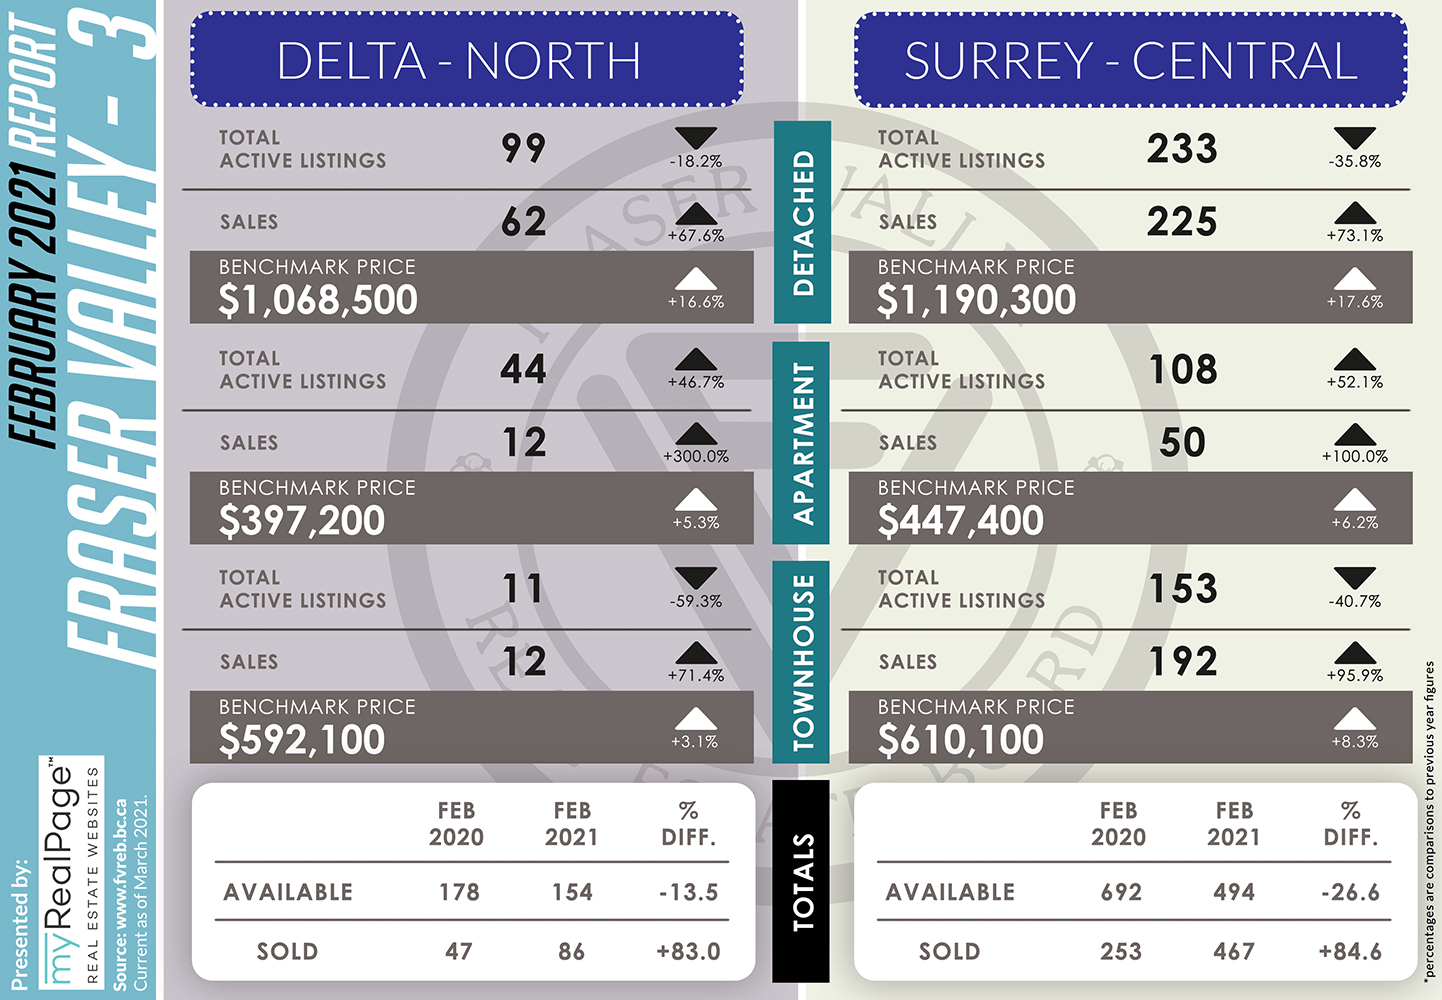
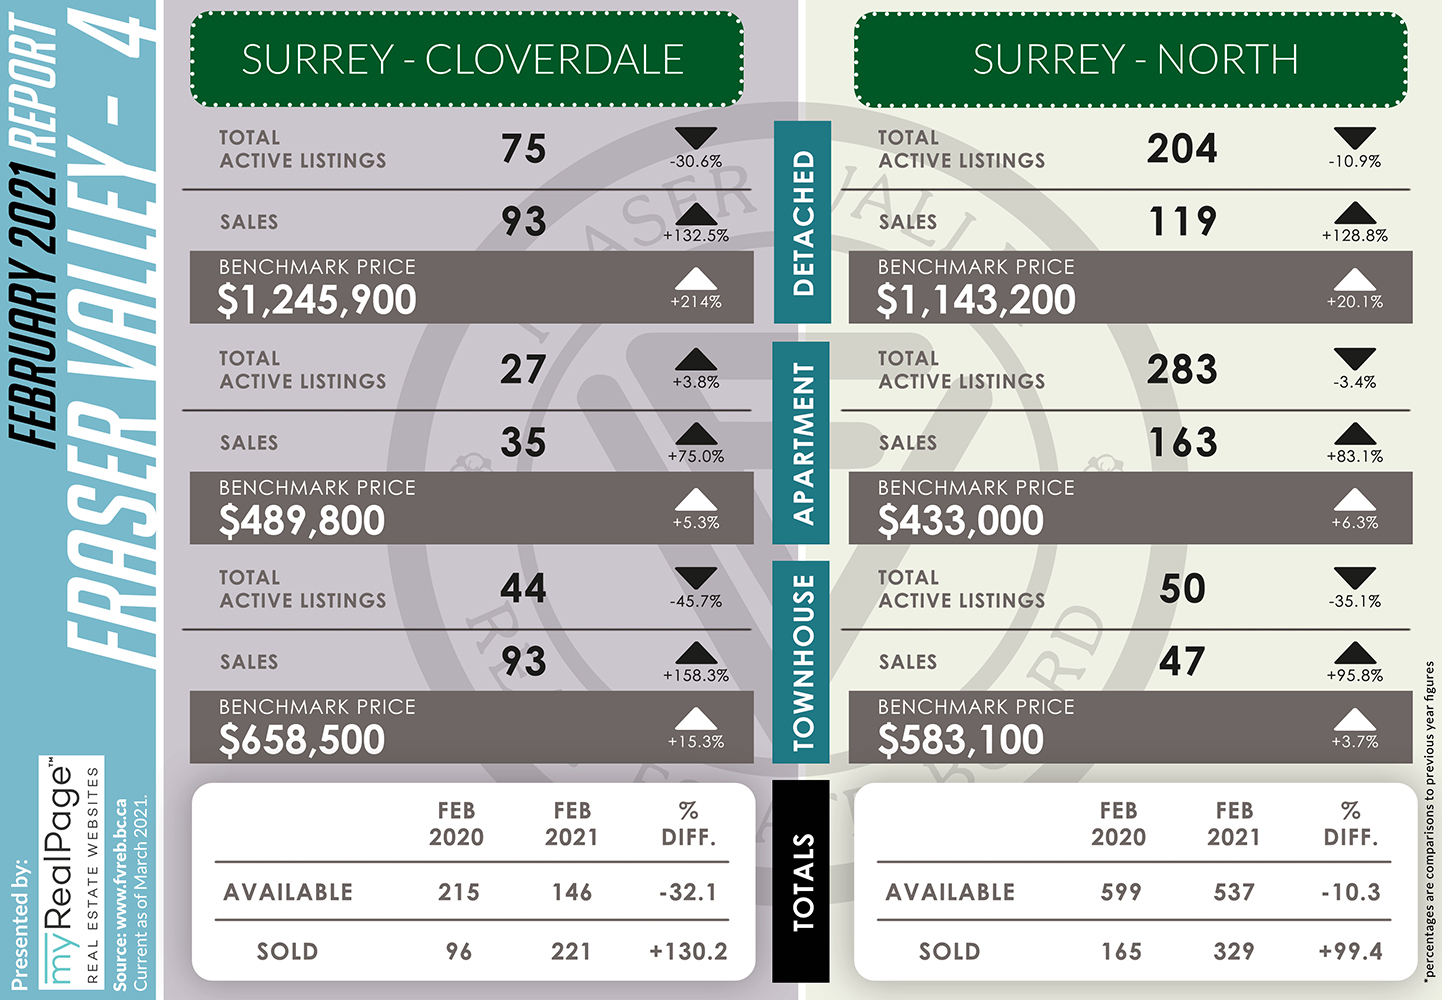
In February, the FVREB processed a total of 2,815 sales on its Multiple Listing Service® (MLS®), an increase of 108% compared to February 2020 and 64% more than were processed in January 2021. To provide a historical perspective, sales in February were 88% above the 10-year average for that month; and 18% higher than the previous record of 2,387 sales in February 2016.
Read the full report on the FVREB website!
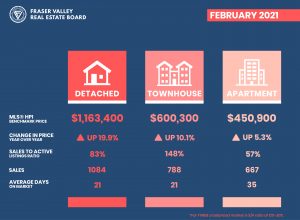
The following data is a comparison between February 2020 and February 2021 numbers, and is current as of March 2021. For last month’s report, check out our previous infographic!
Or follow this link for all our FVREB Infographics!
These infographics cover current trends in Fraser Valley neighbourhoods that are within the FVREB. Click on the images for a larger view! (Protip: Make sure to grab the printable PDF version, too! It fits best when printed on A4-sized sheets, AND we’ve added an area on the sheet where you can attach your business card! 🙂 )
Download Printable Version – FVREB February 2021 Market Report
-
- (from FVREB Twitter)

Last Updated on July 25, 2022 by myRealPage
