INFOGRAPHICS: April 2021 TRREB Toronto Market Reports

The Pace of GTA Home Sales Slows In April
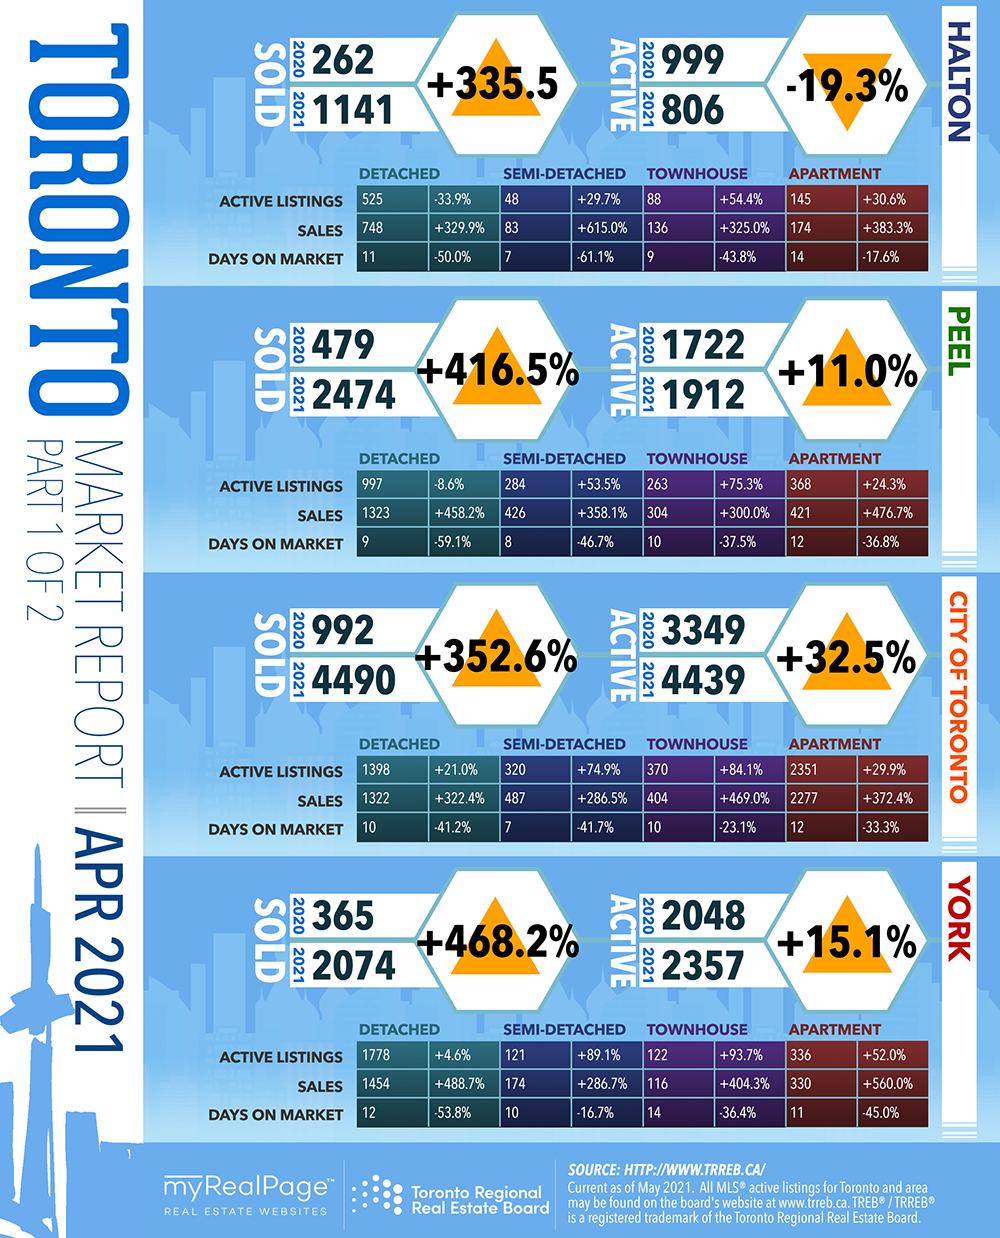
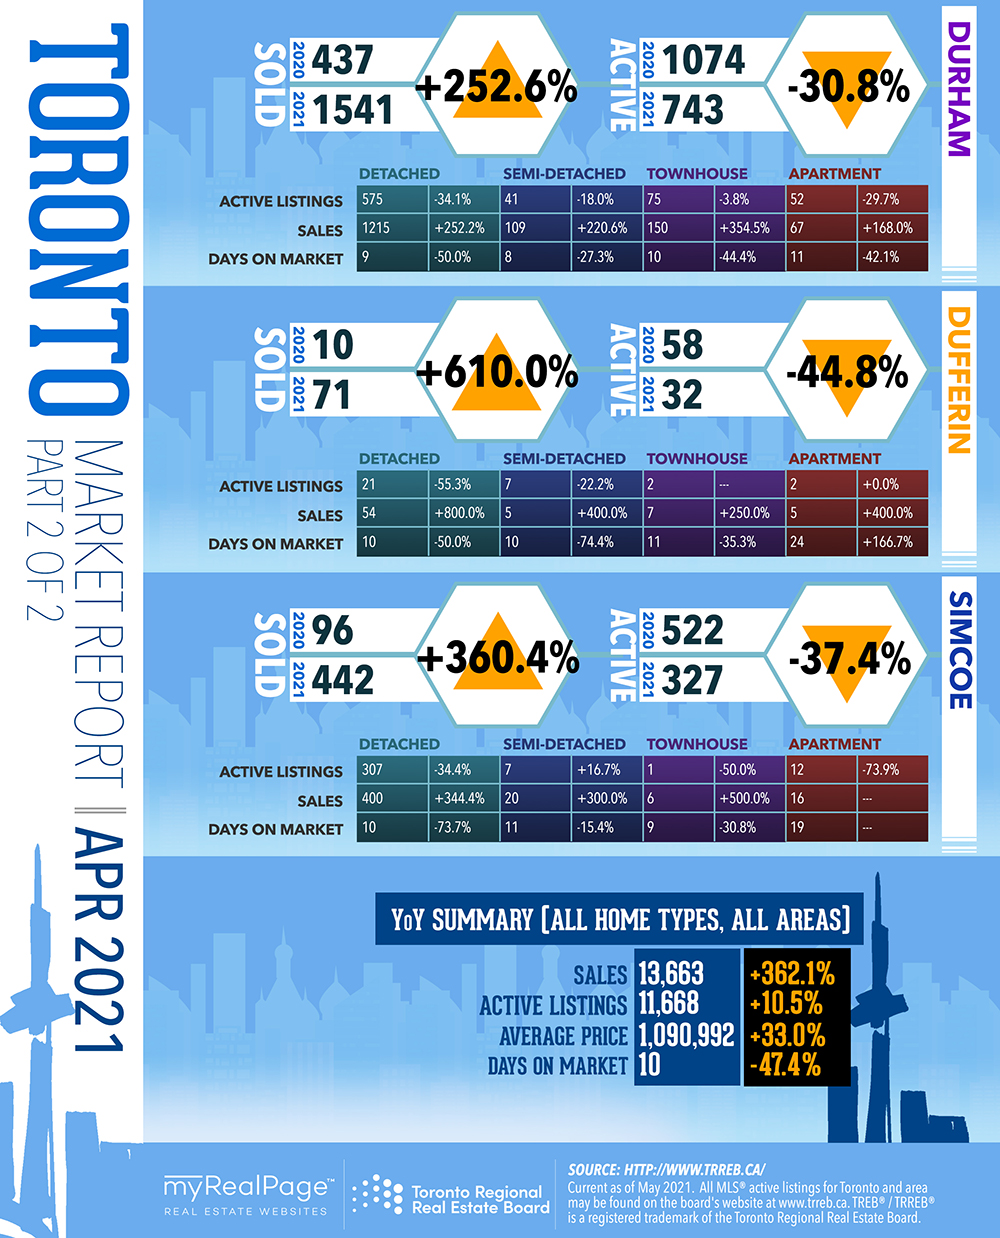
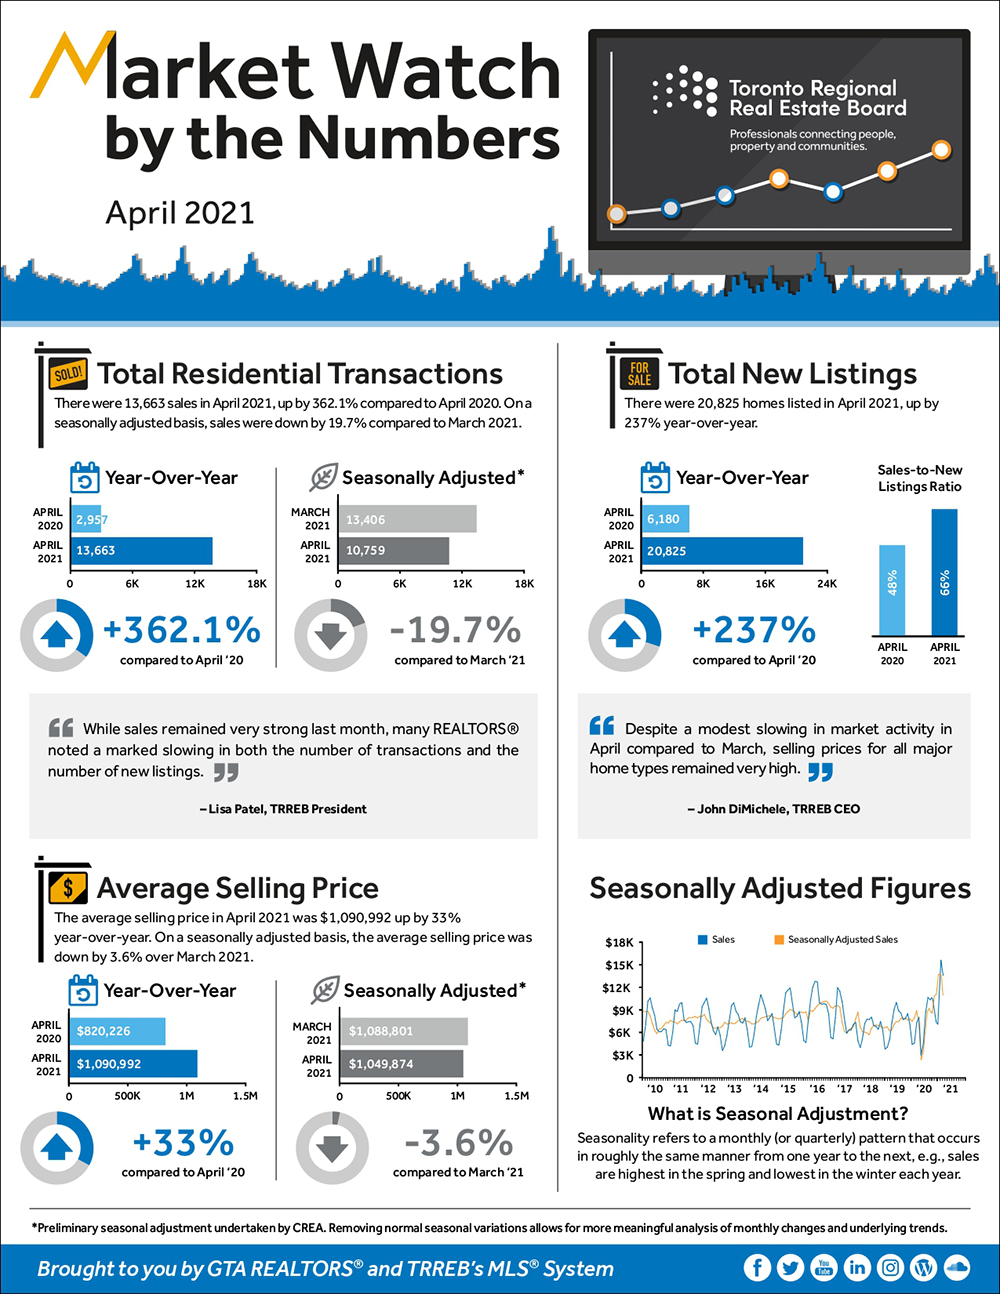
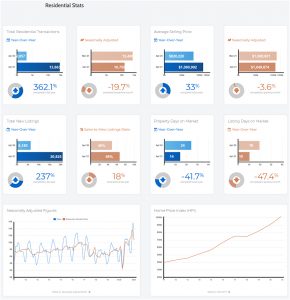
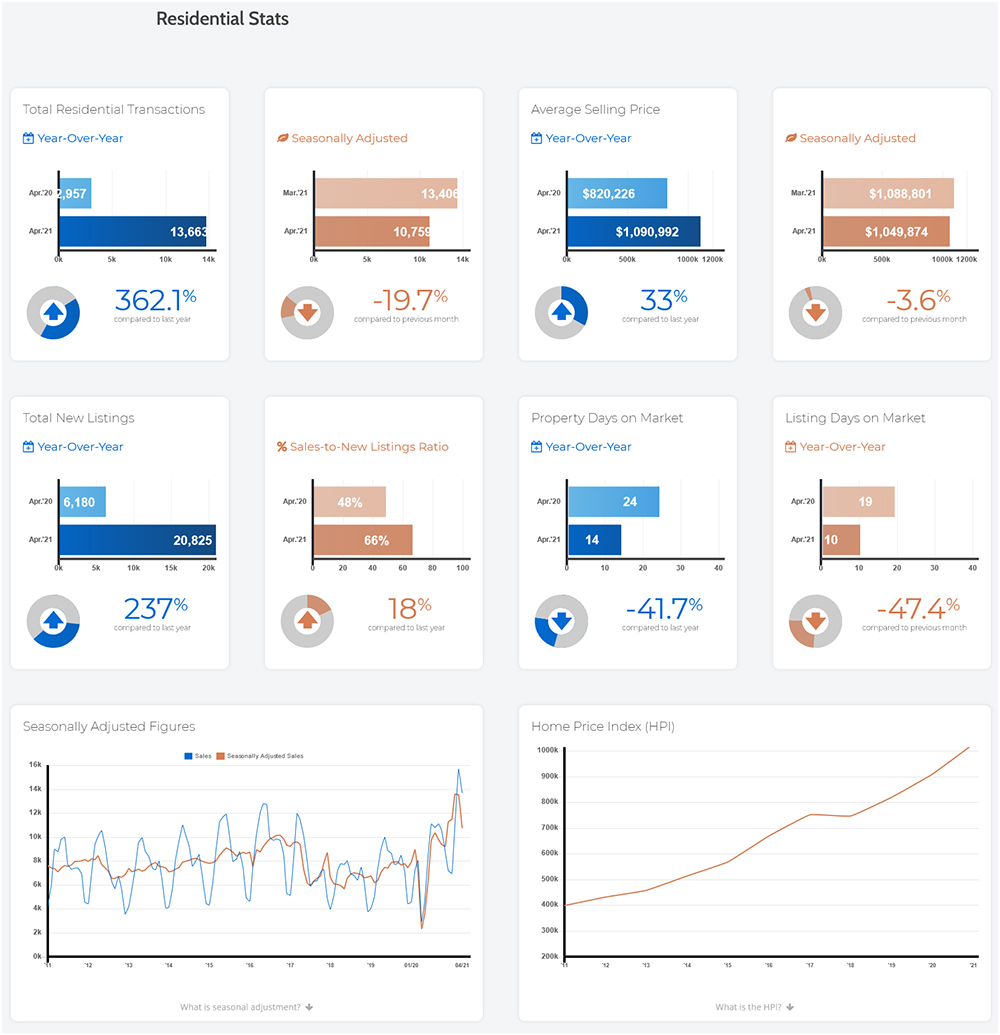
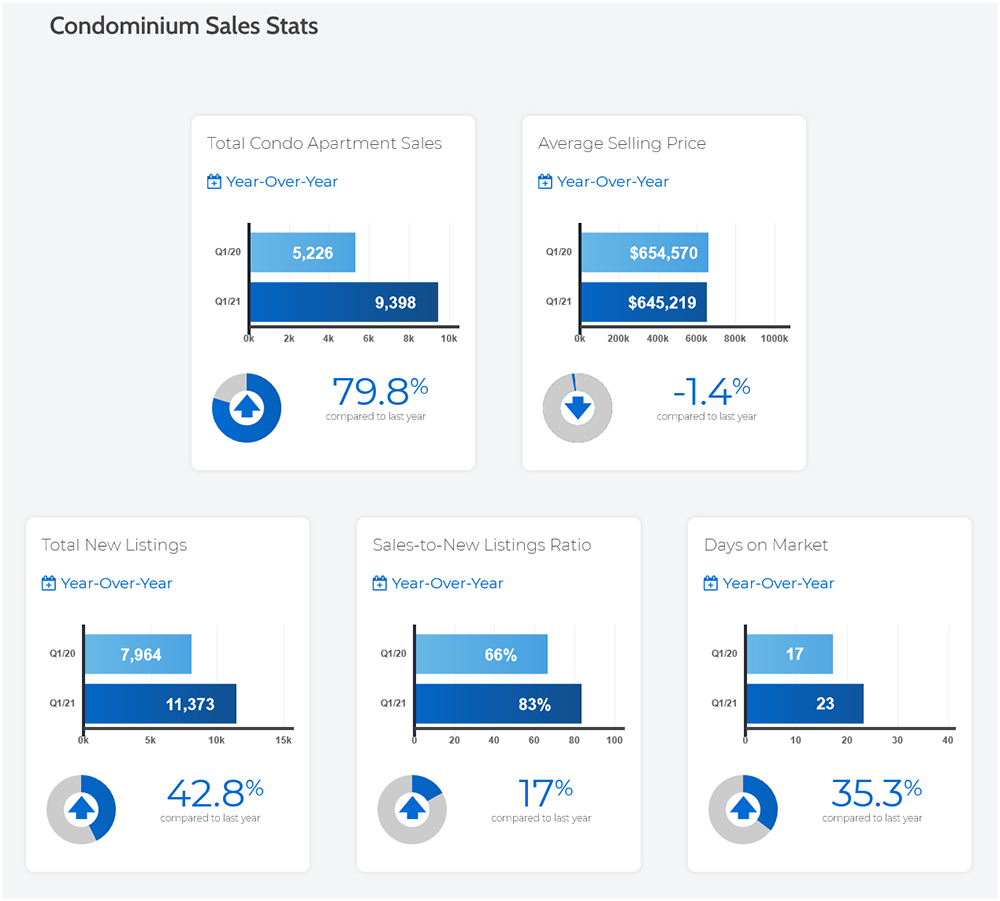
Home sales in the Greater Toronto Area (GTA) set a new record for April and amounted to more than quadruple that from April 2020 – the first full month of the pandemic. Bucking the regular seasonal trend, April 2021 sales actually declined month-over-month. A similar trend was noted for the number of new listings reported.
GTA REALTORS® reported 13,663 sales through TRREB’s MLS® System in April 2021 – a 12.7% decrease compared to March 2021, but more than quadruple the number of sales reported in April 2020, when the economic impact of COVID-19 was arguably the worst. Compared to the ten-year sales average of 10,000 for the April 2010 to April 2019 period, the April 2021 sales result was up by 36.6%.
Read the full report on the TRREB website!
The following data is a comparison between April 2020 and April 2021 numbers, and is current as of May 2021. For last month’s numbers, check out our previous infographic!
Or follow this link for all our TREB / TRREB Infographics!
Click on the images for a larger view! (Protip: Make sure to grab the printable PDF versions, too! It fits best when printed on A4-sized sheets, AND we’ve added an area on the sheet where you can attach your business card! 🙂 )
Download Printable Version – April 2021 TRREB, Toronto Market Report
-
- (from TRREB website)
-
- (from TRREB website)
-

- (from TRREB website)
-
- (from TRREB website)
-
- (from TRREB website)
Last Updated on July 25, 2022 by myRealPage
