INFOGRAPHICS: March 2021 TRREB Toronto Market Reports

Consumer Confidence And Low Interest Rates Drive Up Homes Sales In GTA
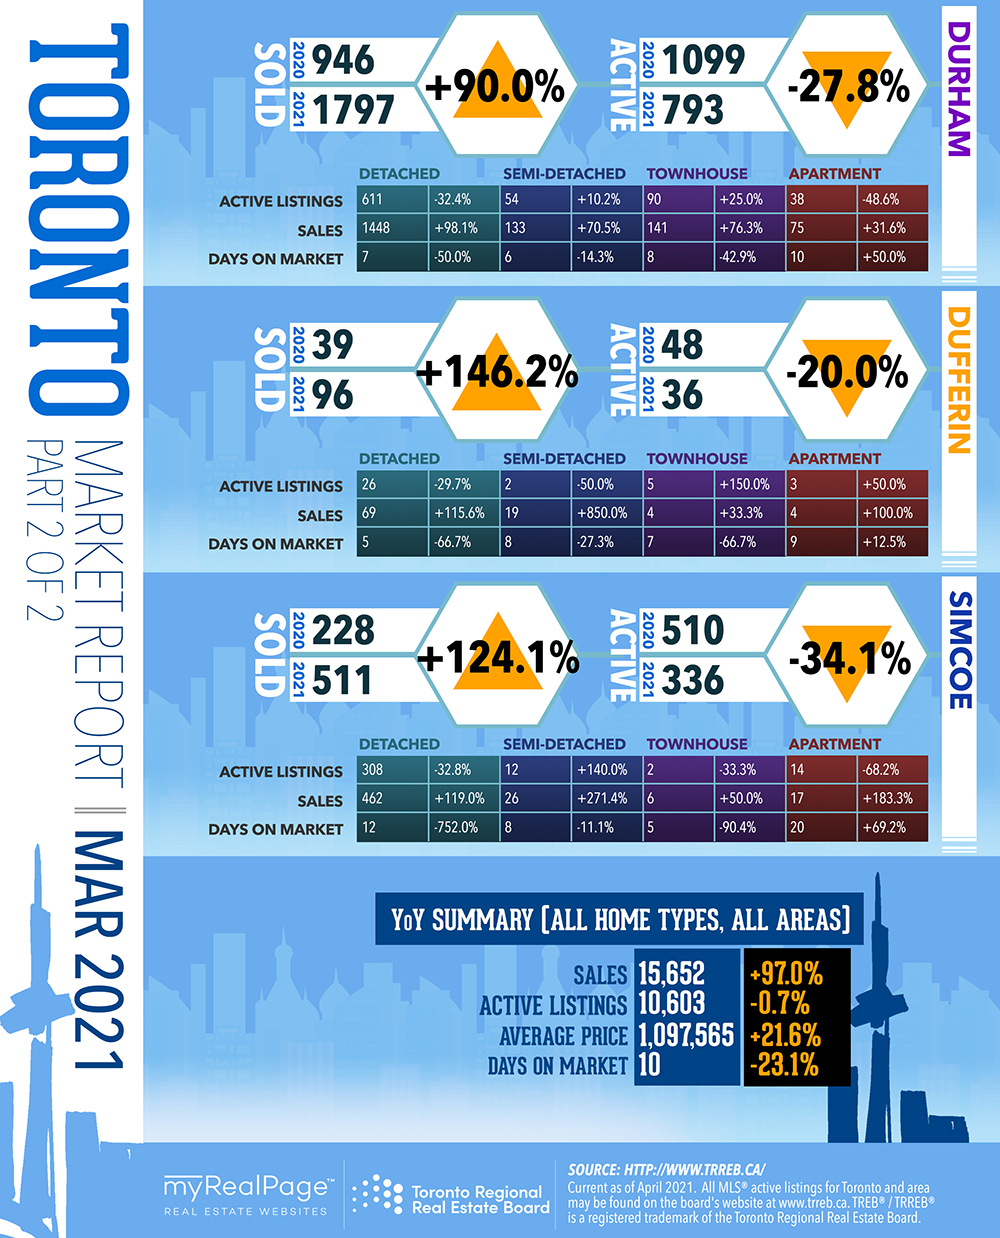
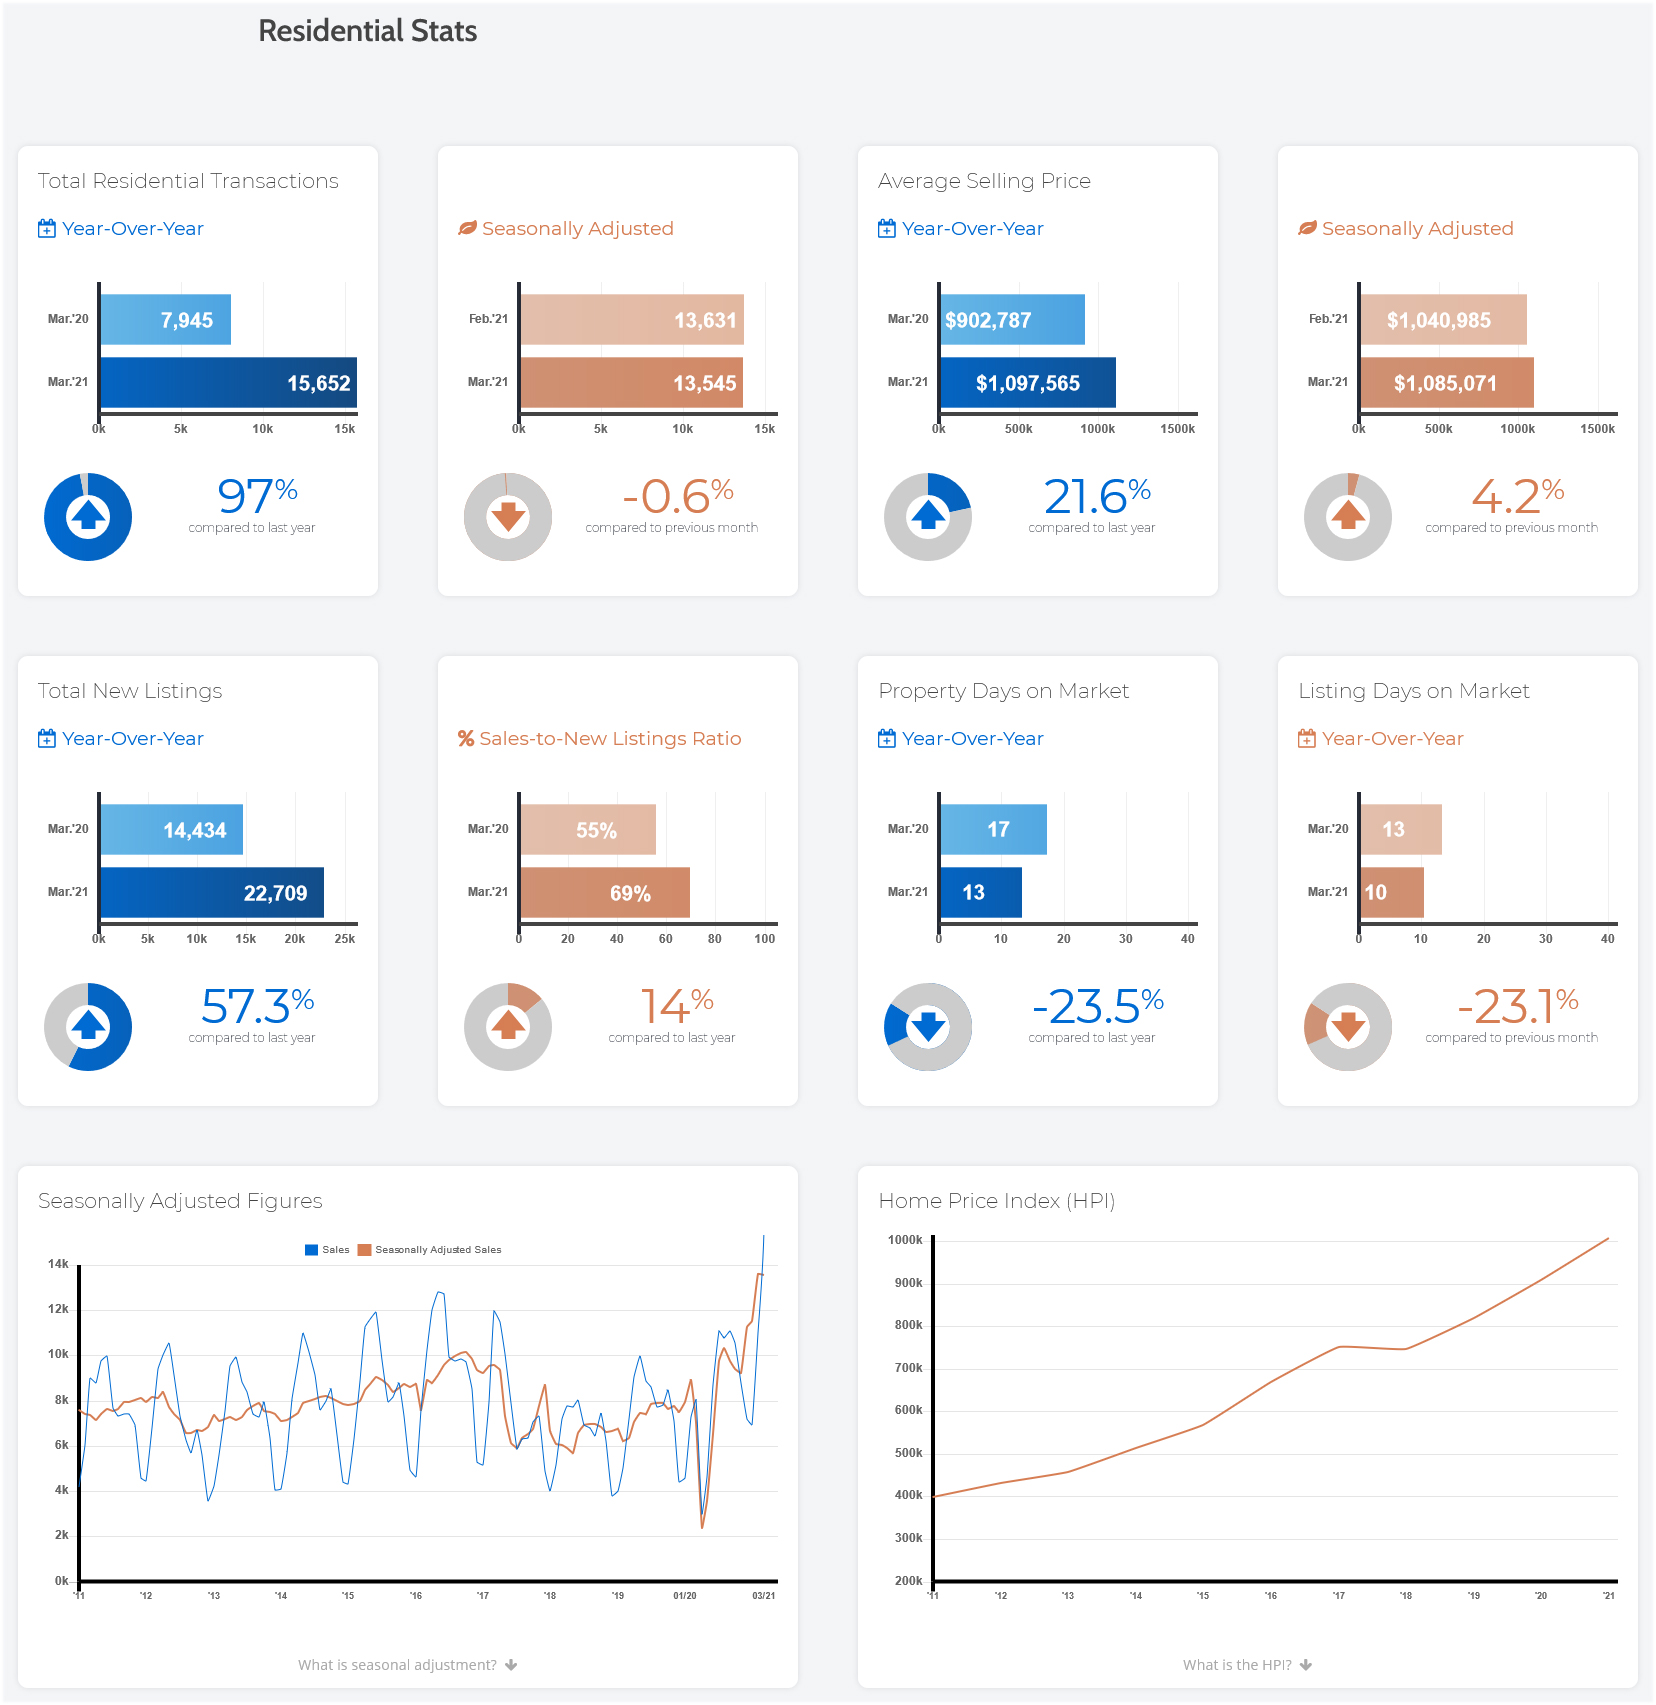
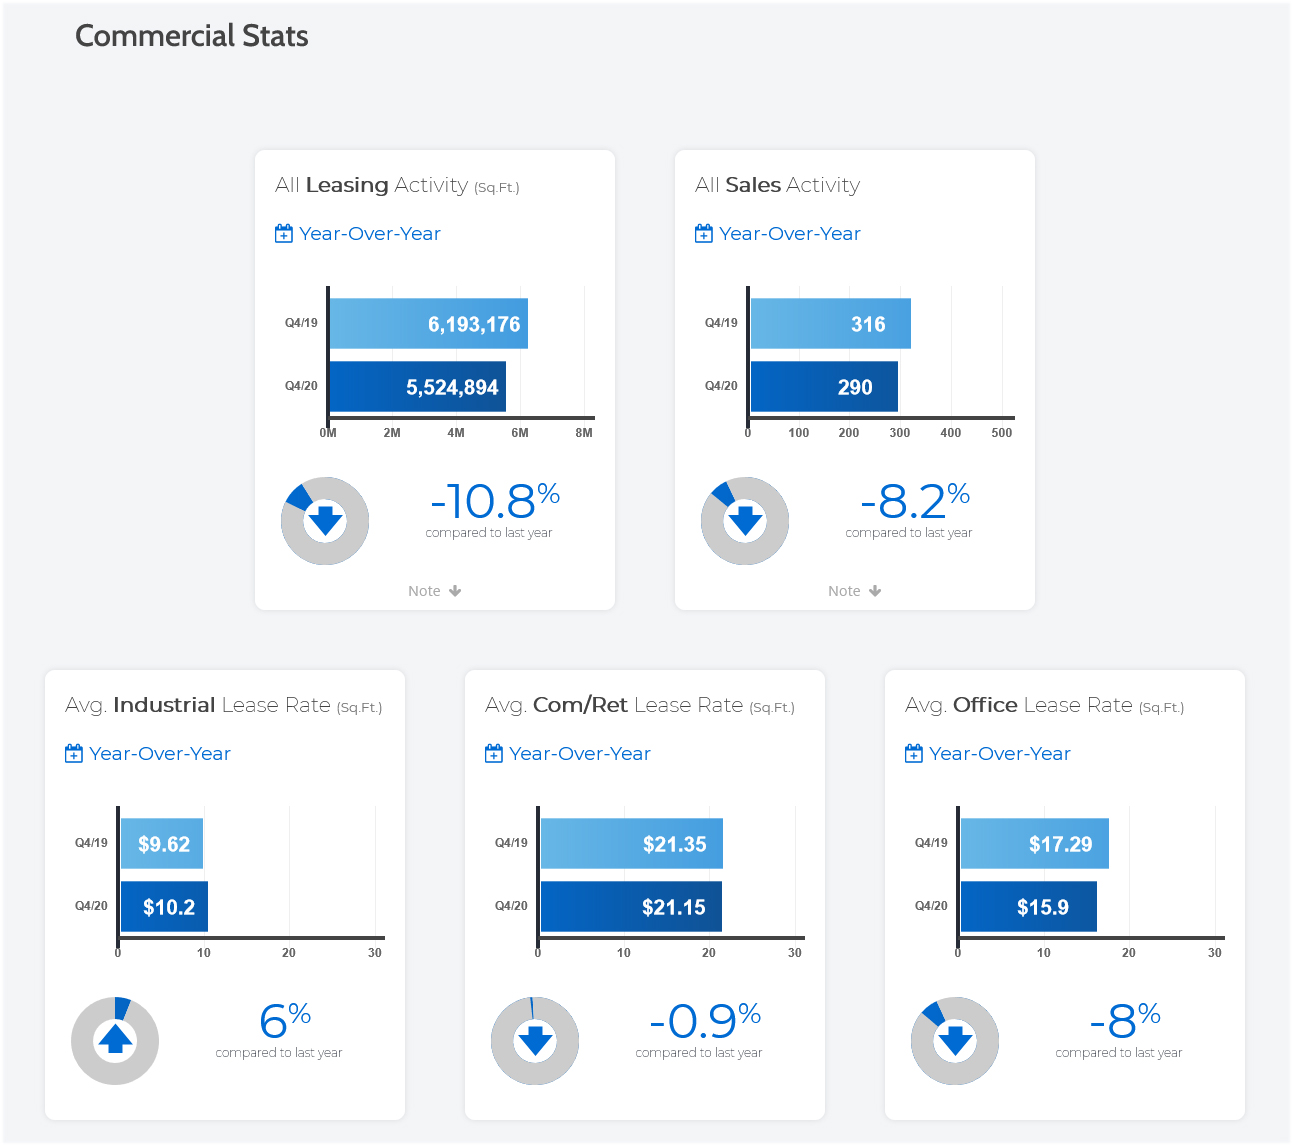
For the third straight month of 2021, record home sales continued in March across the Greater Toronto Area (GTA) with buyers taking advantage of favourable borrowing costs and continued improvement in many sectors of the economy.
GTA REALTORS® reported 15,652 sales in March 2021 – close to double that of March 2020. While sales were strong, it is important to remember that for the second half of March 2021, we are comparing against the initial impact of COVID-19 in the second half of March 2020 when sales activity dropped off dramatically. With this in mind, it is important to consider annual sales growth for the pre-COVID period (March 1 to 14, 2020) and the COVID period (March 15 to 31, 2020)
Read the full report on the TRREB website!
The following data is a comparison between March 2020 and March 2021 numbers, and is current as of April 2021. For last month’s numbers, check out our previous infographic!
Or follow this link for all our TREB / TRREB Infographics!
Click on the images for a larger view! (Protip: Make sure to grab the printable PDF versions, too! It fits best when printed on A4-sized sheets, AND we’ve added an area on the sheet where you can attach your business card! 🙂 )
Download Printable Version – March 2021 TRREB, Toronto Market Report

-
- (from TRREB website)

-

- (from TRREB website)
-
- (from TRREB website)
-
- (from TRREB website)

-
- (from TRREB website)
Last Updated on July 25, 2022 by myRealPage
