INFOGRAPHICS: February 2021 TRREB Toronto Market Reports
GTA Home And Condo Sales Reach New Heights For February
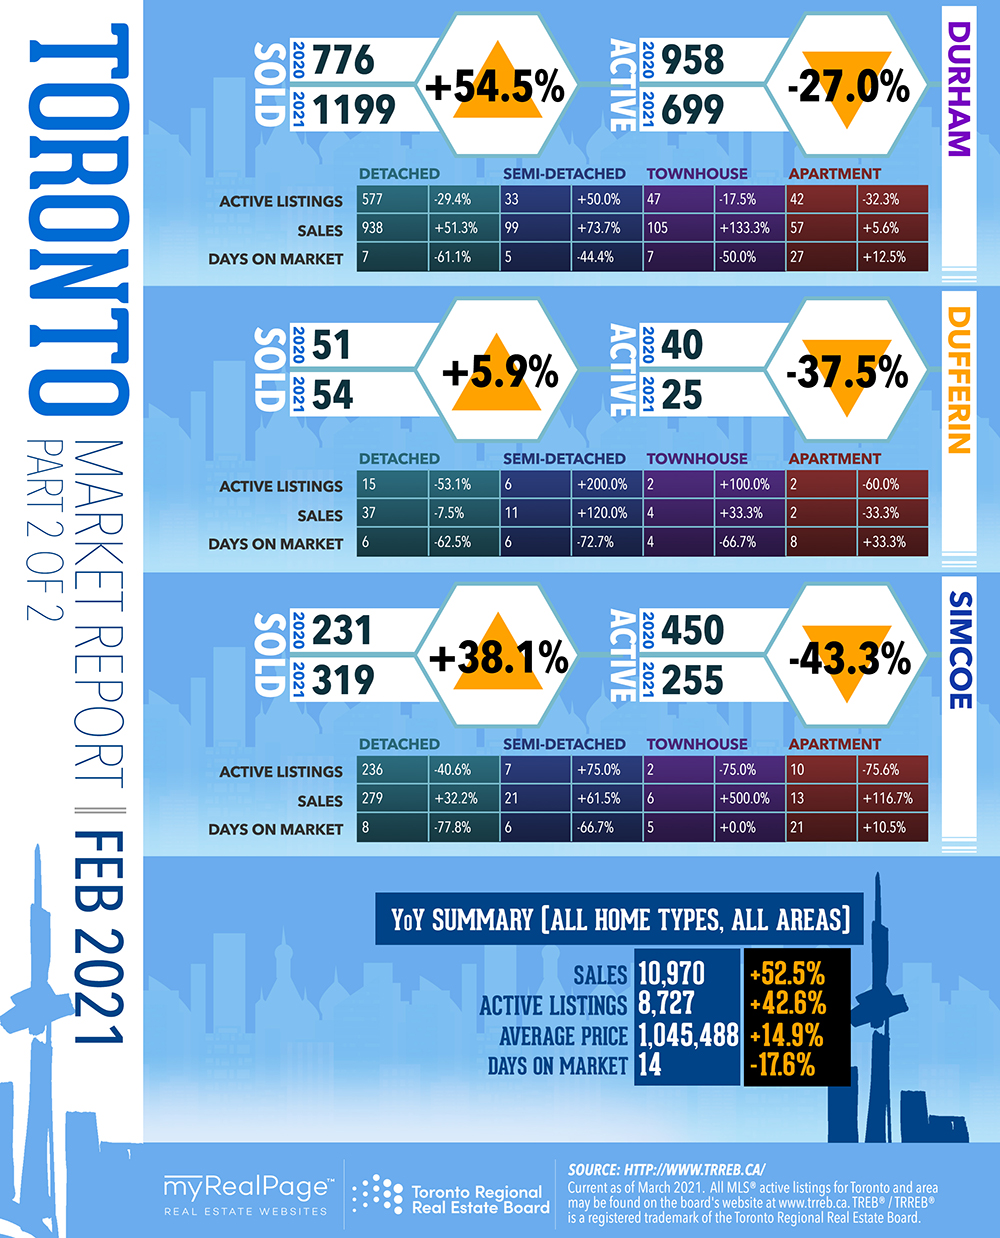
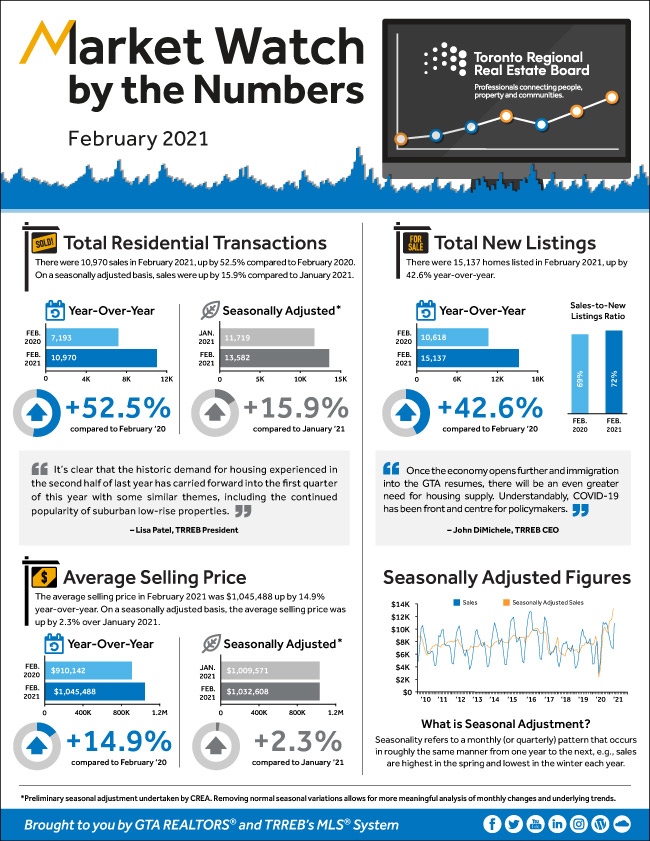
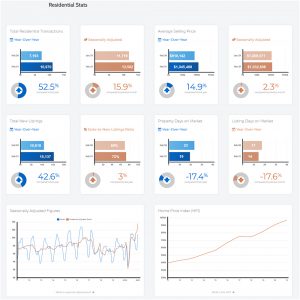
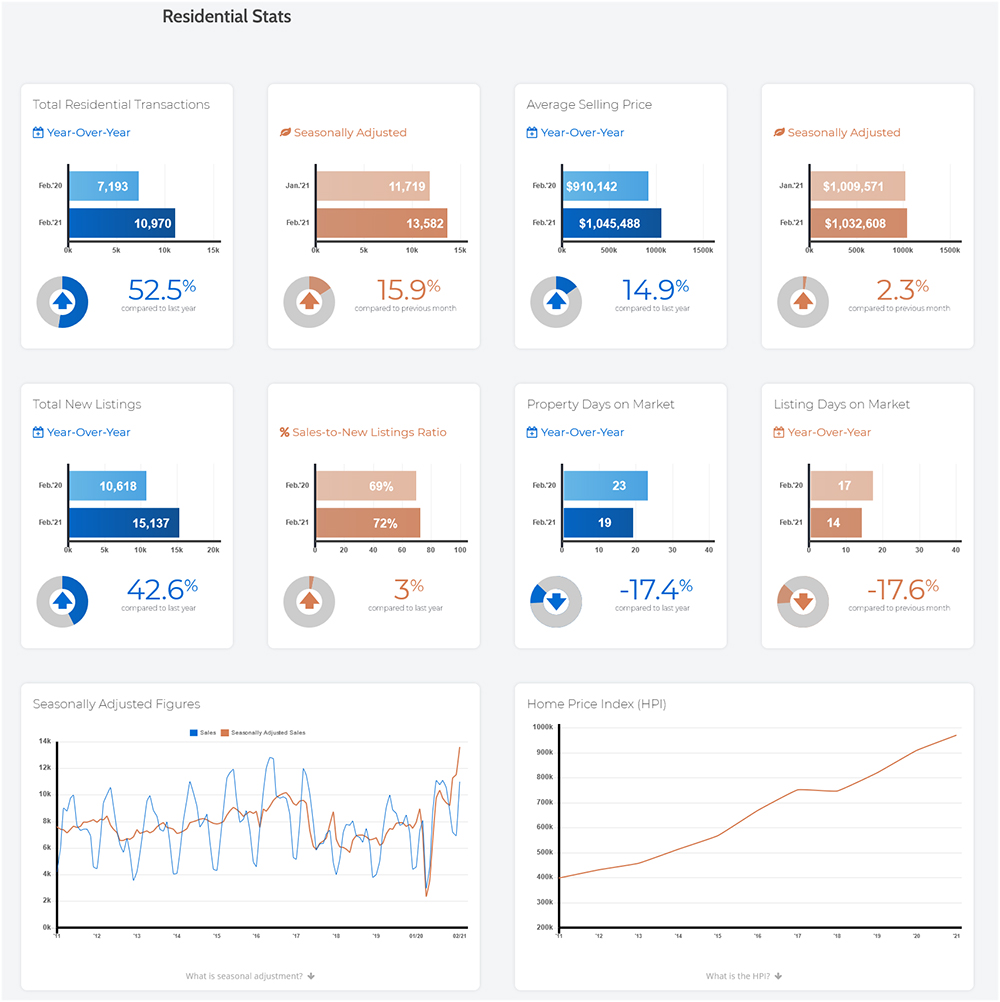
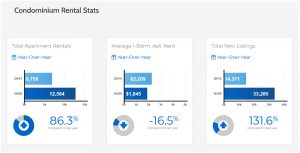
Record home sales in the Greater Toronto Area (GTA) continued in February as buyers remained confident in their employment situations and took advantage of ultra-low borrowing costs. With multiple buyers continuing to compete for many available listings, double-digit annual price growth was the norm throughout the GTA, with stronger rates of growth in the suburbs surrounding the City of Toronto.
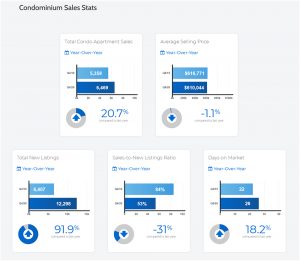
GTA REALTORS® reported 10,970 sales through TRREB’s MLS® System in February 2021 – a 52.5% increase compared to 7,193 sales reported in February 2020. Looking at all areas of the GTA combined, the condominium apartment segment led the way with a 64% sales increase compared to last year, with similar rates of increase in the ‘416’ and ‘905’ area codes.
Read the full report on the TRREB website!
The following data is a comparison between February 2020 and February 2021 numbers, and is current as of March 2021. For last month’s numbers, check out our previous infographic!
Or follow this link for all our TREB / TRREB Infographics!
Click on the images for a larger view! (Protip: Make sure to grab the printable PDF versions, too! It fits best when printed on A4-sized sheets, AND we’ve added an area on the sheet where you can attach your business card! 🙂 )
Download Printable Version – February 2021 TRREB, Toronto Market Report

-
- (from TRREB website)
-
- (from TRREB website)
-
- (from TRREB website)

-
- (from TRREB website)

-
- (from TRREB website)

Last Updated on July 25, 2022 by myRealPage
