INFOGRAPHICS: August 2018 REBGV Greater Vancouver Market Reports

Here are this month’s market updates for the areas covered by the Real Estate Board of Greater Vancouver (REBGV).
It’s looking like the REBGV housing market is still on a downswing, with reduced demand across all housing types.
According to REBGV’s latest media release, numbers are also showing that home buyer demand is still lingering below historical averages in the month of August.
Here’s what Board President Phil Moore has said about it:
“Home buyers have been less active in recent months and we’re beginning to see prices edge down for all housing types as a result. Buyers today have more listings to choose from and face less competition than we’ve seen in our market in recent years. With fewer buyers active in the market, benchmark prices across all three housing categories have declined for two consecutive months across the region.”
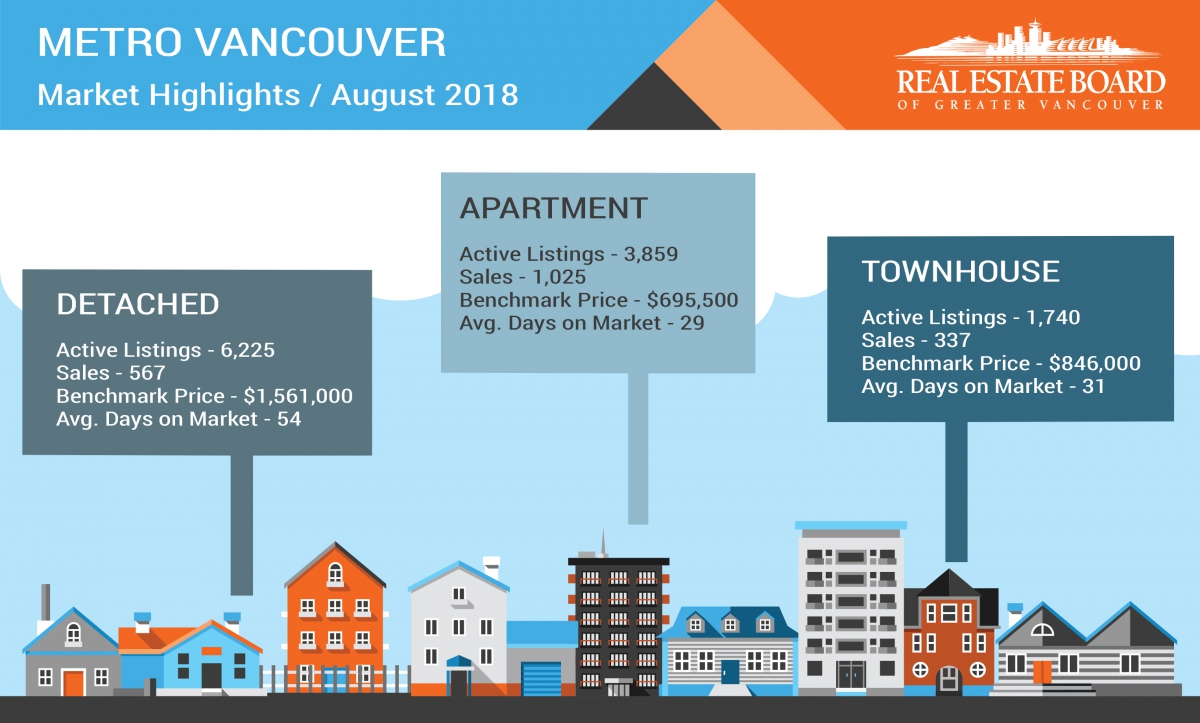
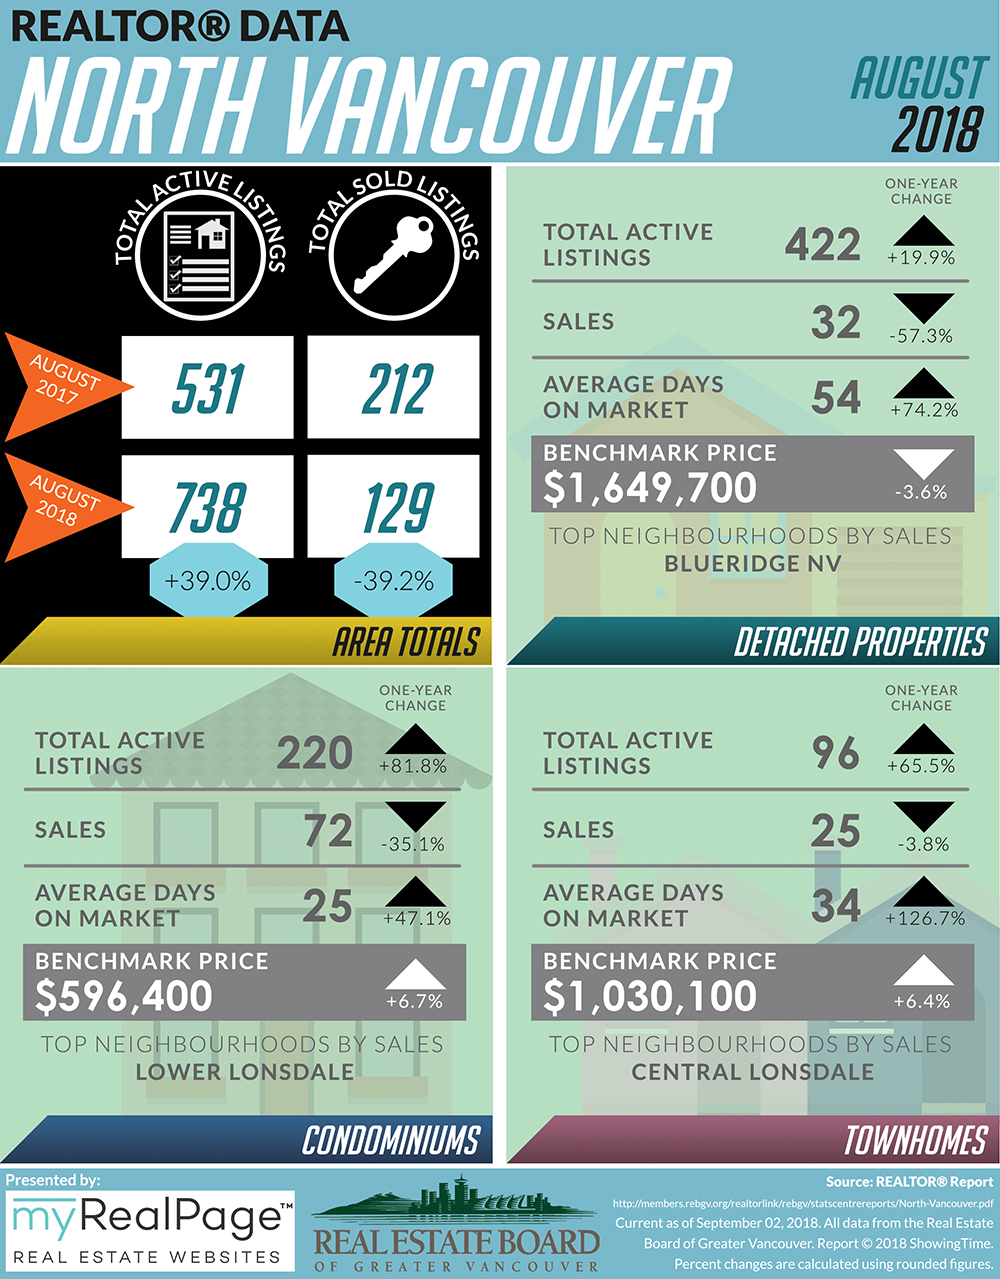
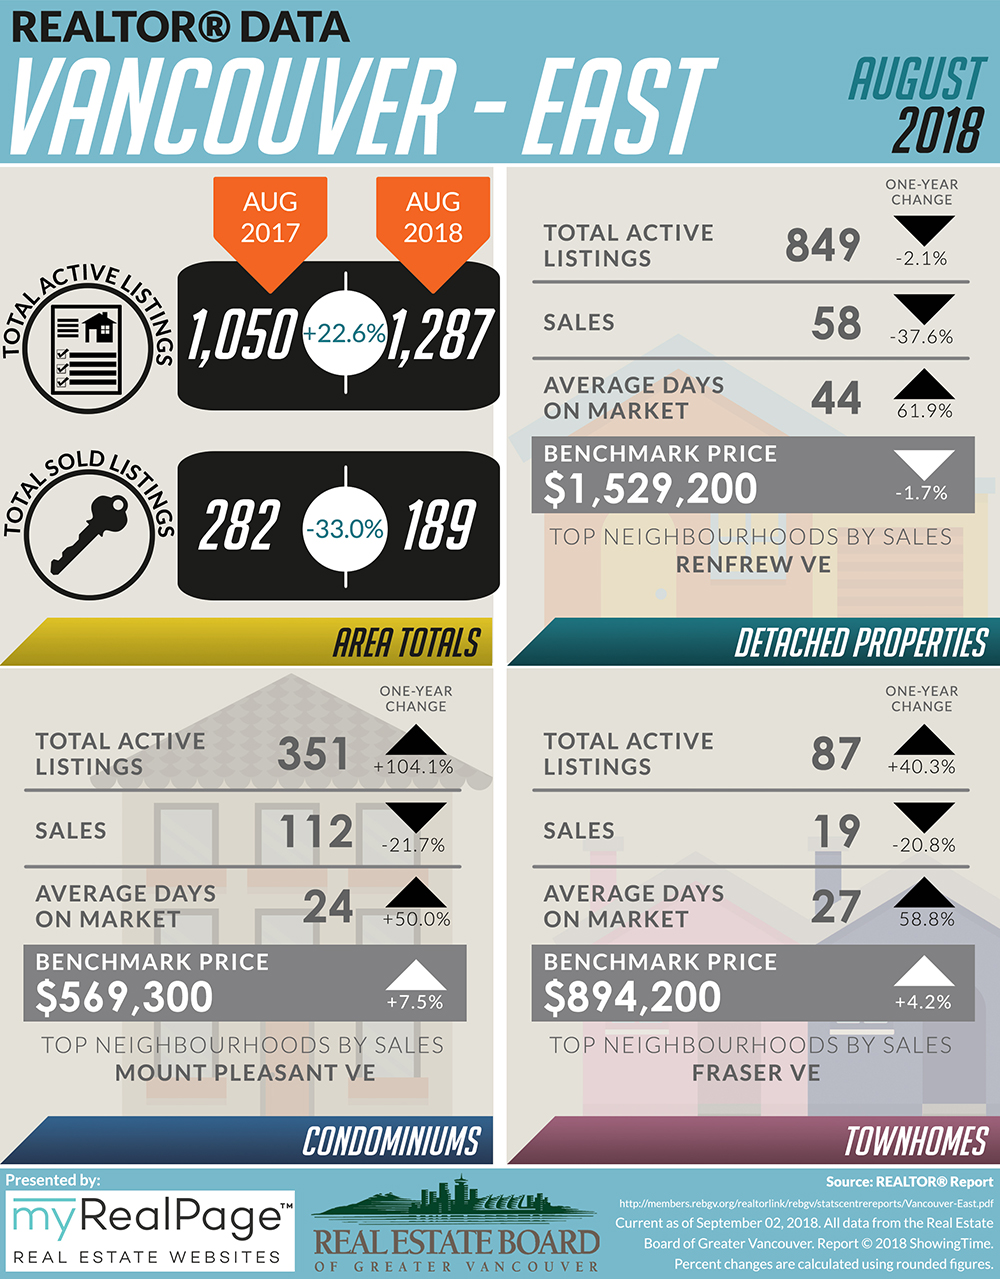
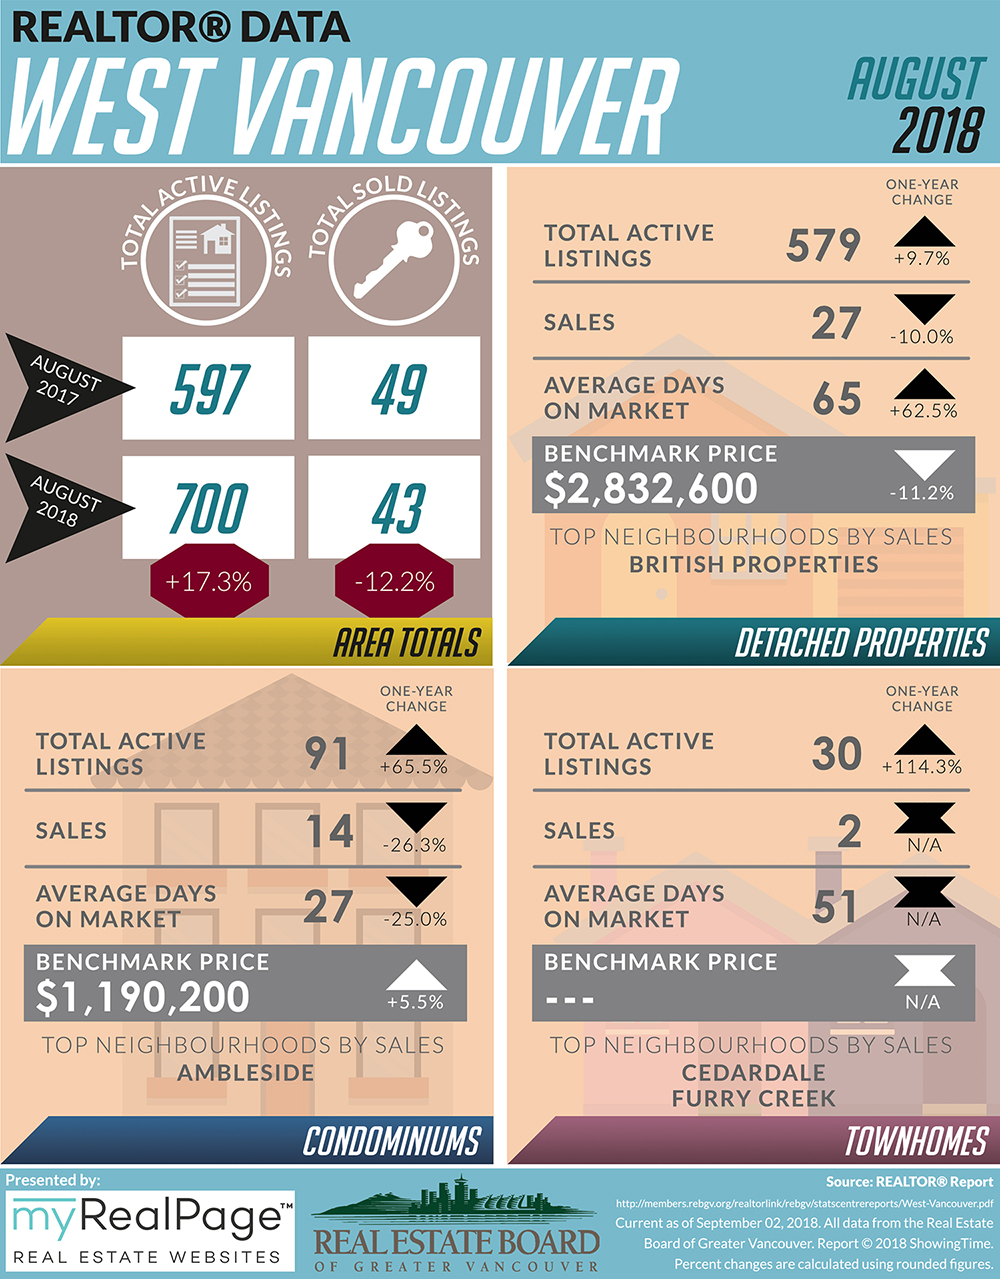
The following data is a comparison between August 2017 and August 2018 numbers, and is current as of September 2018. For last month’s update, you can check out our previous post for July 2018 data. Or follow this link for all our REBGV Infographics!
These infographics cover current trends in North Vancouver, West Vancouver, Vancouver East, and Vancouver West.
Click on the images for a larger view!
(Protip: Make sure to grab the printable PDF versions, too! It fits best when printed on A4-sized sheets, AND we’ve added an area on the sheet where you can attach your business card! 🙂 )
Download Printable Version – REBGV August 2018 Data Infographics

Last Updated on July 25, 2022 by myRealPage
