INFOGRAPHICS: July 2018 REBGV Greater Vancouver Market Reports
Looks like we’re opening summer with more news of slowness for the month of July within the markets covered by the Real Estate Board of Greater Vancouver, or REBGV.
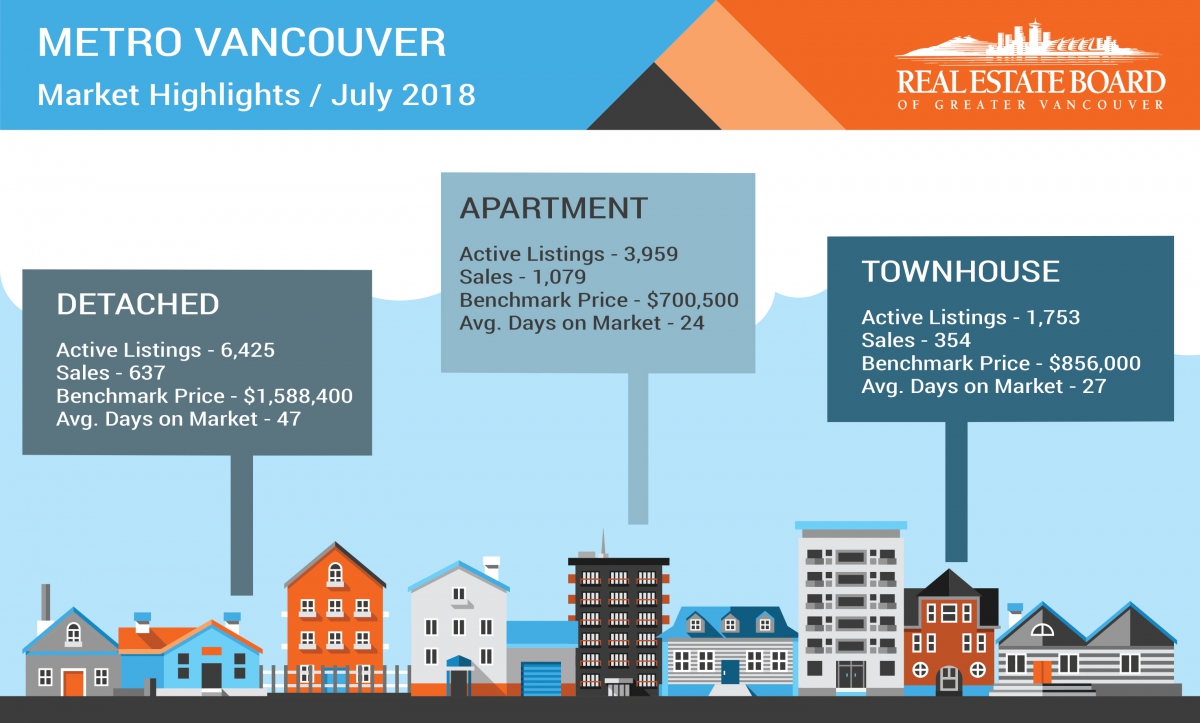
According to REBGV’s latest press release, July’s residential housing sales in Metro Vancouver reached their lowest levels for that month since the year 2000.
Phil Moore, REBGV President, has noted that,
“With fewer buyers active in today’s market, we’re seeing less upward pressure on home prices across the region… This is most pronounced in the detached home market, but demand in the townhome and apartment markets is also relenting from the more frenetic pace experienced over the last few years.”
He also added that “Summer is traditionally a quieter time of year in real estate. This is particularly true this year,” Moore said. “With increased mortgage rates and stricter lending requirements, buyers and sellers are opting to take a wait-and-see approach for the time being.”
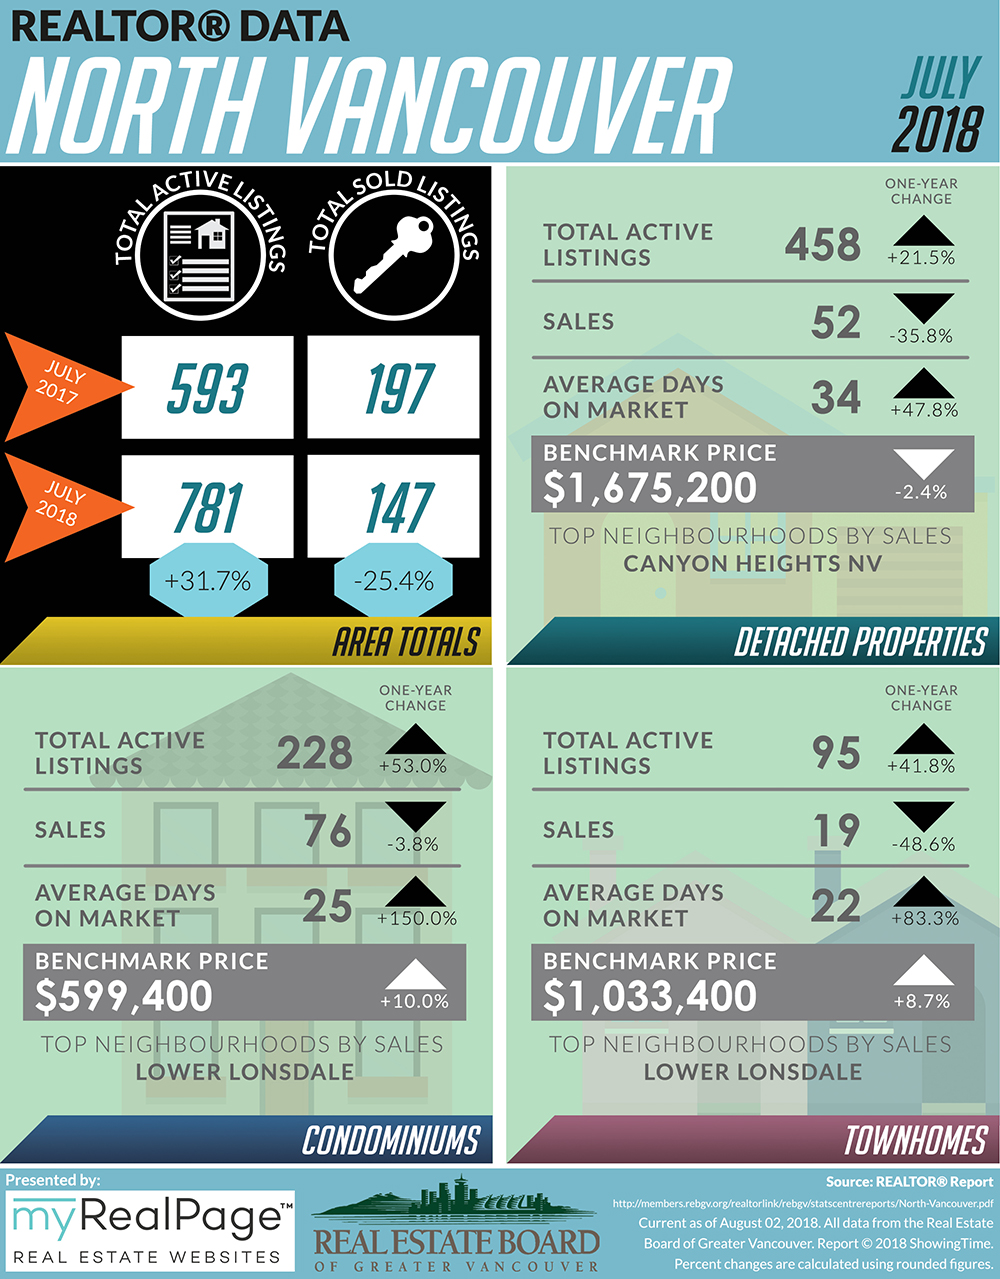
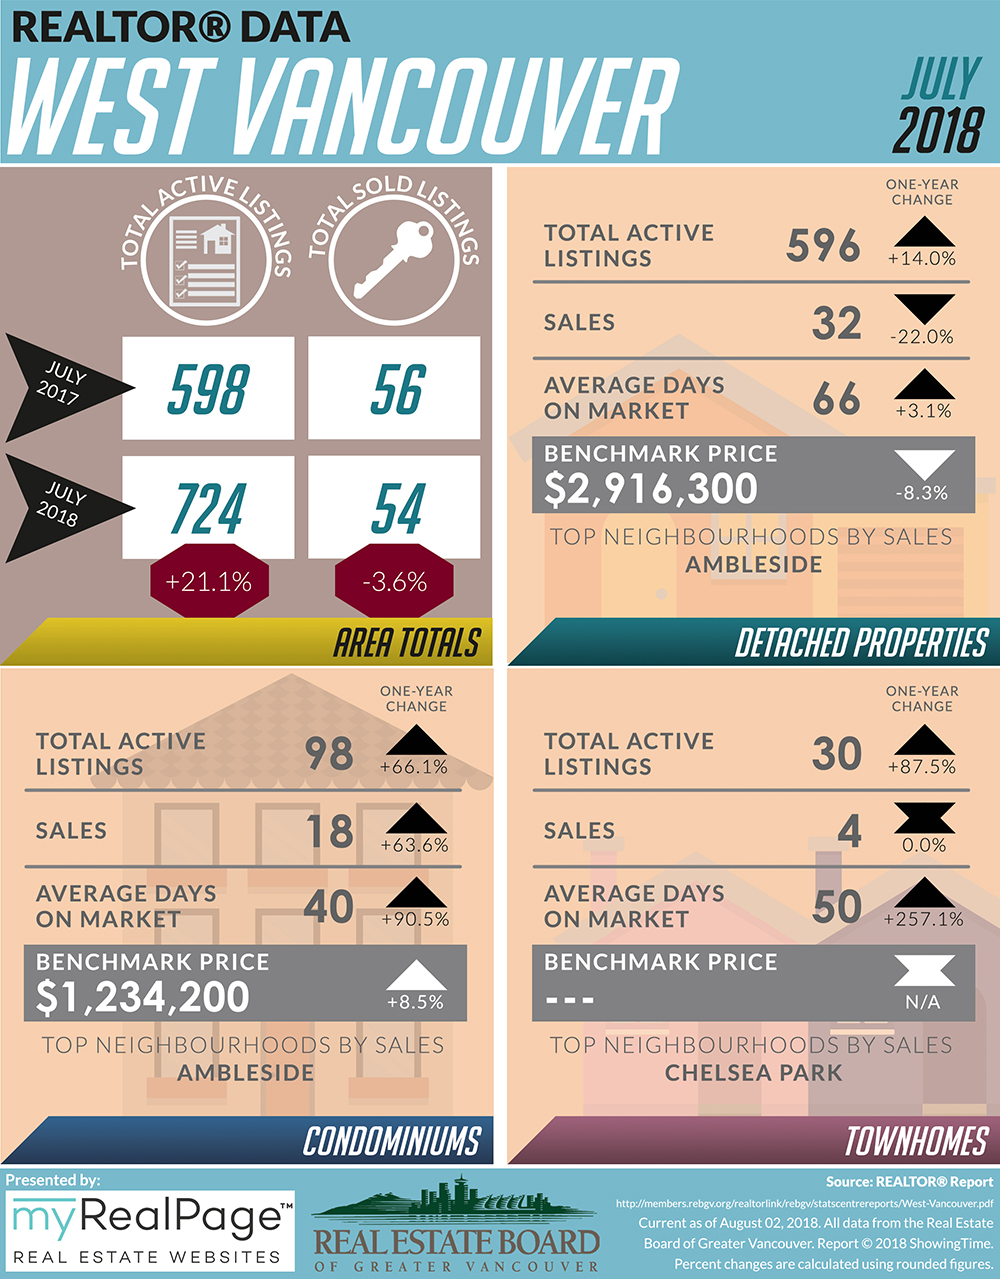
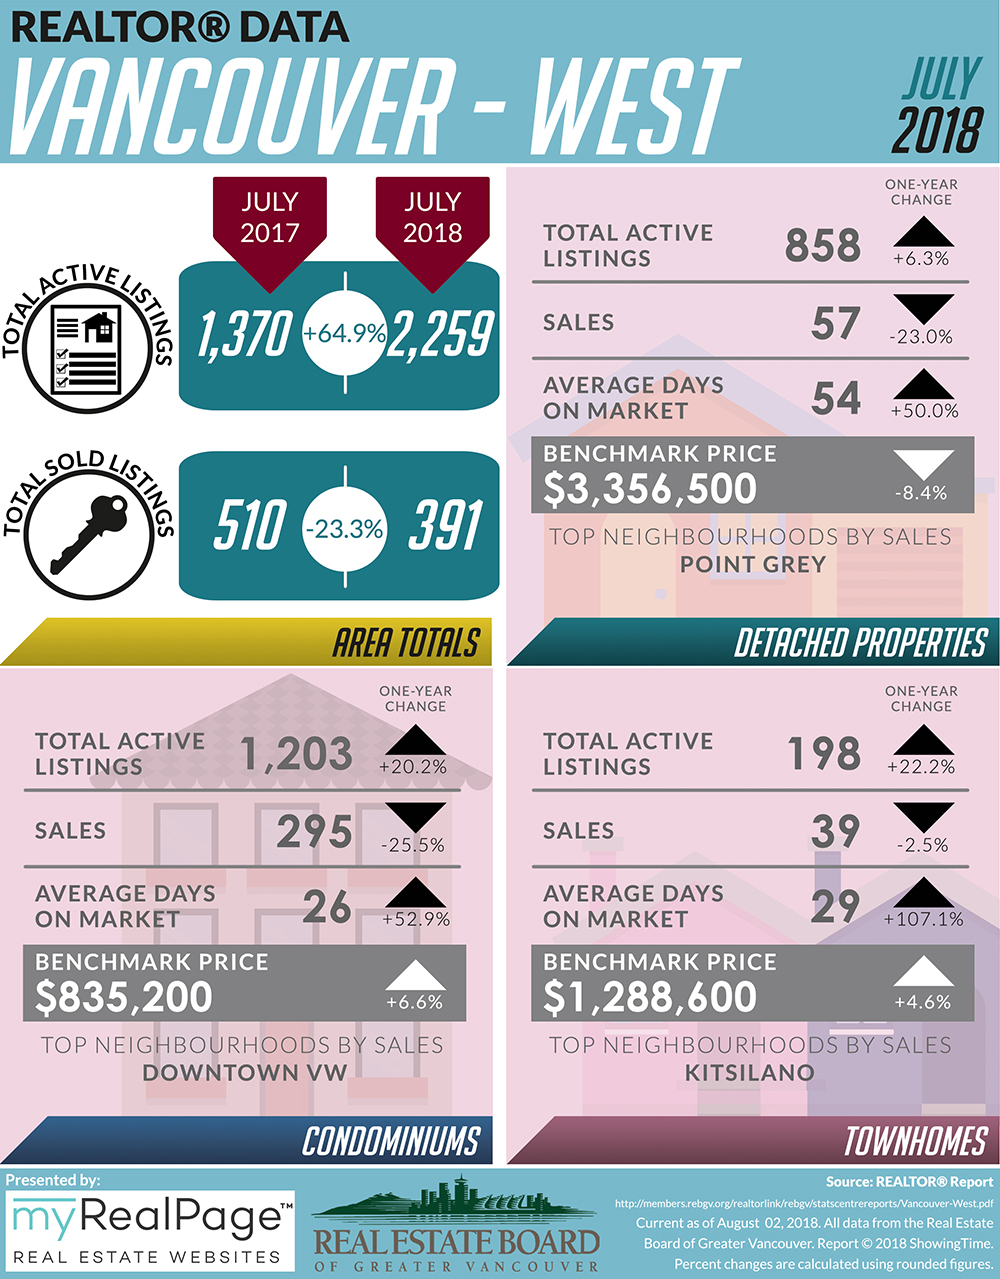
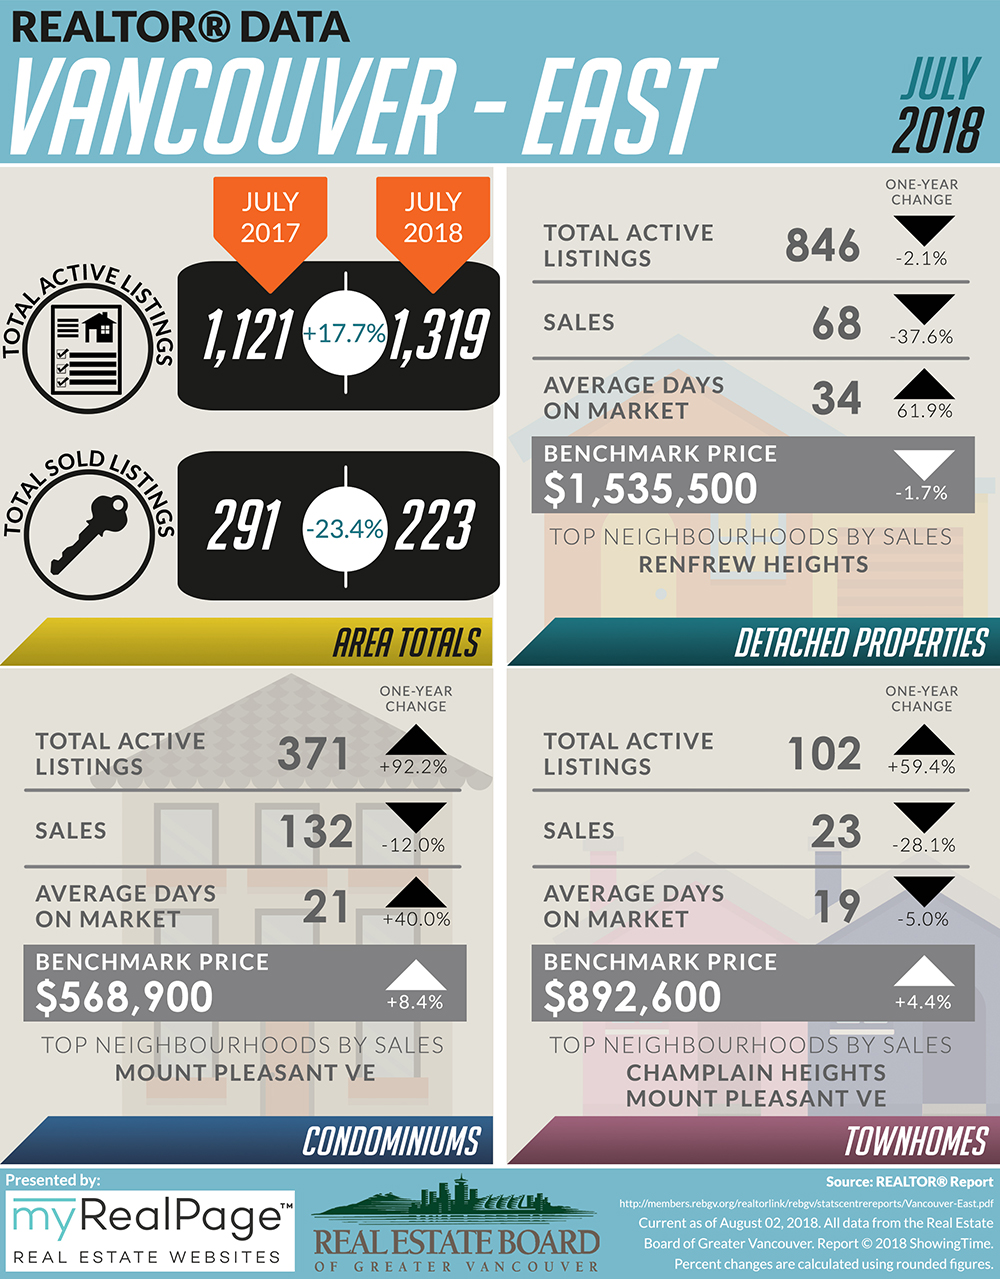
The following data is a comparison between July 2017 and July 2018 numbers, and is current as of August 2018. For last month’s update, you can check out our previous post for June 2018 data. Or follow this link for all our REBGV Infographics!
These infographics cover current trends in North Vancouver, West Vancouver, Vancouver East, and Vancouver West.
Click on the images for a larger view!
(Protip: Make sure to grab the printable PDF versions, too! It fits best when printed on A4-sized sheets, AND we’ve added an area on the sheet where you can attach your business card! 🙂 )
Last Updated on July 25, 2022 by myRealPage
