INFOGRAPHICS: June 2018 REBGV Greater Vancouver Market Reports

And just like that, the first half of the year is over! As we head into the second half, here are the latest Vancouver Market Reports from The Real Estate Board of Greater Vancouver (REBGV).
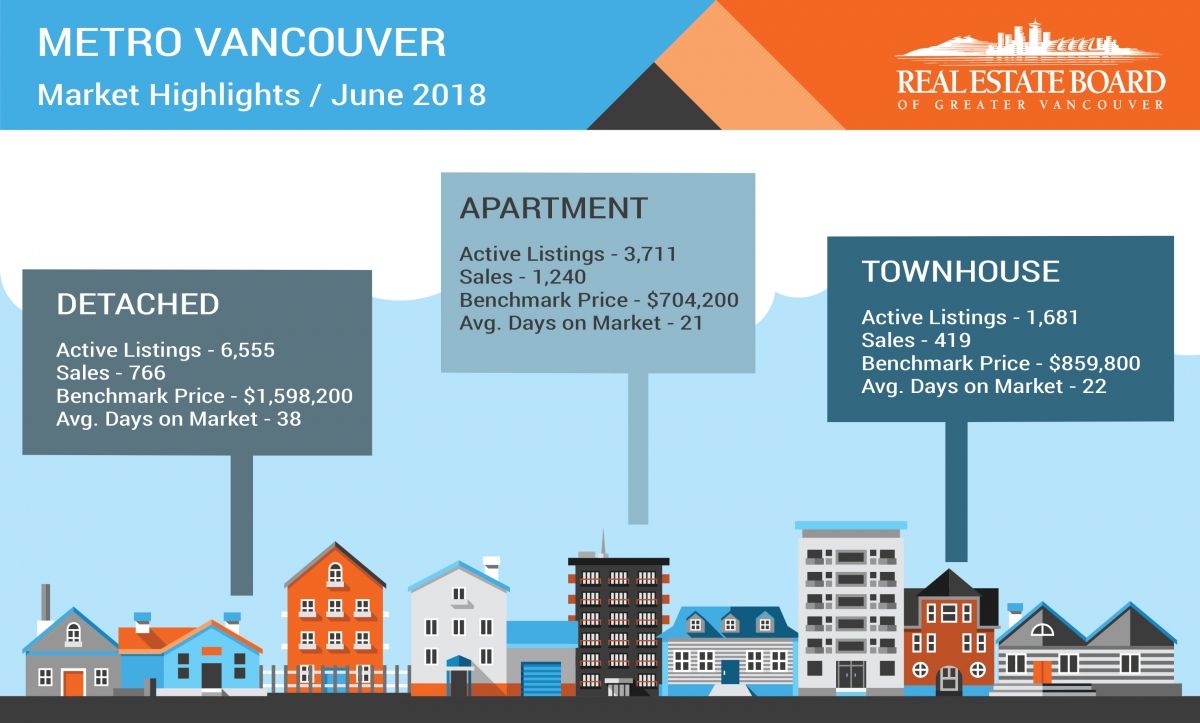
According to the latest REBGV press release, home sales have been dipping below long-term historical averages, while supply is at a three-year high as of June 2018. In fact, June 2018 sales were apparently 28.7% below the 10-year June sales average.
As REBGV President Phil Moore has noted, “Rising interest rates, high prices and more restrictive mortgage requirements are among the factors dampening home buyer activity today.”
He has also pointed out that it is currently a buyers’ market:
“With reduced demand, detached homes are entering a buyers’ market and price growth in our townhome and apartment markets is showing signs of decelerating.”
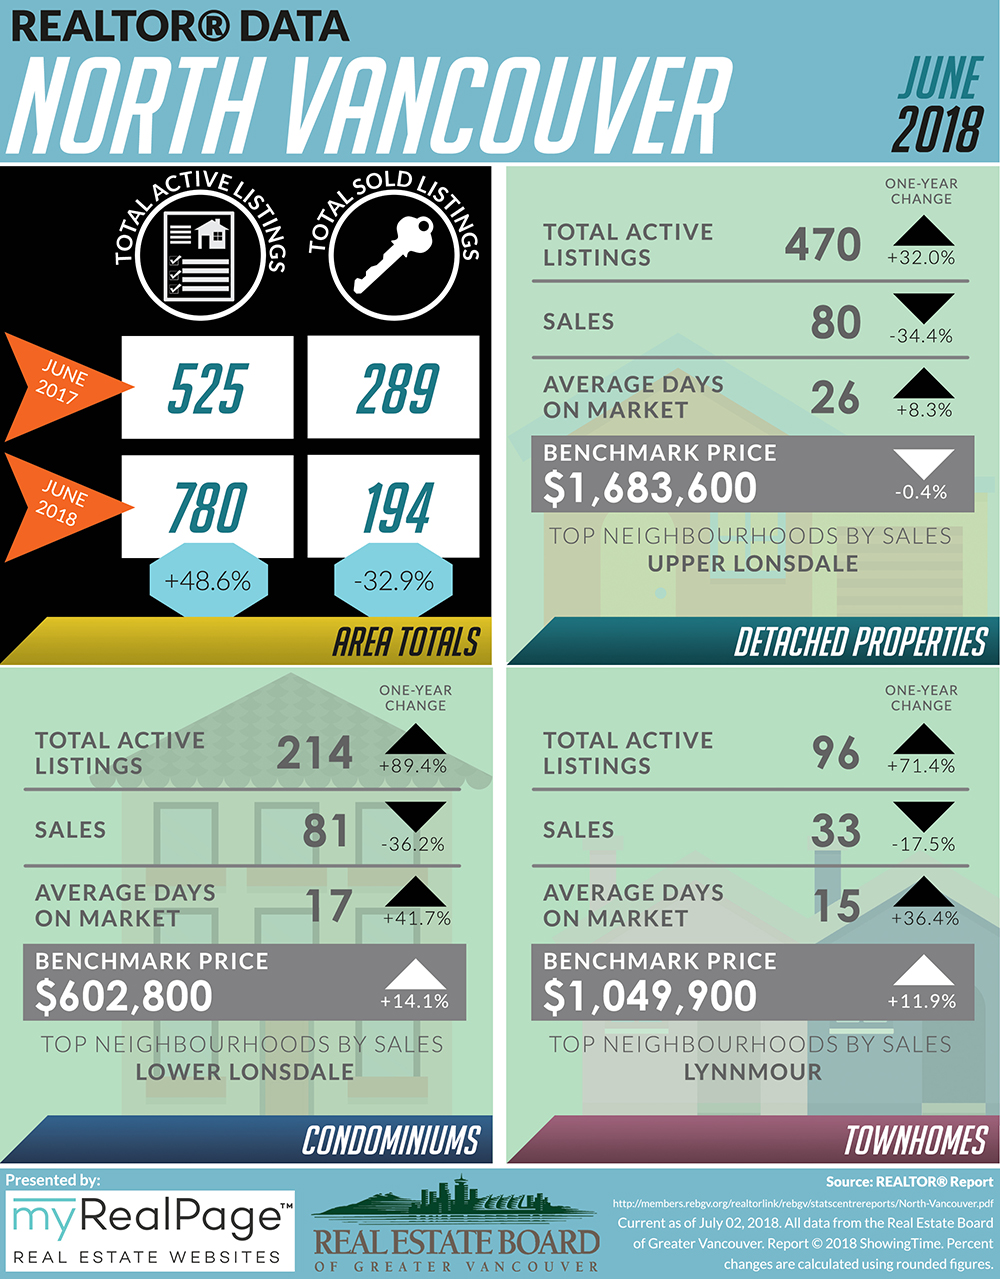
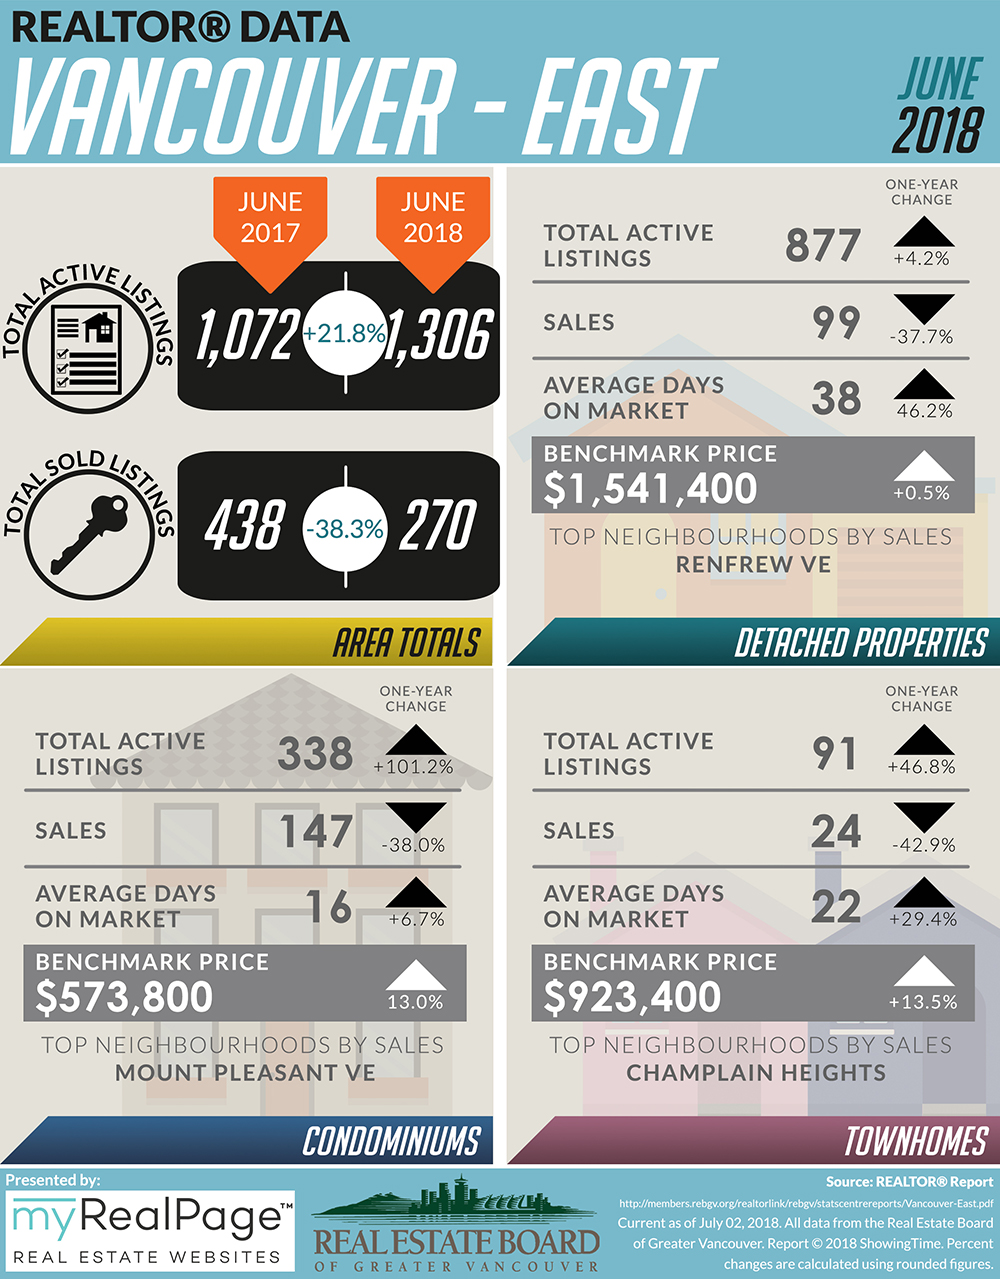
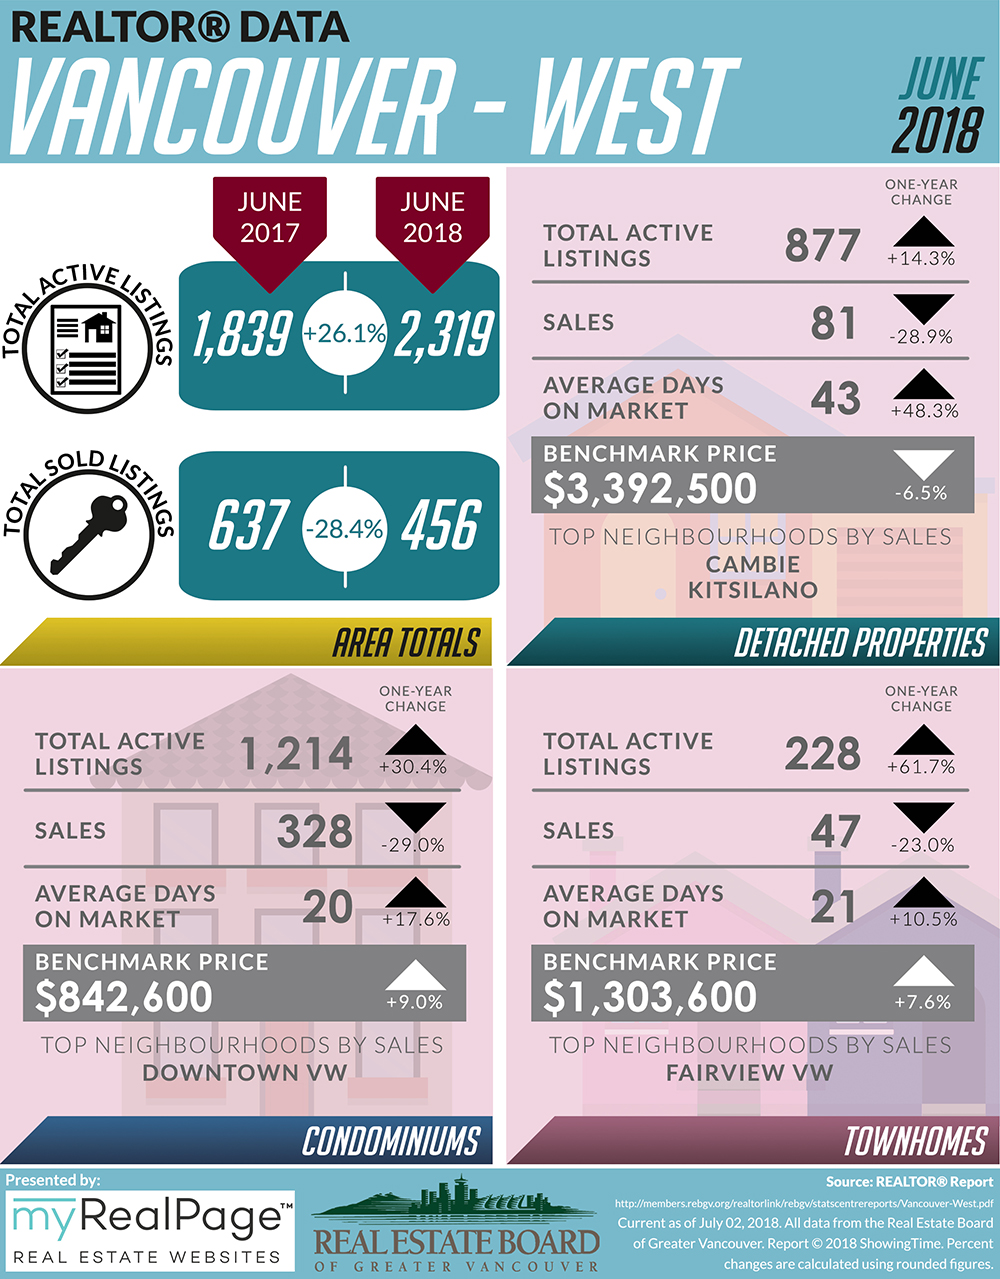
The following data is a comparison between June 2017 and June 2018 numbers, and is current as of July 2, 2018. For last month’s update, you can check out our previous post for May 2018 data. Or follow this link for all our REBGV Infographics!
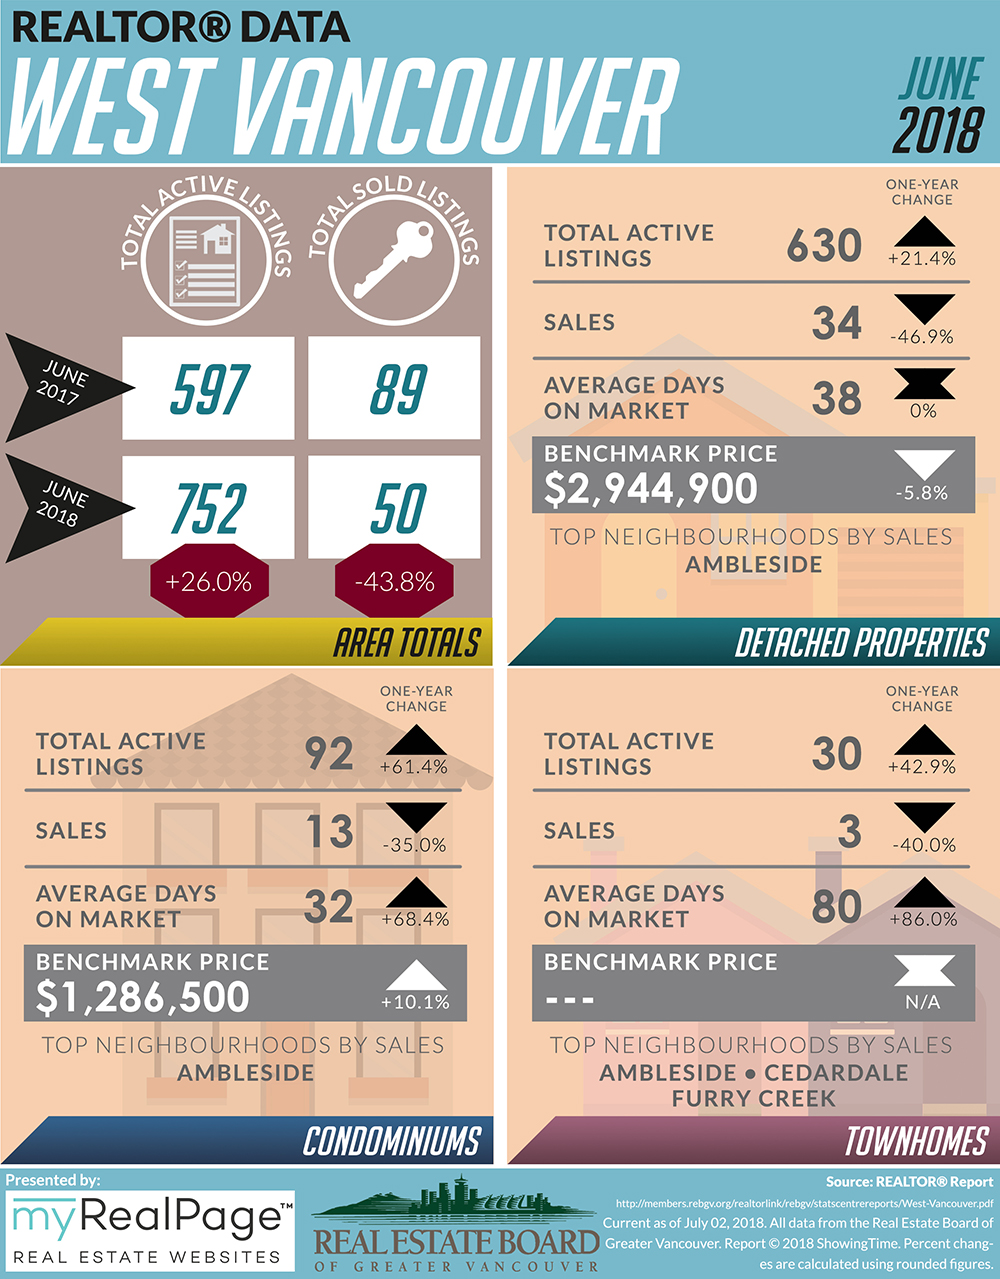
These infographics cover current trends in North Vancouver, West Vancouver, Vancouver East, and Vancouver West.
Click on the images for a larger view!
(Protip: Make sure to grab the printable PDF versions, too! It fits best when printed on A4-sized sheets, AND we’ve added an area on the sheet where you can attach your business card! 🙂 )
Download Printable Version – REBGV June 2018 Data Infographics
Last Updated on July 25, 2022 by myRealPage
