INFOGRAPHICS: May 2018 REBGV Greater Vancouver Market Reports

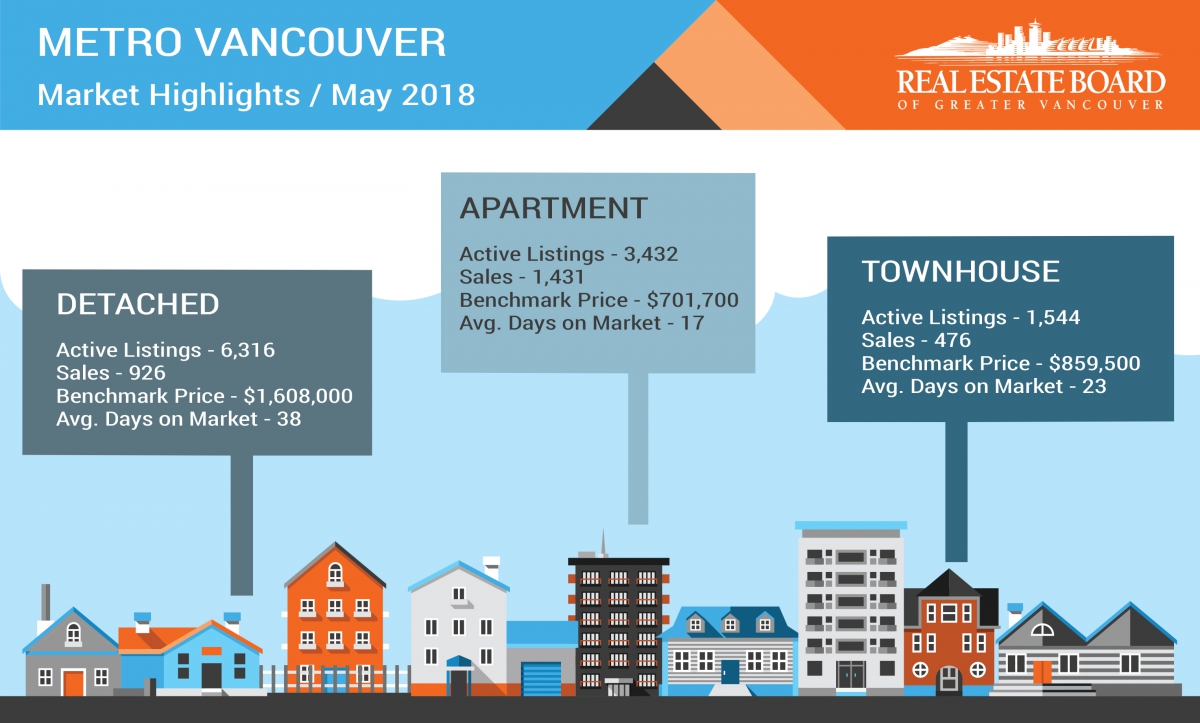
As we’re about to end the first half of the year, the downward trend in home buyer demand within the REBGV area is still continuing to make its presence felt.
According to REBGV’s latest release, May 2018 sales were 19.3% below the 10-year May sales average.
Phil Moore, president of the Real Estate Board of Greater Vancouver, has noted, “With fewer homes selling today compared to recent years, the number of homes available for sale is rising,”
He has also cited the rising inventory numbers, saying,
“The selection of homes for sale in Metro Vancouver has risen to the highest levels we’ve seen in the last two years, yet supply is still below our long-term historical averages.”
For home sellers, he advises that competitive pricing is crucial due to the shifting dynamics that are currently occurring in the market. As for home buyers, he has noted the importance of working with local Realtors in order to better understand these fluctuations and how it can affect them.
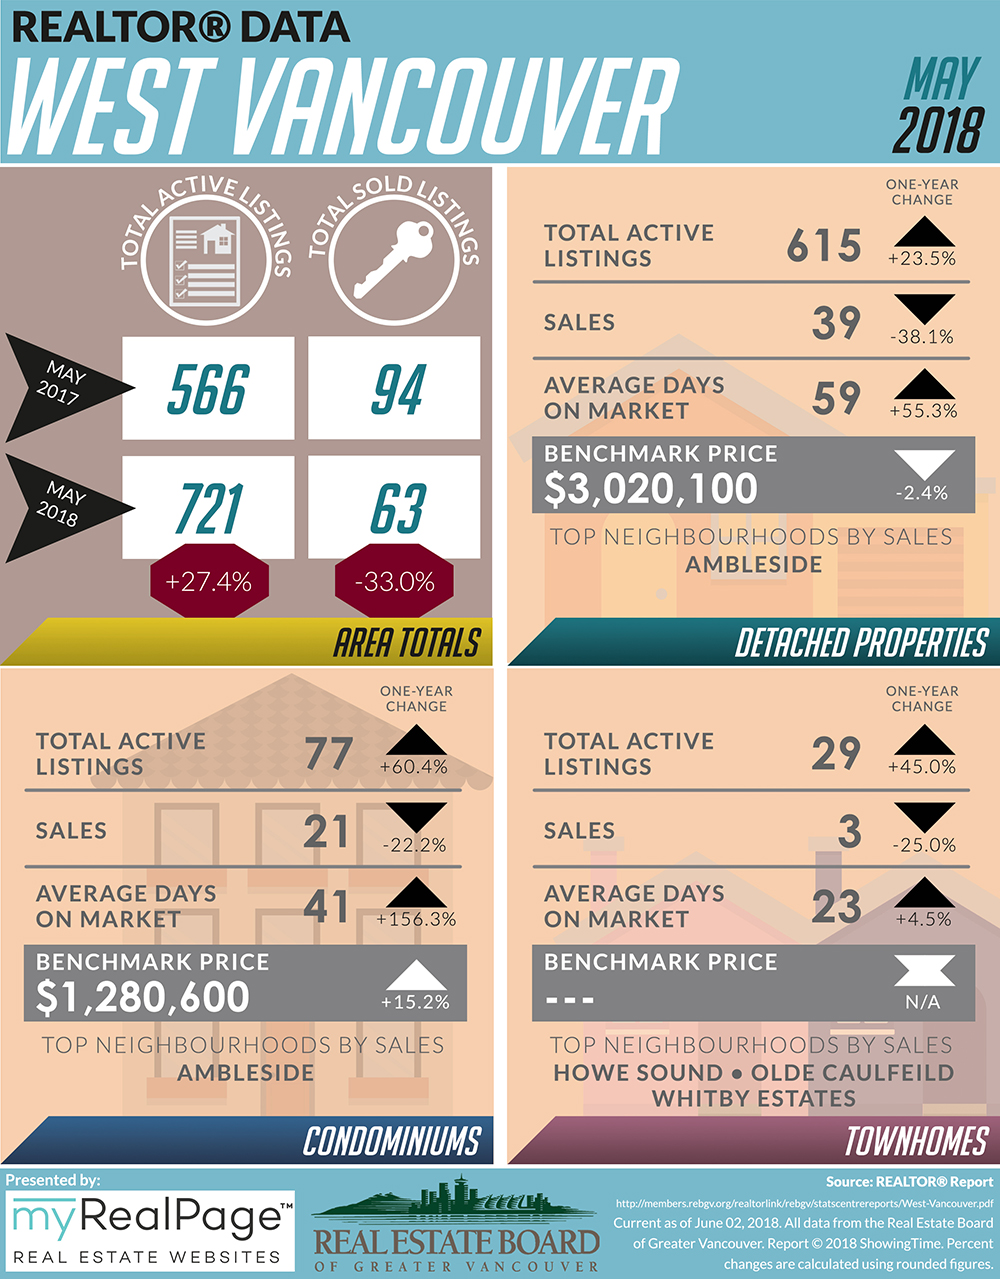
The following data is a comparison between May 2017 and May 2018 numbers, and is current as of June 2, 2018. For last month’s update, you can check out our previous post for April 2018 data. Or follow this link for all our REBGV Infographics!
These infographics cover current trends in North Vancouver, West Vancouver, Vancouver East, and Vancouver West.
Click on the images for a larger view!
(Protip: Make sure to grab the printable PDF versions, too! It fits best when printed on A4-sized sheets, AND we’ve added an area on the sheet where you can attach your business card! 🙂 )
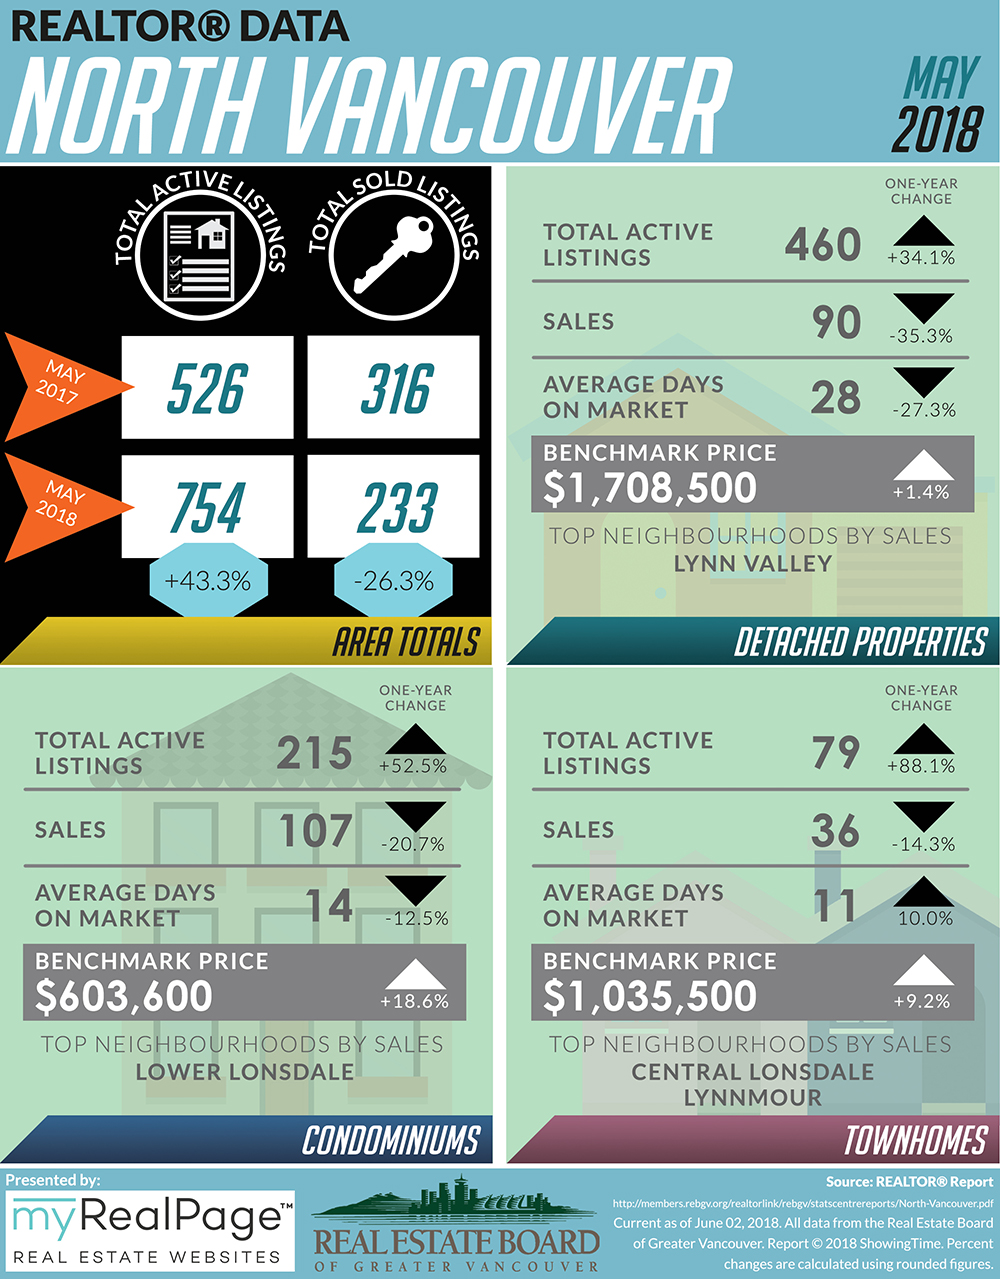
Download Printable Version – North Vancouver
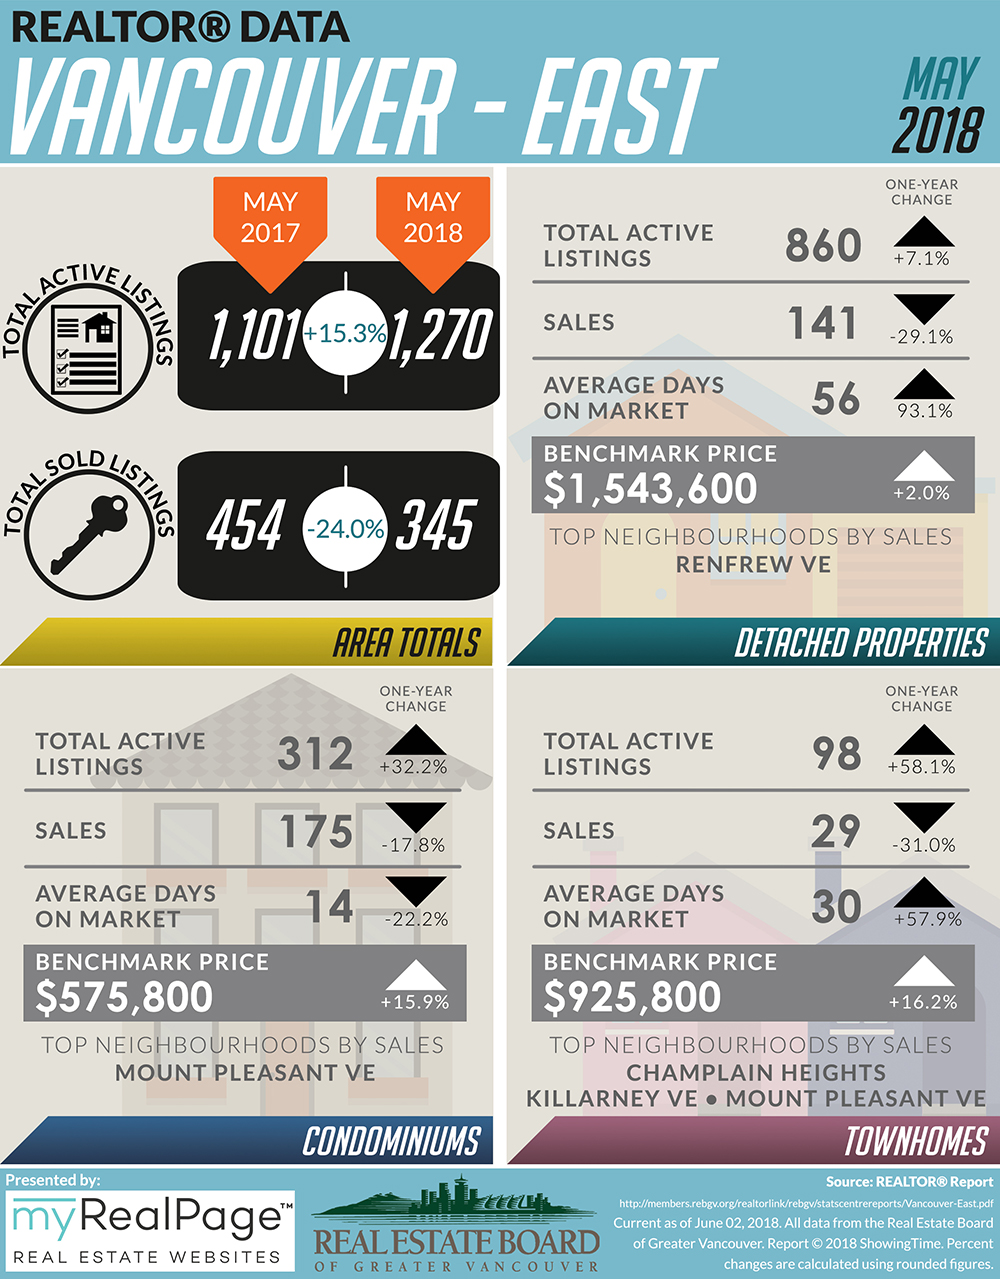
Download Printable Version – Vancouver East
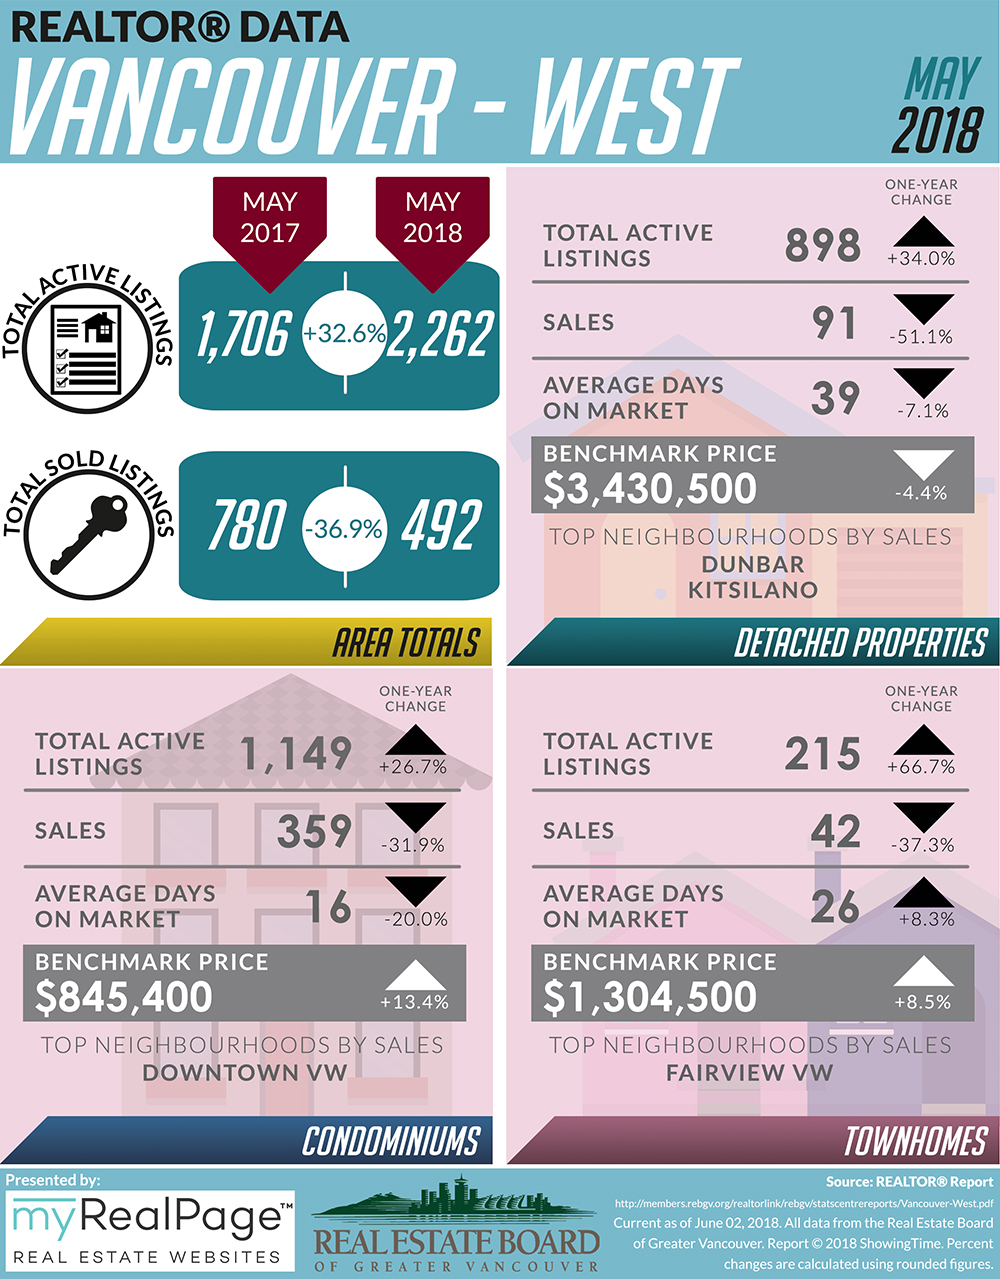
Download Printable Version – Vancouver West
Download Printable Version – West Vancouver
Last Updated on July 25, 2022 by myRealPage
