INFOGRAPHICS: August 2019 REBGV Greater Vancouver Market Reports

Bye, summer! Hello, fall! Here’s our monthly market update for areas covered by the Real Estate Board of Greater Vancouver (REBGV)!
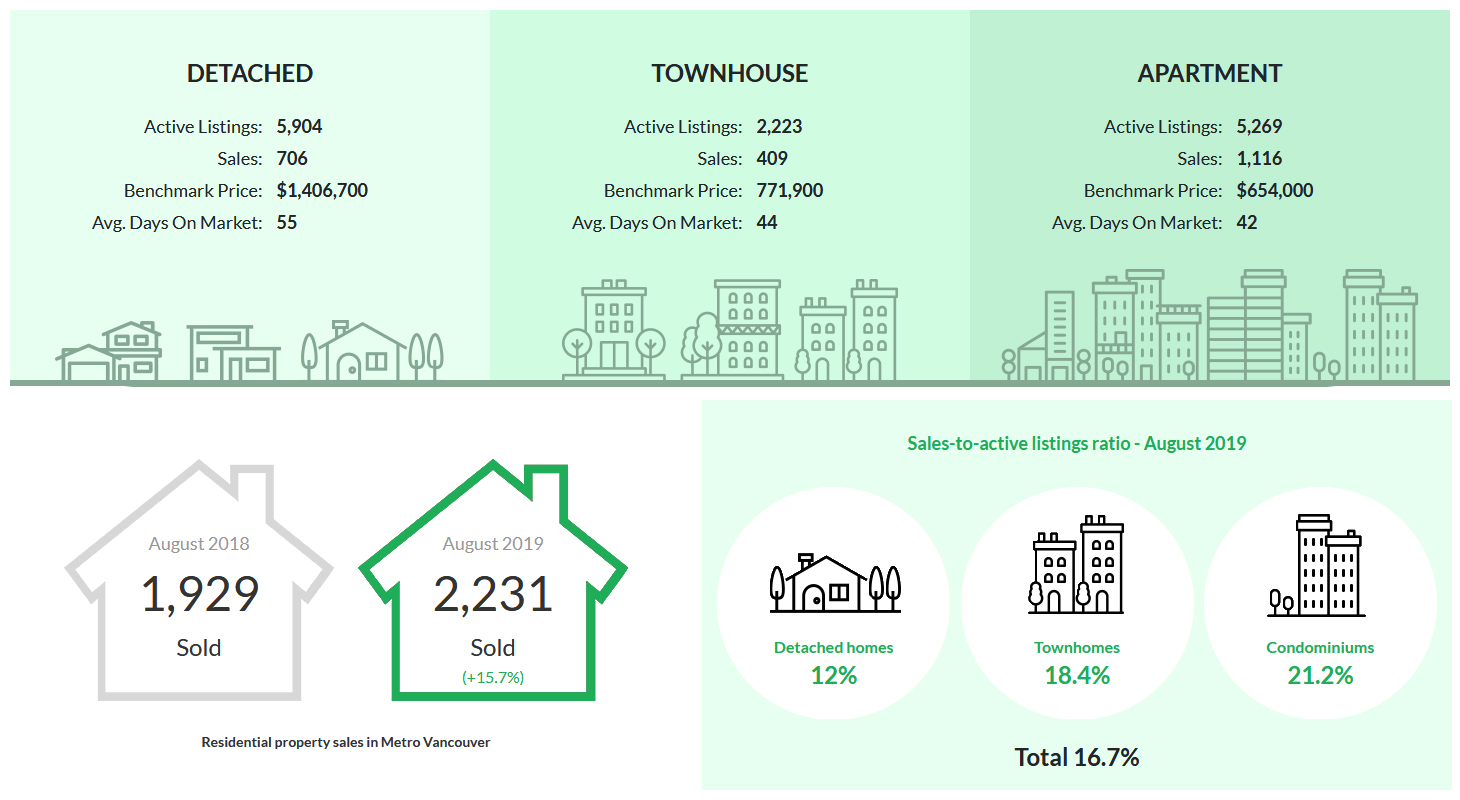
As stated in their August market report, the Metro Vancouver housing market has seen an uptick in sales this summer.
REBGV reports that residential home sales in the region totaled 2,231 in August 2019, a 15.7% increase from the 1,929 sales recorded in August 2018, and a 12.7% decrease from the 2,557 homes sold in July 2019.
However, August sales were 9.2% below the 10-year August sales average.
The total number of homes currently listed for sale on the MLS® system in Metro Vancouver is 13,396, a 13.3% increase compared to August 2018 (11,824) and a 5.9% decrease compared to July 2019 (14,240).
As noted by REBGV President Ashley Smith,
“Home sales returned to more historically normal levels in July and August compared to what we saw in the first six months of the year.
With more demand from home buyers, the supply of homes listed for sale isn’t accumulating like earlier in the year. These changes are creating more balanced market conditions.”
The following data is a comparison between August 2018 and August 2019 numbers, and is current as of September 2019. For last month’s update, you can check out our previous post for July 2019 data.
Or follow this link for all our REBGV Infographics!
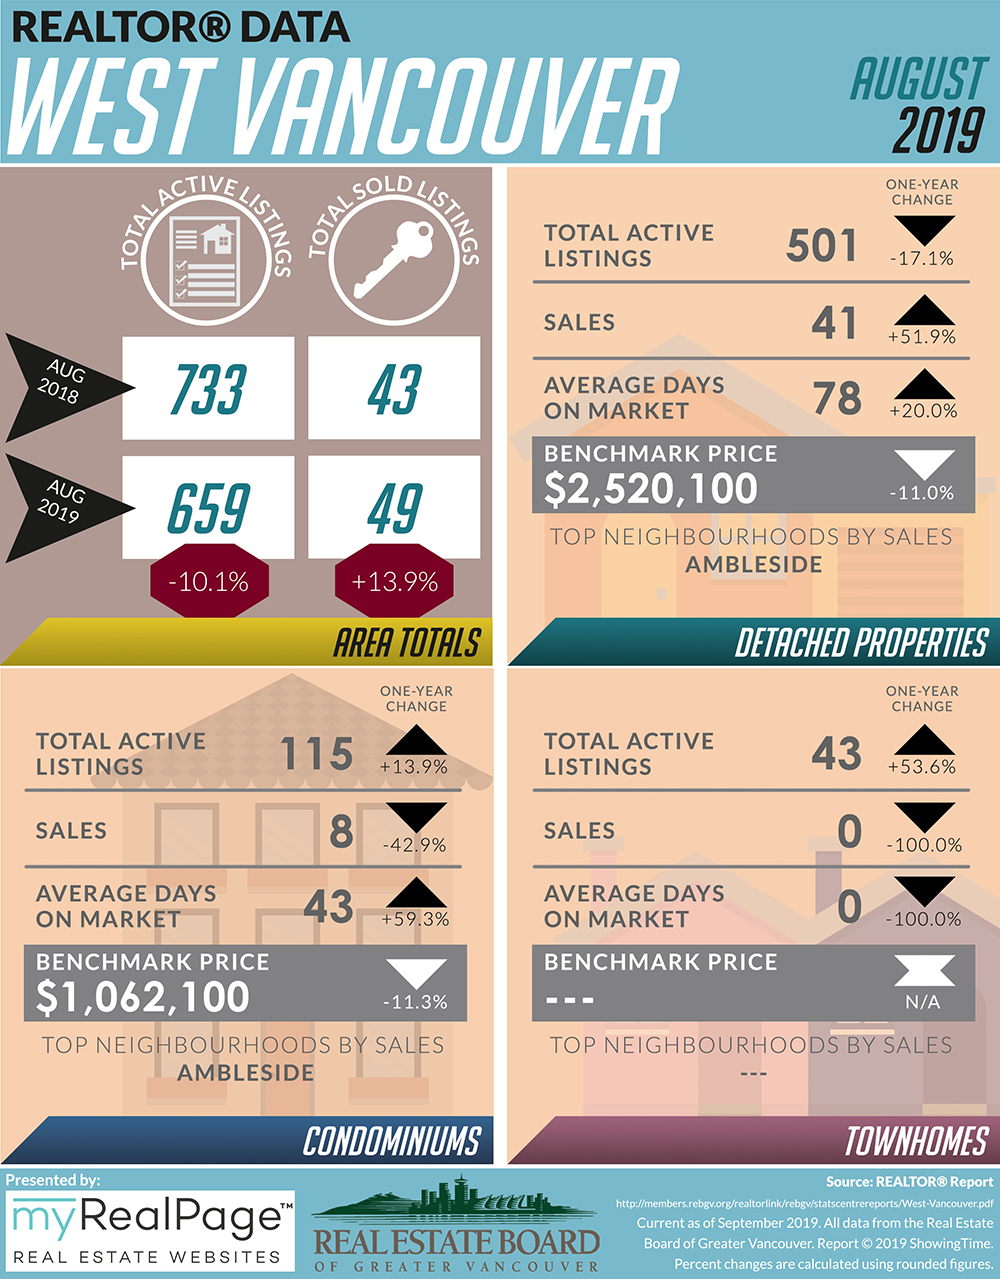
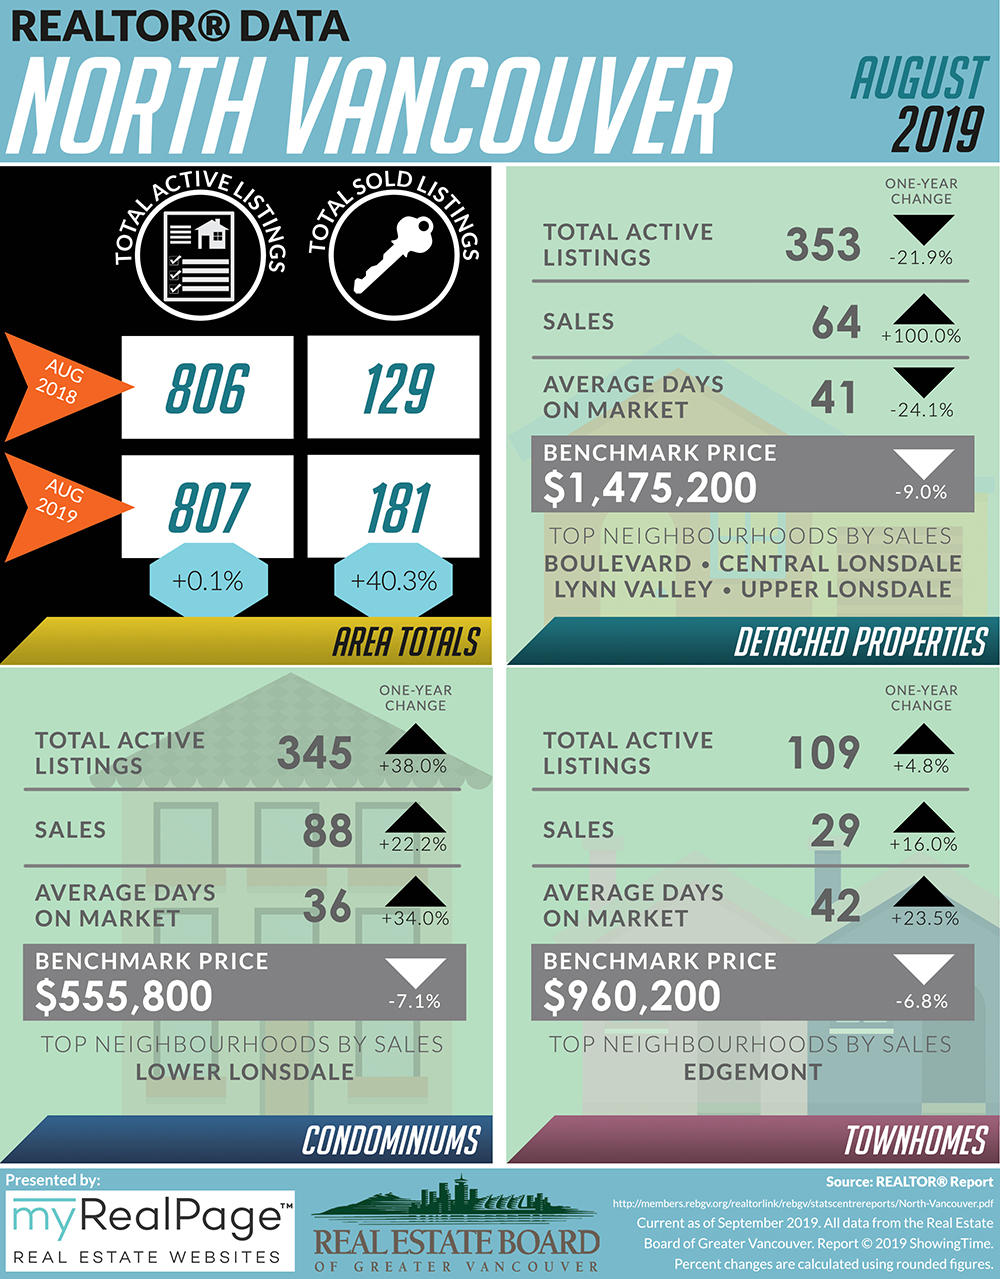
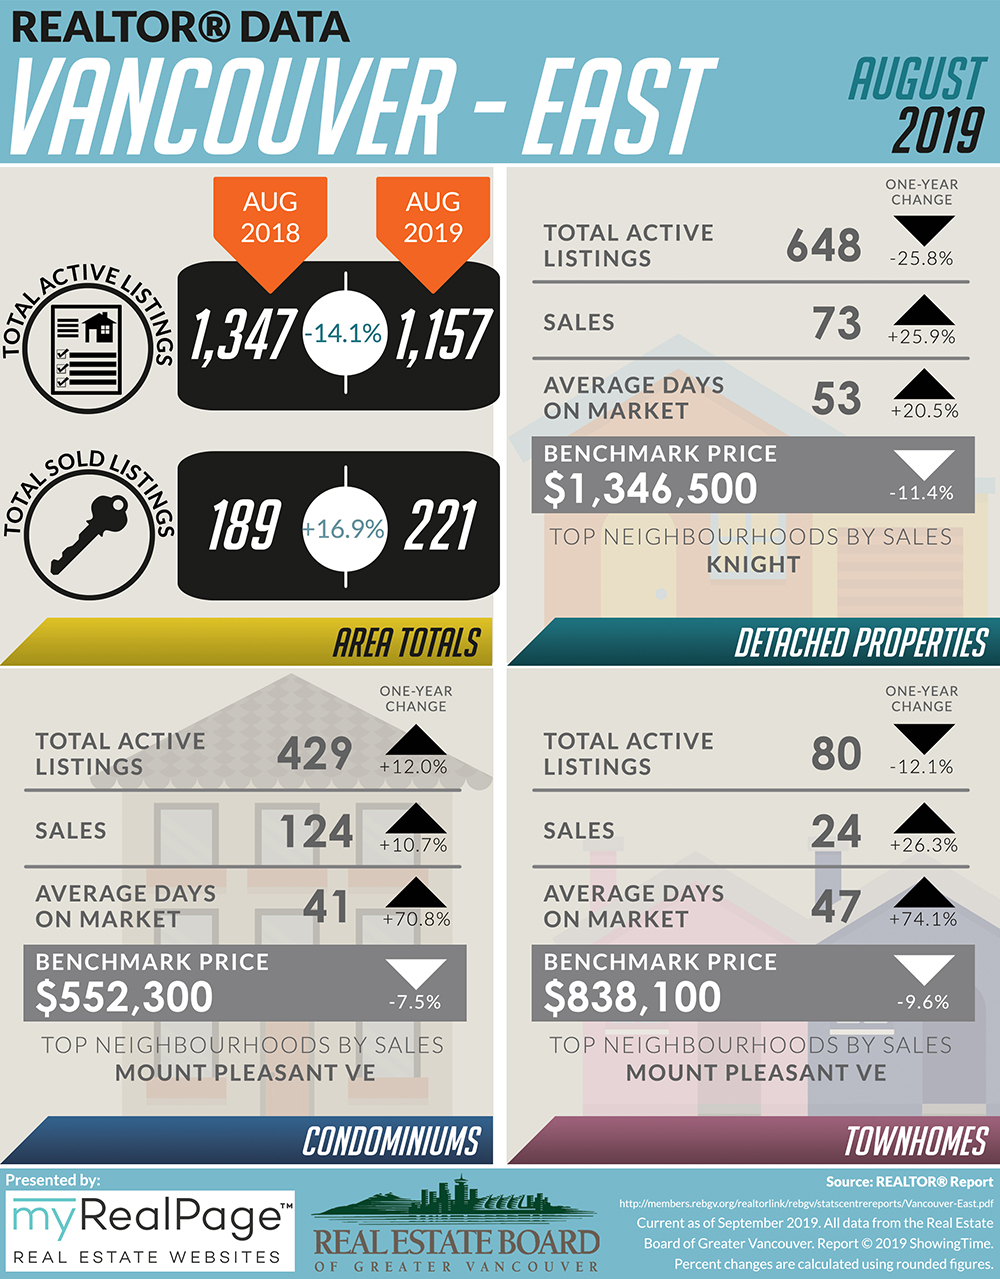
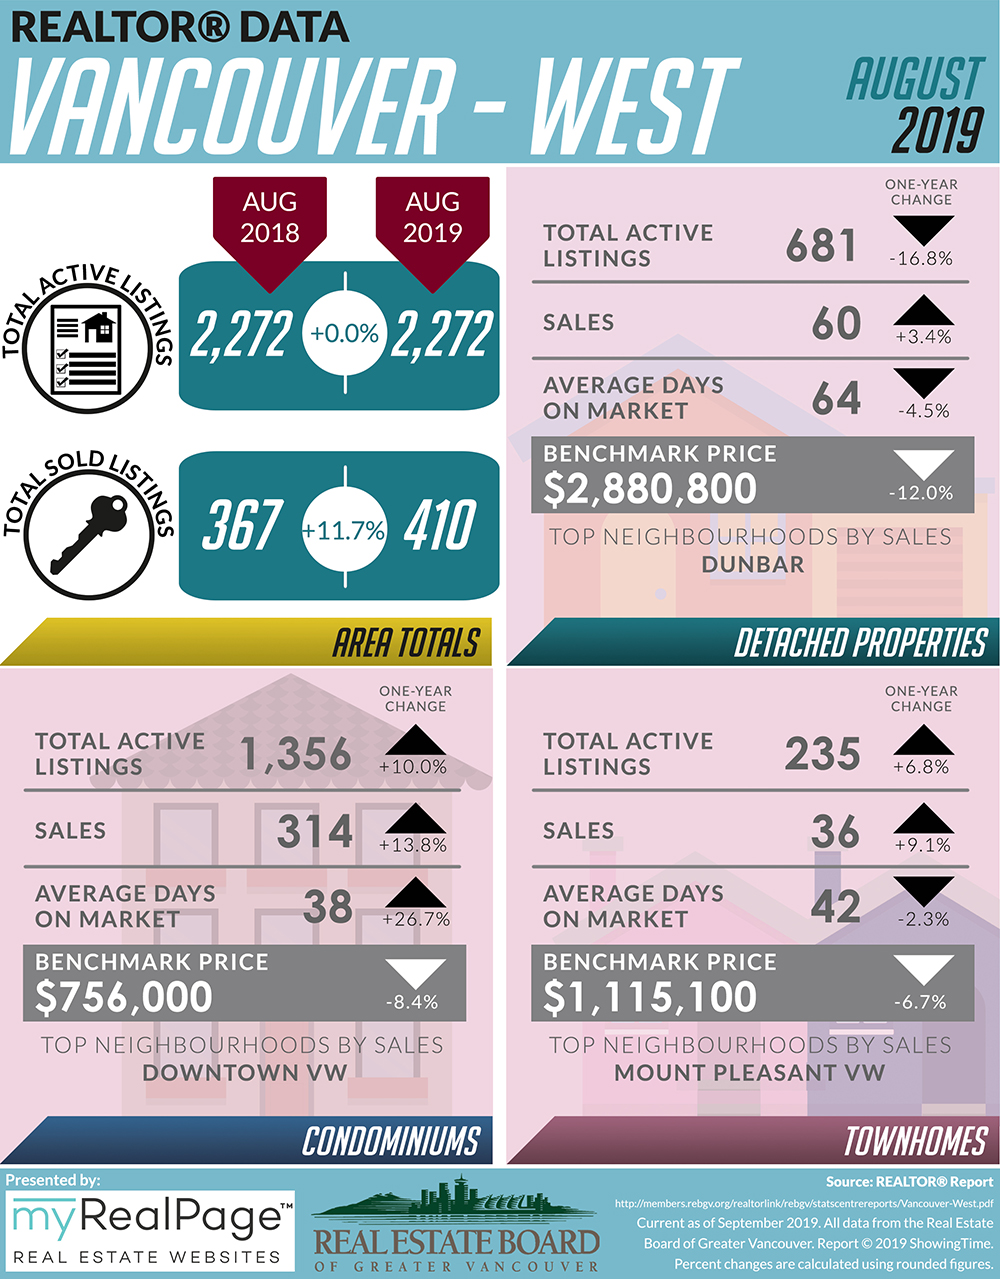
These infographics cover current trends in North Vancouver, West Vancouver, Vancouver East, and Vancouver West.
Click on the images for a larger view!
(Protip: Make sure to grab the printable PDF versions, too! It fits best when printed on A4-sized sheets, AND we’ve added an area on the sheet where you can attach your business card! 🙂 )
Download Printable Version – REBGV August 2019 Data Infographics
(Image Source: REBGV.org)

(Image source: REBGV Twitter)
Last Updated on July 25, 2022 by myRealPage
