INFOGRAPHICS: July 2019 REBGV Greater Vancouver Market Reports

Ready for our monthly updates? As always, here’s our monthly market update for areas covered by the Real Estate Board of Greater Vancouver (REBGV)!
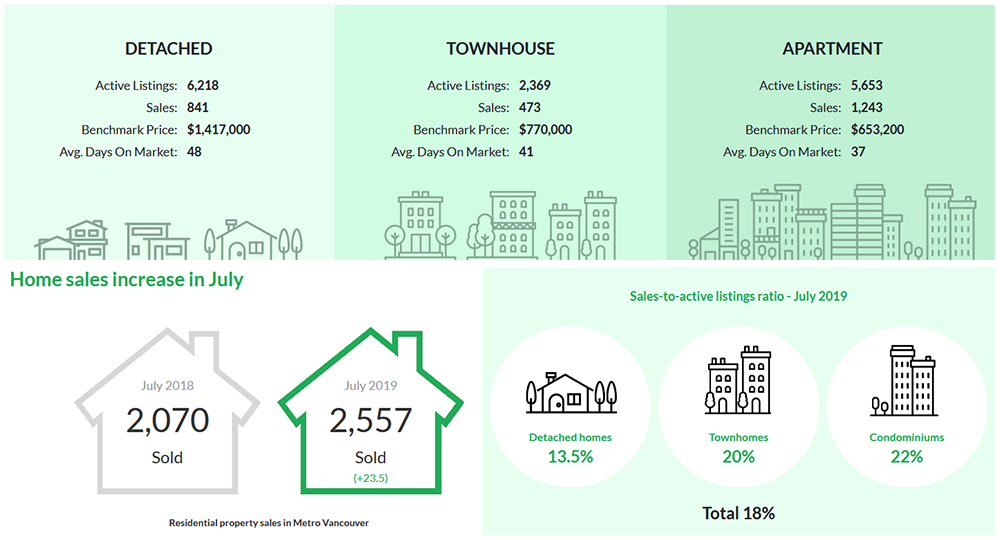
As noted in their most recent media release, REBGV has seen an increase in home sales for the month of July. Though it is a traditionally quieter month in real estate, it has turned out to be the second highest selling month so far this year.
The Real Estate Board of Greater Vancouver (REBGV) reports that residential home sales in the region totalled 2,557 in July 2019, a 23.5% increase from the 2,070 sales recorded in July 2018, and a 23.1% increase from the 2,077 homes sold in June 2019.
Last month’s sales were 7.8% below the 10-year July sales average.
There were 4,613 detached, attached and apartment properties newly listed for sale on the Multiple Listing Service® (MLS®) in Metro Vancouver in July 2019. This represents a 3.3% decrease compared to the 4,770 homes listed in July 2018 and a 2.9% decrease compared to June 2019 when 4,751 homes were listed.
According to Board President Ashley Smith,
“While home sale activity remains below long-term averages, we saw an increase in sales in July compared to the less active spring we experienced. Those looking to buy today continue to benefit from low interest rates, increased selection, and reduced prices compared to the heated market a few years ago.”
Generally, analysts say downward pressure on home prices occurs when the ratio dips below 12% for a sustained period, while home prices often experience upward pressure when it surpasses 20% over several months.
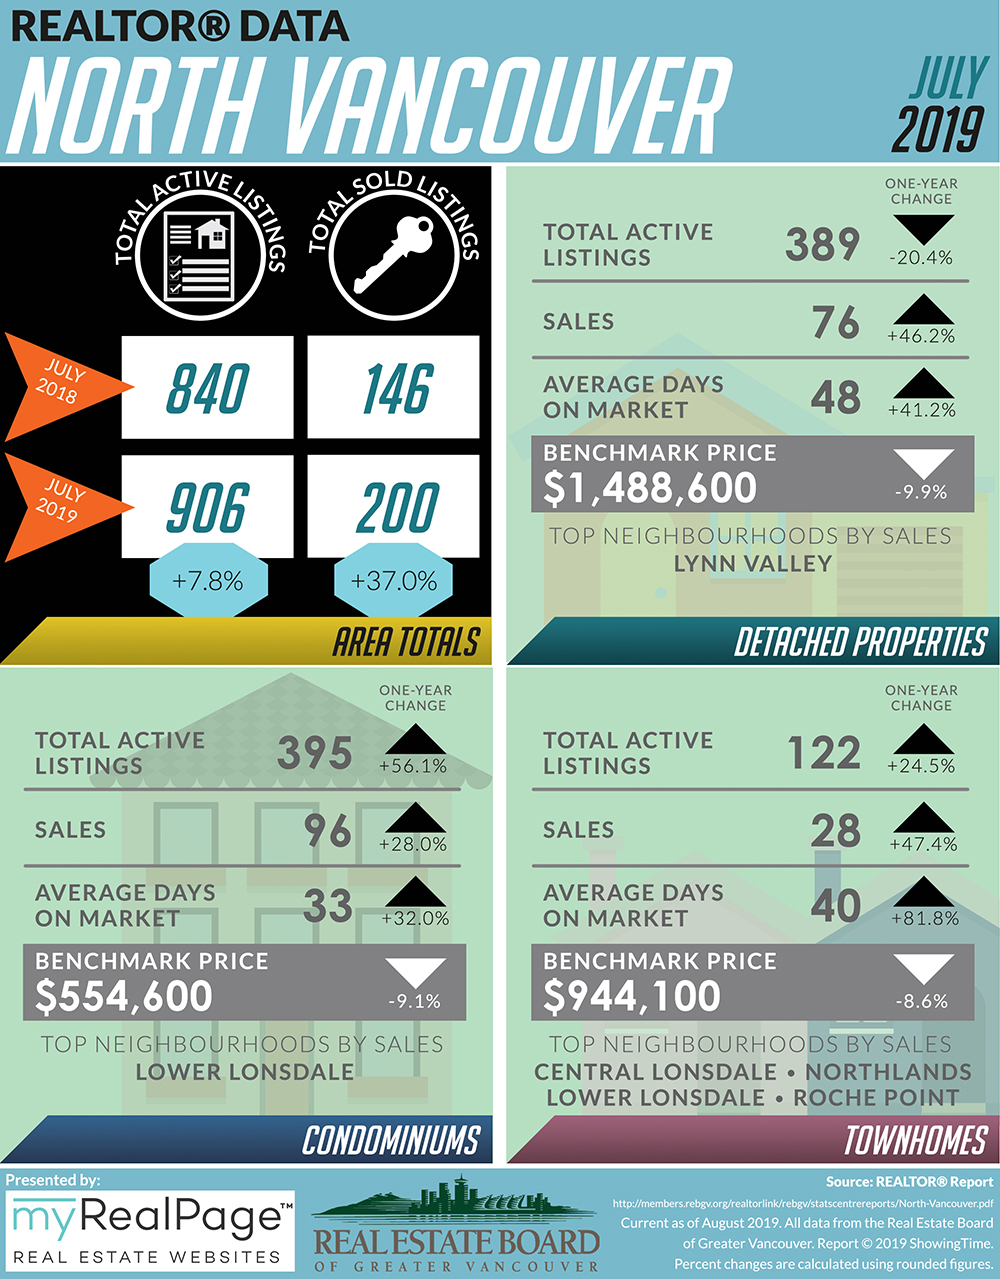
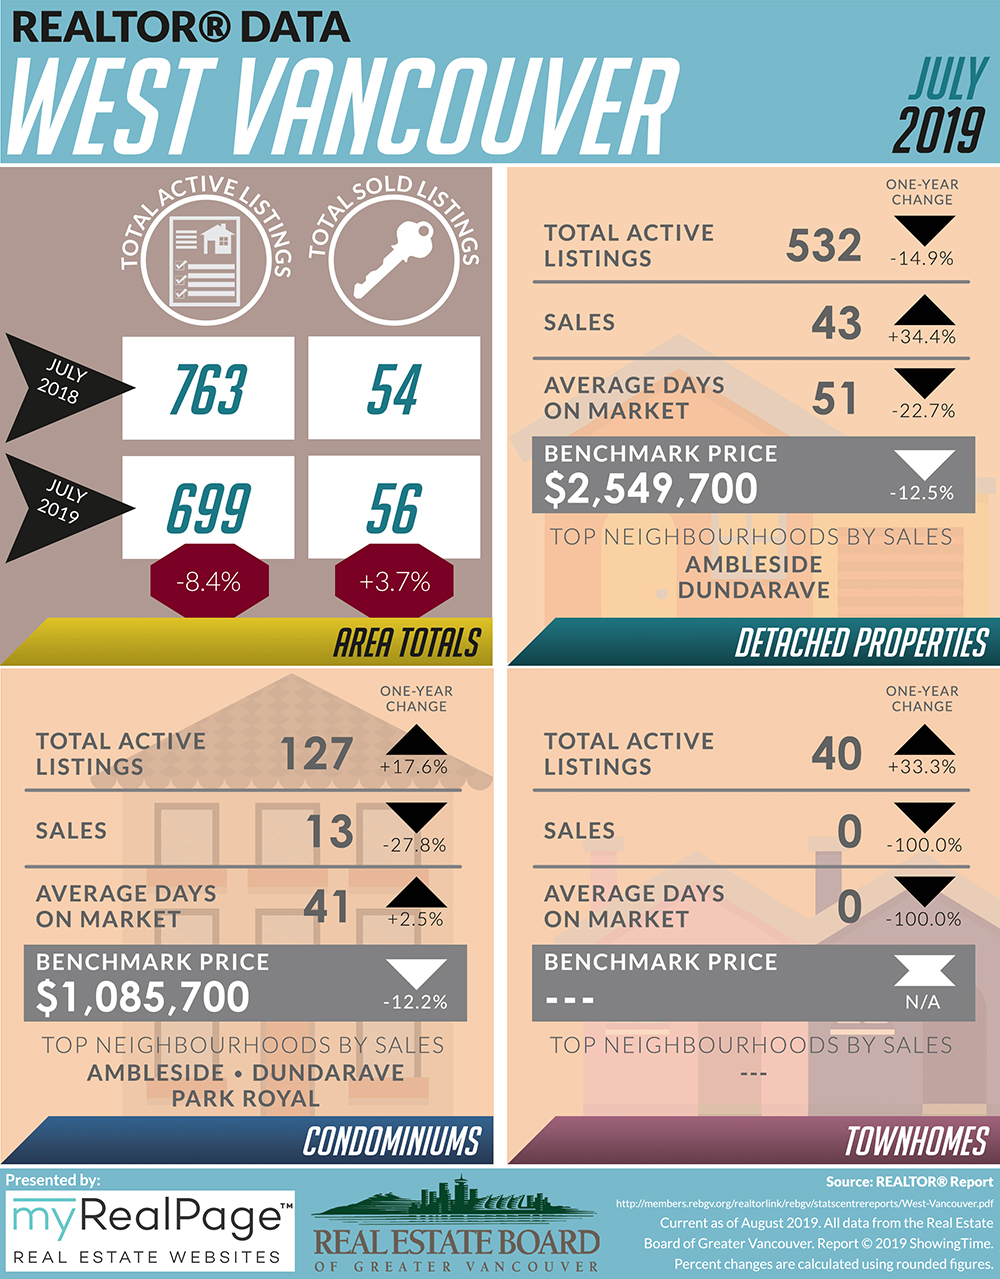
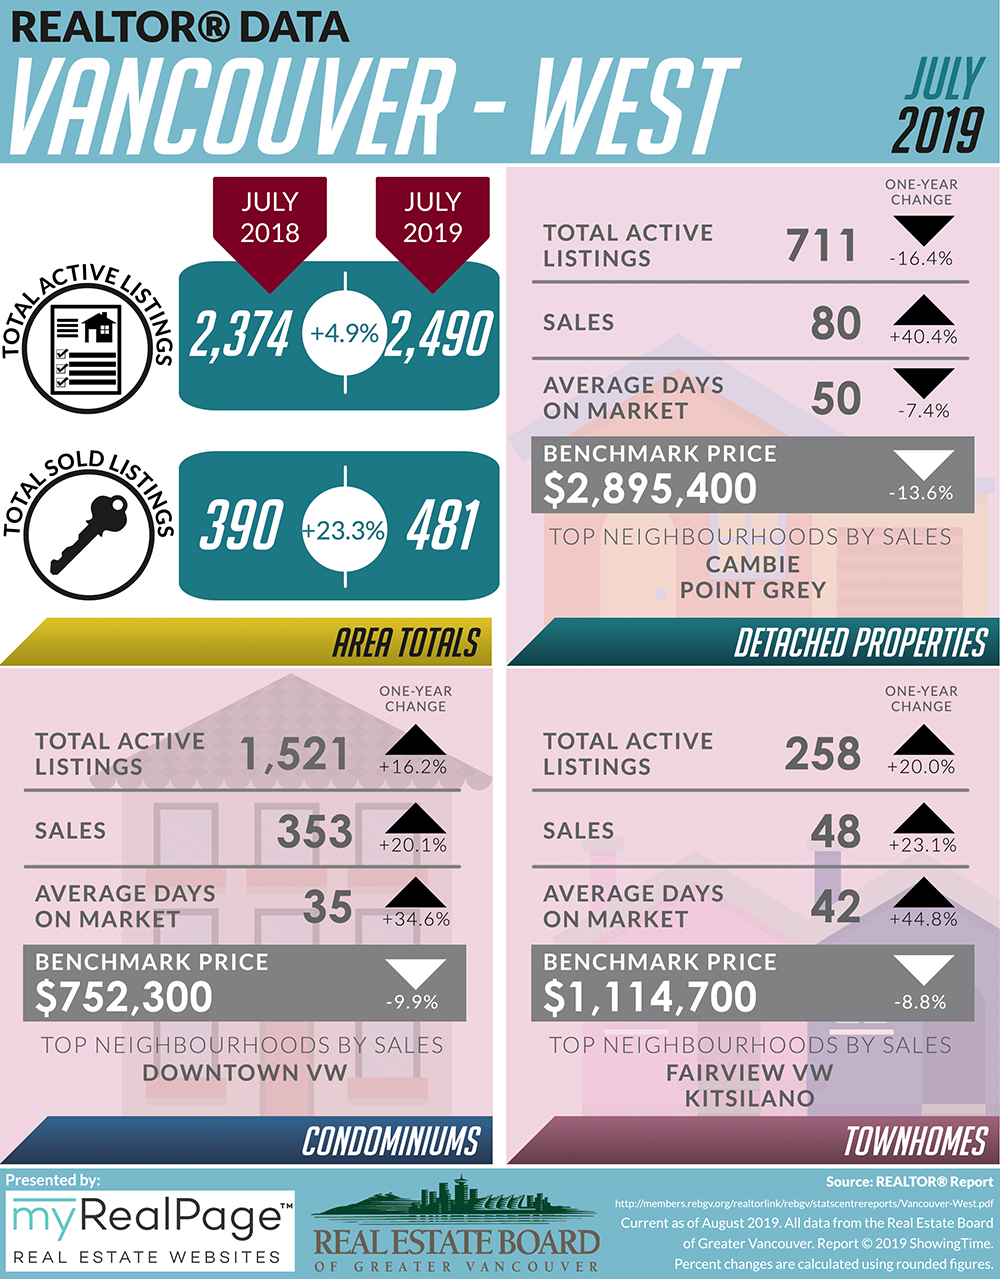
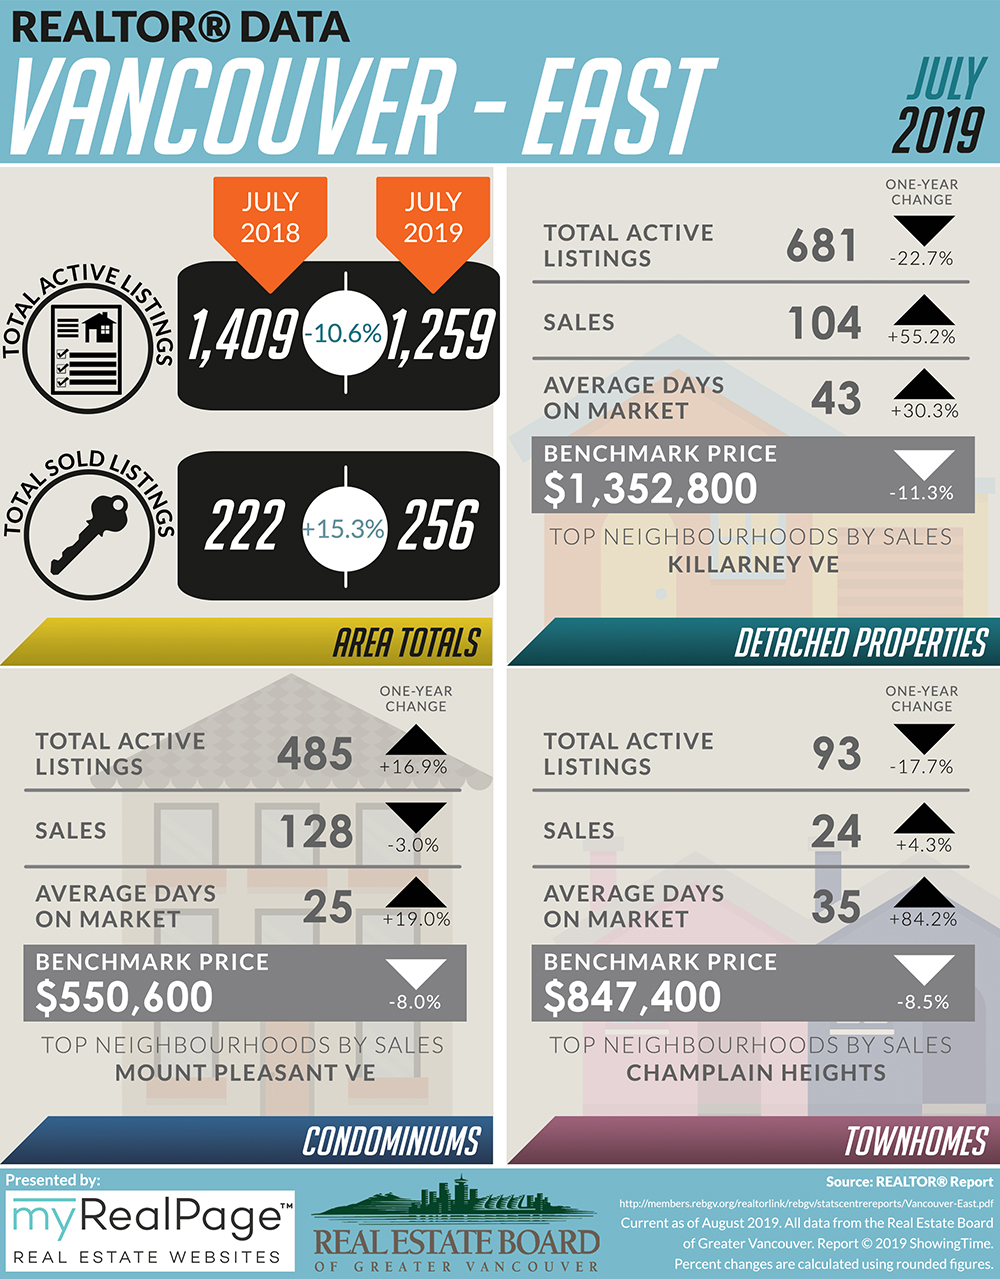
The following data is a comparison between July 2018 and July 2019 numbers, and is current as of August 2019. For last month’s update, you can check out our previous post for June 2019 data.
Or follow this link for all our REBGV Infographics!
These infographics cover current trends in North Vancouver, West Vancouver, Vancouver East, and Vancouver West.
Click on the images for a larger view!
(Protip: Make sure to grab the printable PDF versions, too! It fits best when printed on A4-sized sheets, AND we’ve added an area on the sheet where you can attach your business card! 🙂 )
Download Printable Version – REBGV July 2019 Data Infographics
(Image Source: REBGV.org)

(Image Source: REBGV Twitter)
Last Updated on July 25, 2022 by myRealPage
