INFOGRAPHICS: August 2020 REBGV Greater Vancouver Market Reports

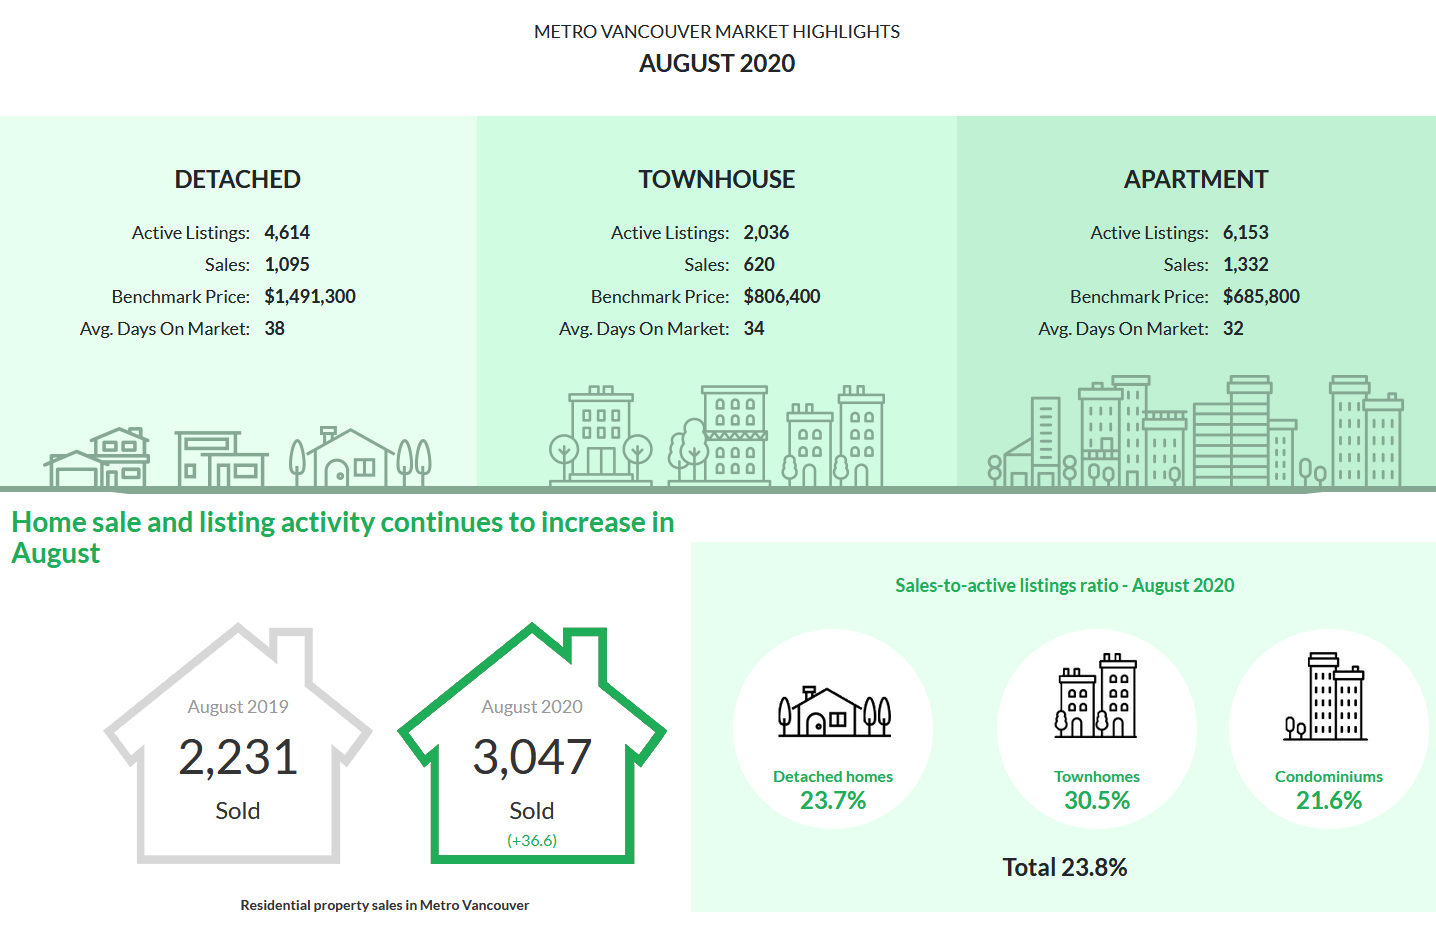
Home sale and listing activity continues to increase in August
Home buyers and sellers remained active across Metro Vancouver in August, with home sale and new listing activity outpacing the region’s historical averages.
The Real Estate Board of Greater Vancouver (REBGV) reports that residential home sales in the region totalled 3,047 in August 2020, a 36.6% increase from the 2,231 sales recorded in August 2019, and a 2.6% decrease from the 3,128 homes sold in July 2020.
Last month’s sales were 19.9% above the 10-year August sales average.
Read the full report on the REBGV website!
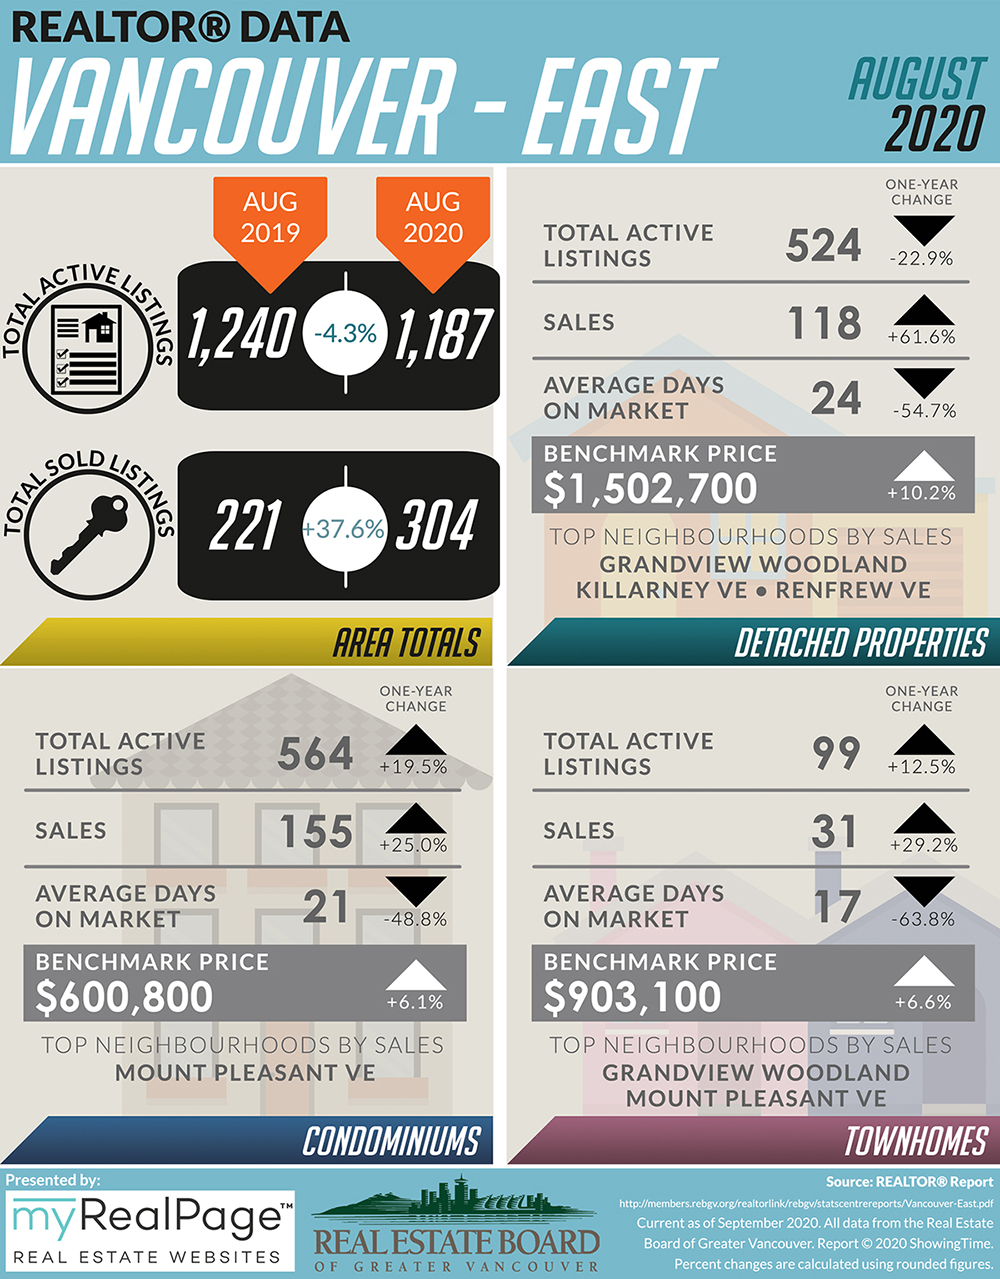
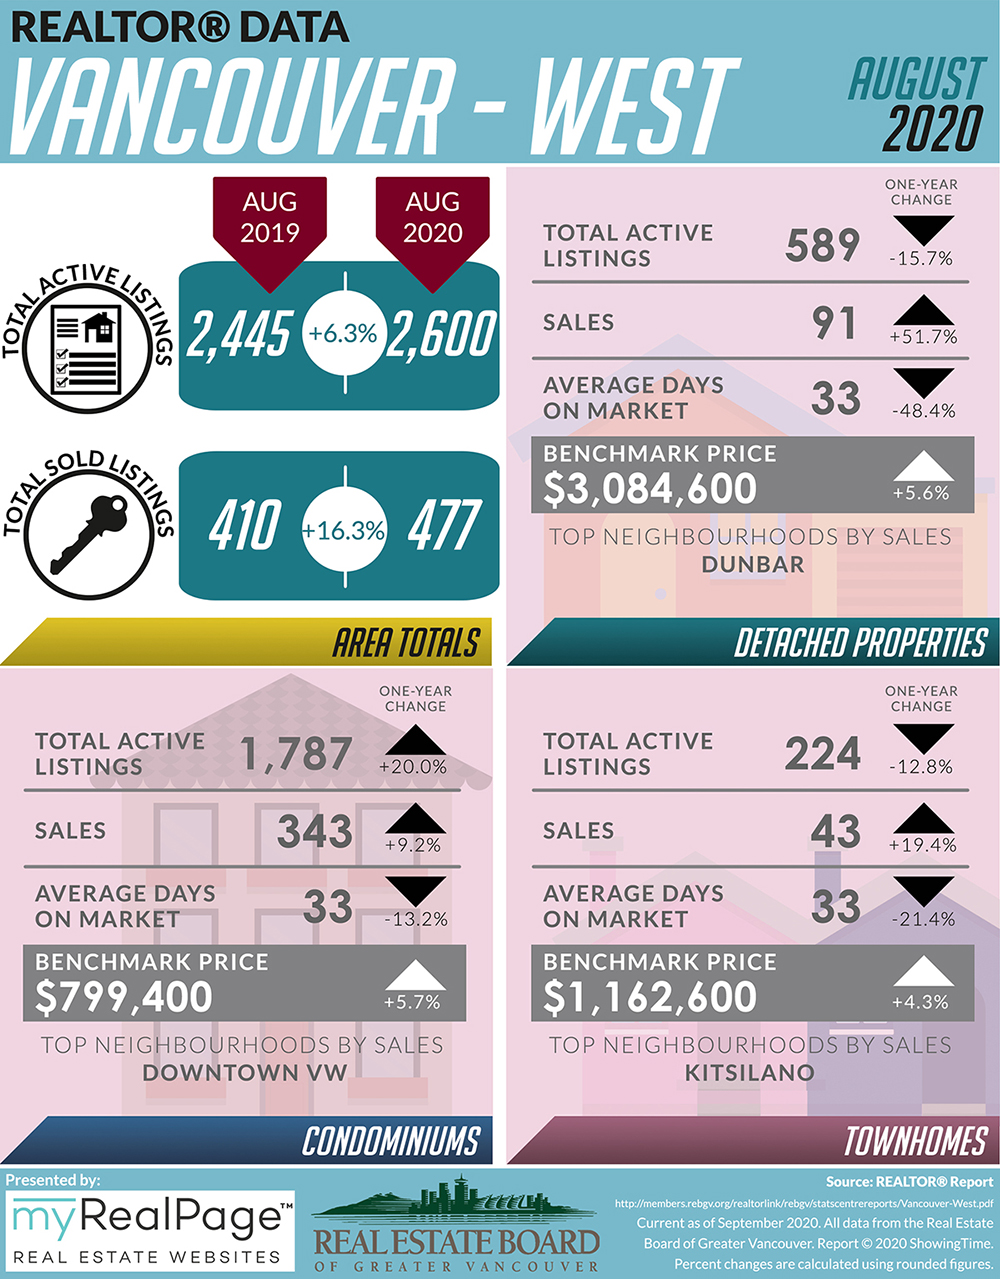
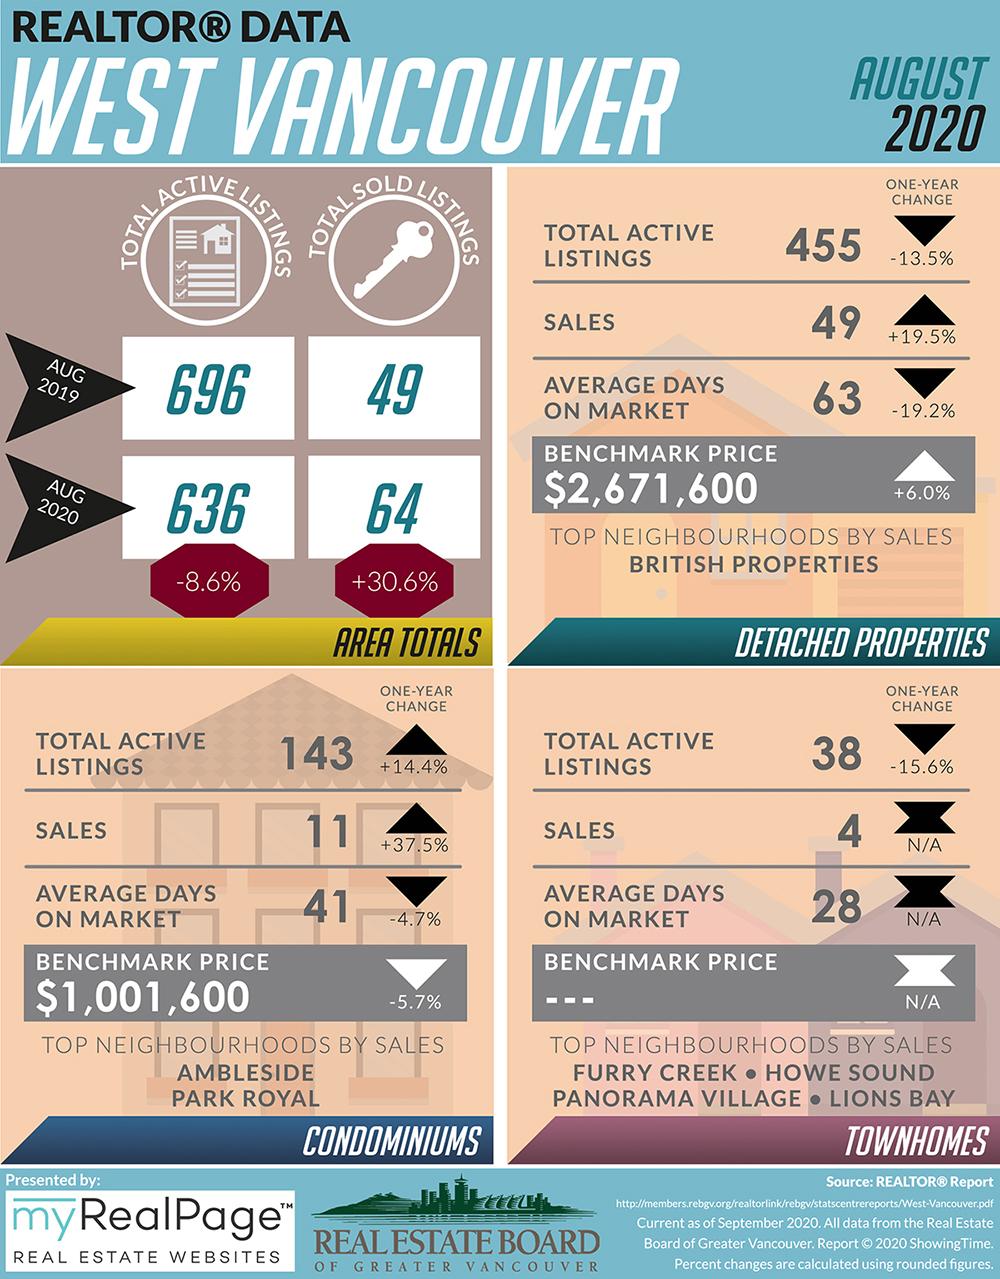
The following data is a comparison between August 2019 and August 2020 numbers, and is current as of September 2020. For last month’s update, you can check out our previous post for July 2020 data.
Or follow this link for all our REBGV Infographics!
These infographics cover current trends in North Vancouver, West Vancouver, Vancouver East, and Vancouver West. Click on the images for a larger view! (Protip: Make sure to grab the printable PDF versions, too! It fits best when printed on A4-sized sheets, AND we’ve added an area on the sheet where you can attach your business card! 🙂 )
Download Printable Version – REBGV August 2020 Data Infographics

-
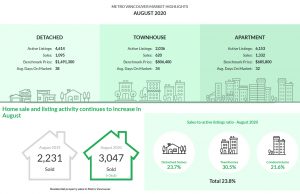
- (Image from REBGV website)
-

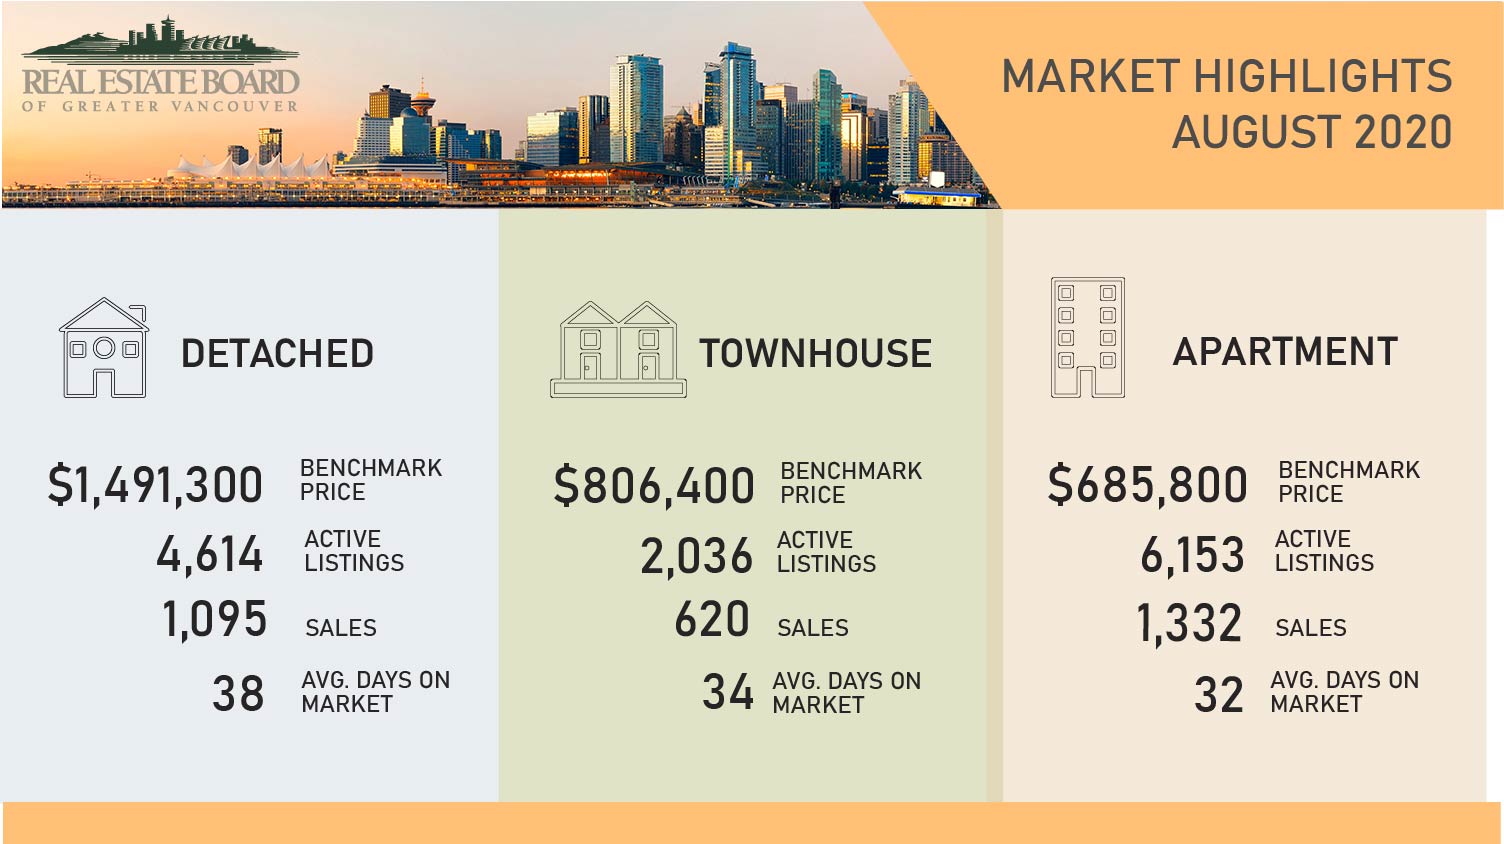
- (Image from REBGV Twitter)
Last Updated on November 28, 2023 by myRealPage
