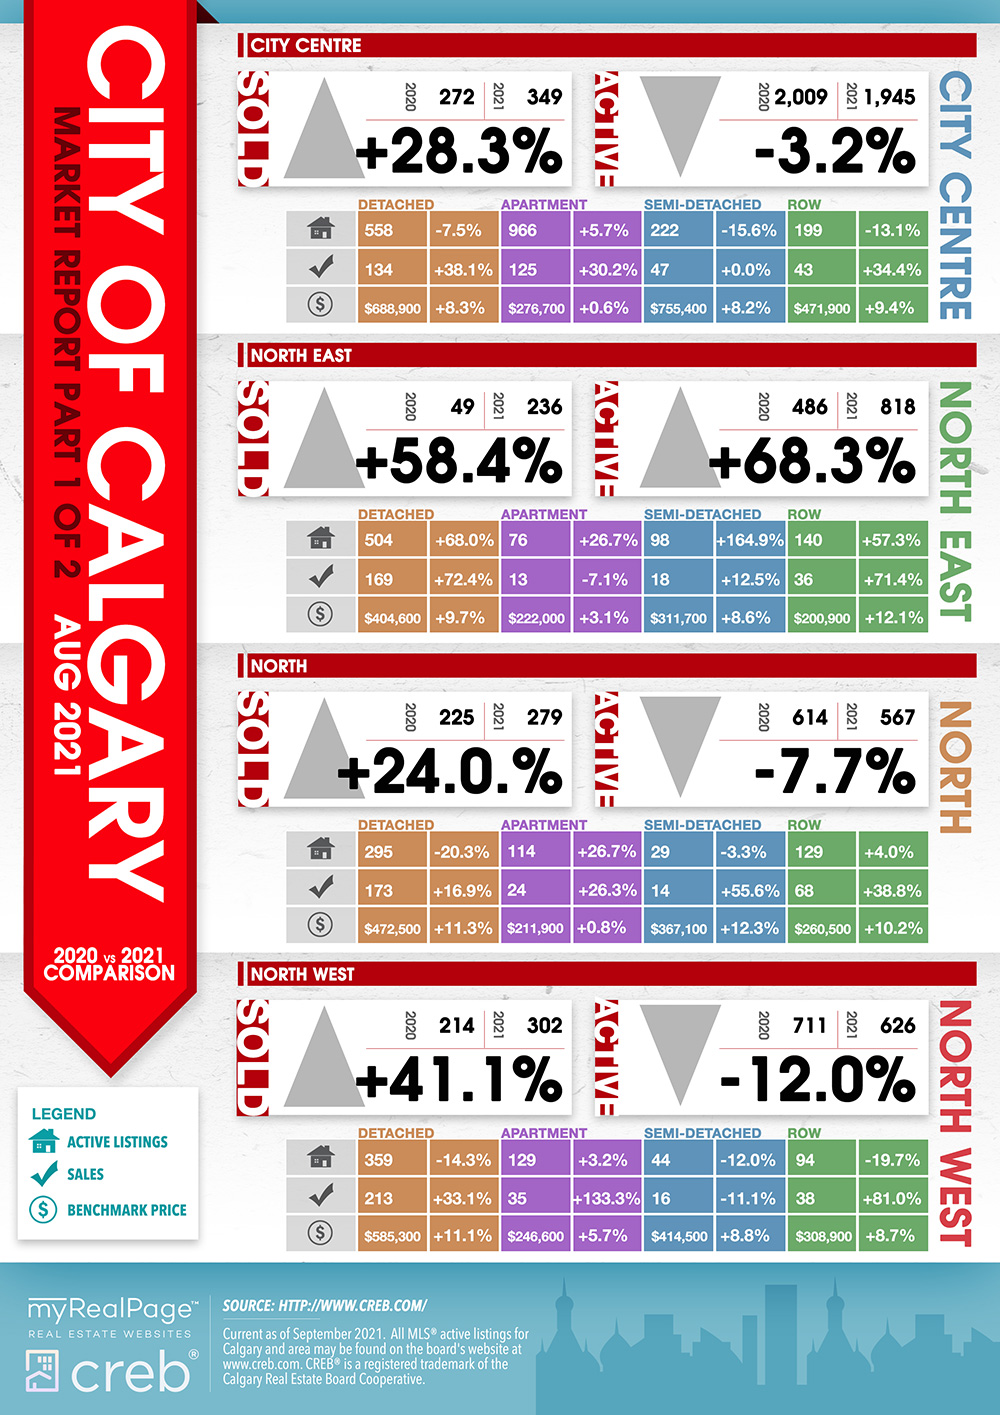
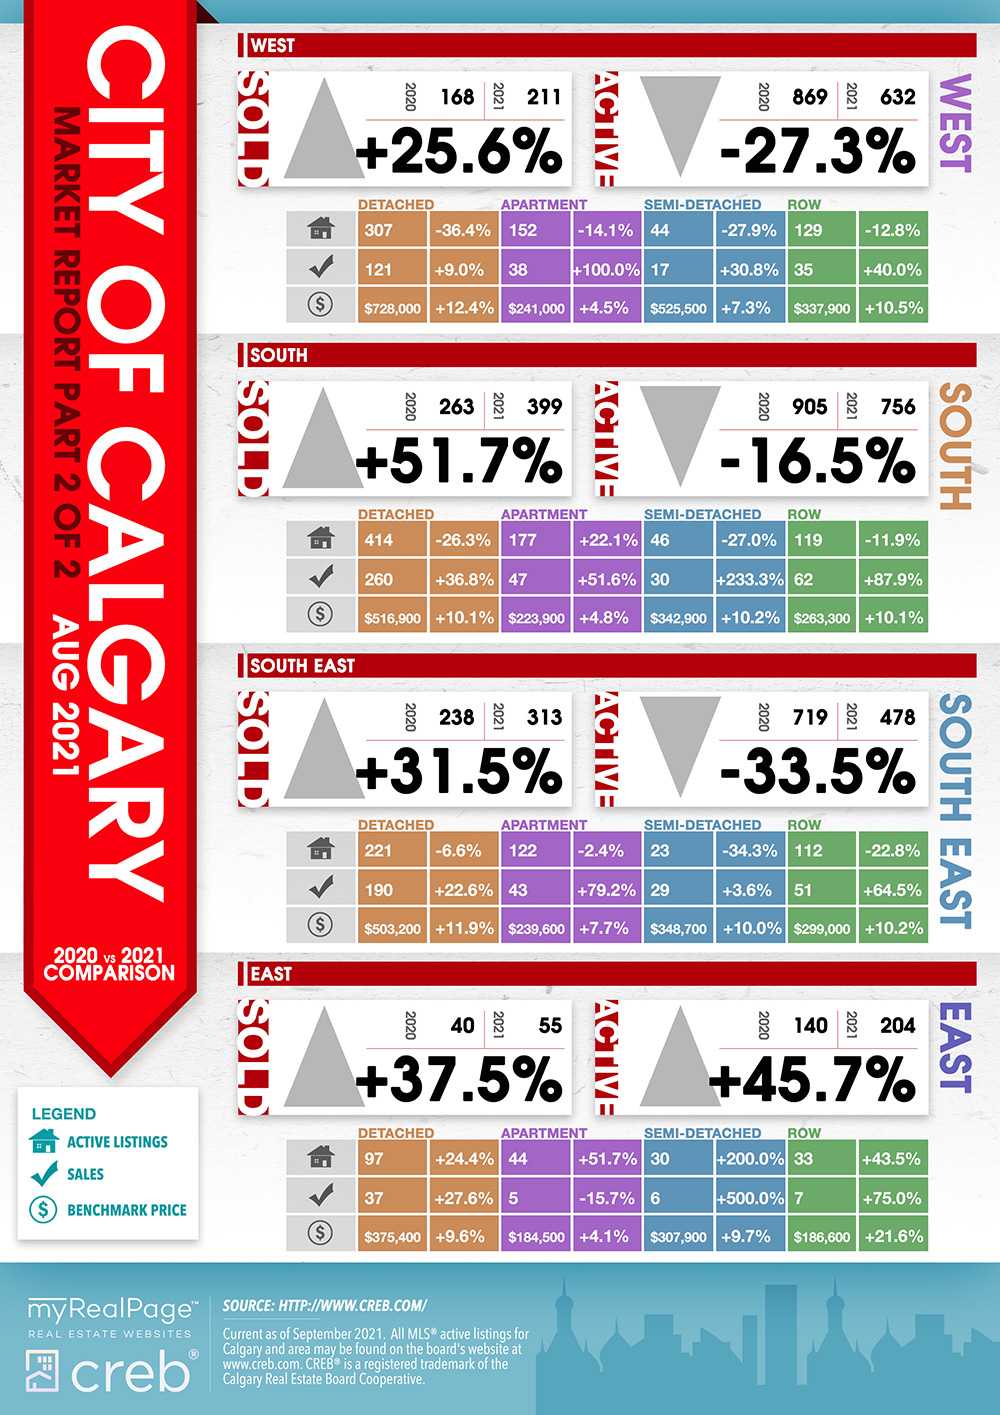
INFOGRAPHICS: August 2021 CREB City And Region Market Reports

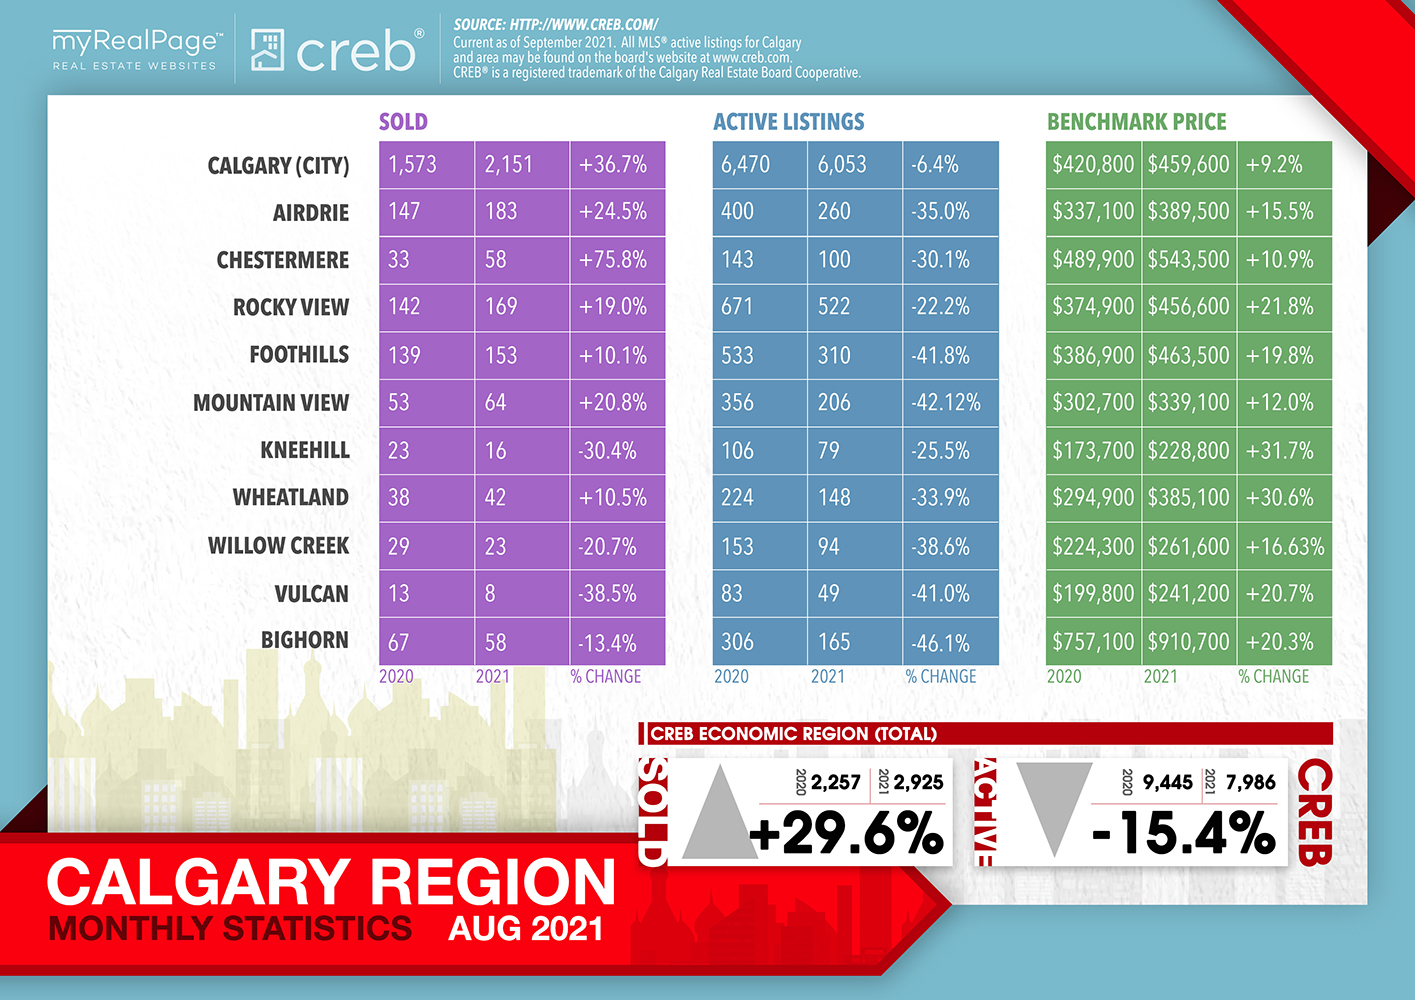
Market continues shift toward more balanced conditions after torrid start to the year
Citywide sales in August reached 2,151 units, 37% higher than last year and 25% higher than long-term trends. Sales have slowed from the record-setting pace seen earlier this year, but on a year-to-date basis, the eight-month total of 19,516 sales is higher than annual sales figures recorded over the past six years.
“Sales have far exceeded expectations throughout most of the pandemic, driven mostly by demand for detached homes. At the same time, supply could not keep pace and conditions shifted to favour the seller, something that has not happened in over six years,” said CREB® chief economist Ann-Marie Lurie.
Read the full report on the CREB website!
The following data is a comparison between August 2020 and August 2021 numbers, and is current as of September 2021. For last month’s numbers, check out our previous infographic.
Or follow this link for all our CREB Infographics!
Click on the images for a larger view! (Protip: Make sure to grab the printable PDF versions, too! It fits best when printed on A4-sized sheets, AND we’ve added an area on the sheet where you can attach your business card! 🙂 )
Download Printable Version – August 2021 CREB, City of Calgary Report
Download Printable Version – August 2021 CREB, Calgary Region Report
Last Updated on July 25, 2022 by myRealPage
