INFOGRAPHICS: July 2021 CREB City And Region Market Reports

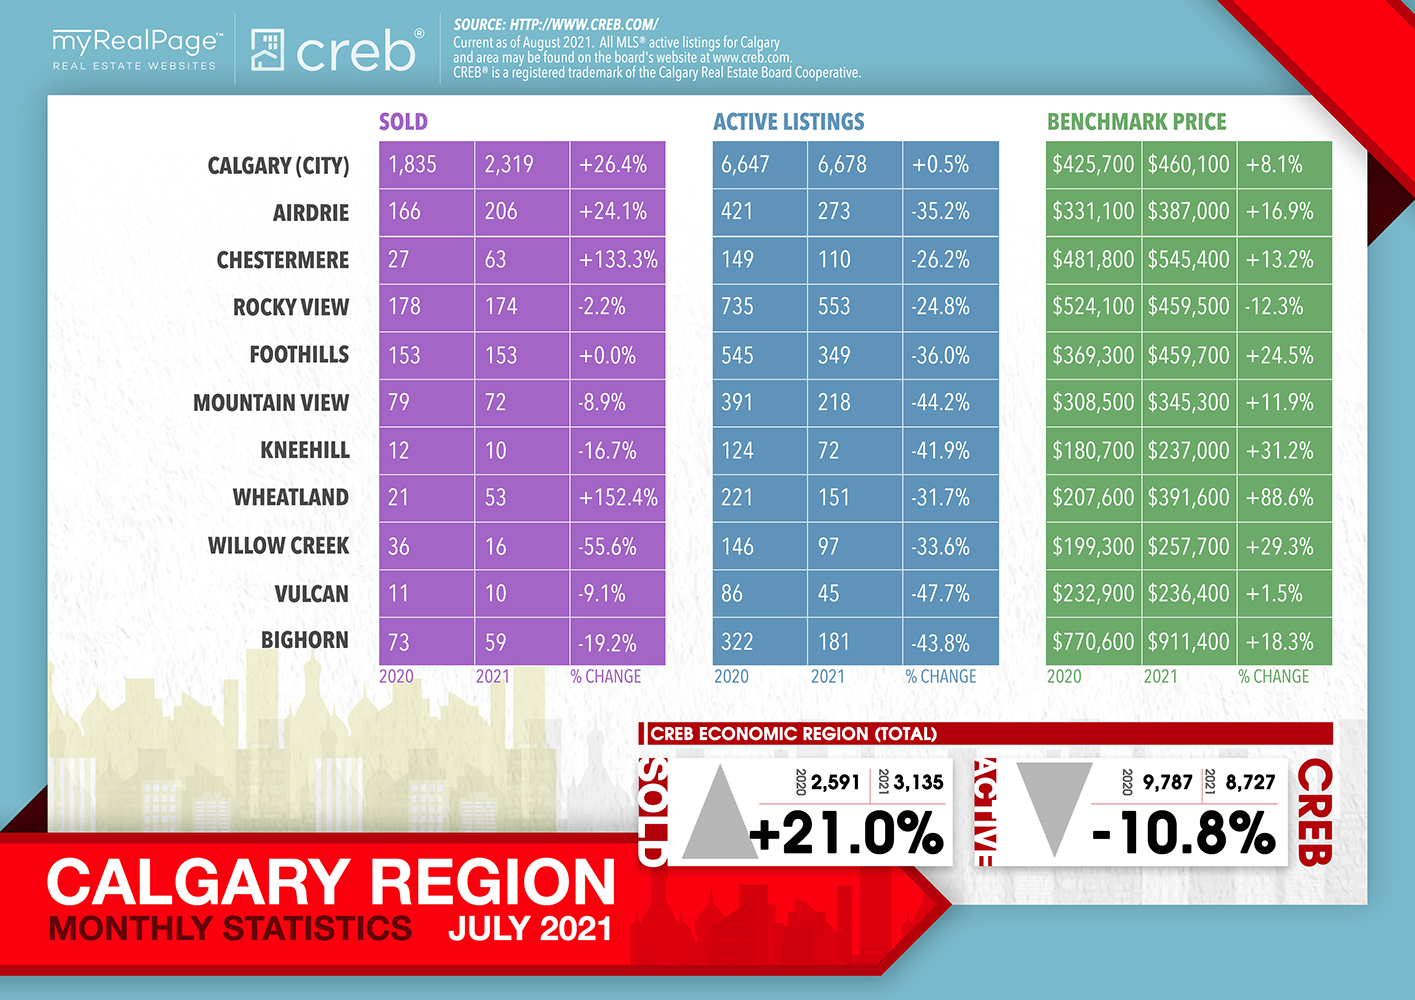
Price growth slows as supply to demand balance improves
July sales totaled 2,319 units, which is well above long-term averages and the best July on record. The pace of sales growth has eased over the past few months, but so too has the pace of new listings growth. This has helped prevent any further monthly gains in inventory levels, and while overall supply remains slightly higher than last July, it’s mostly due to gains in apartment and row product.
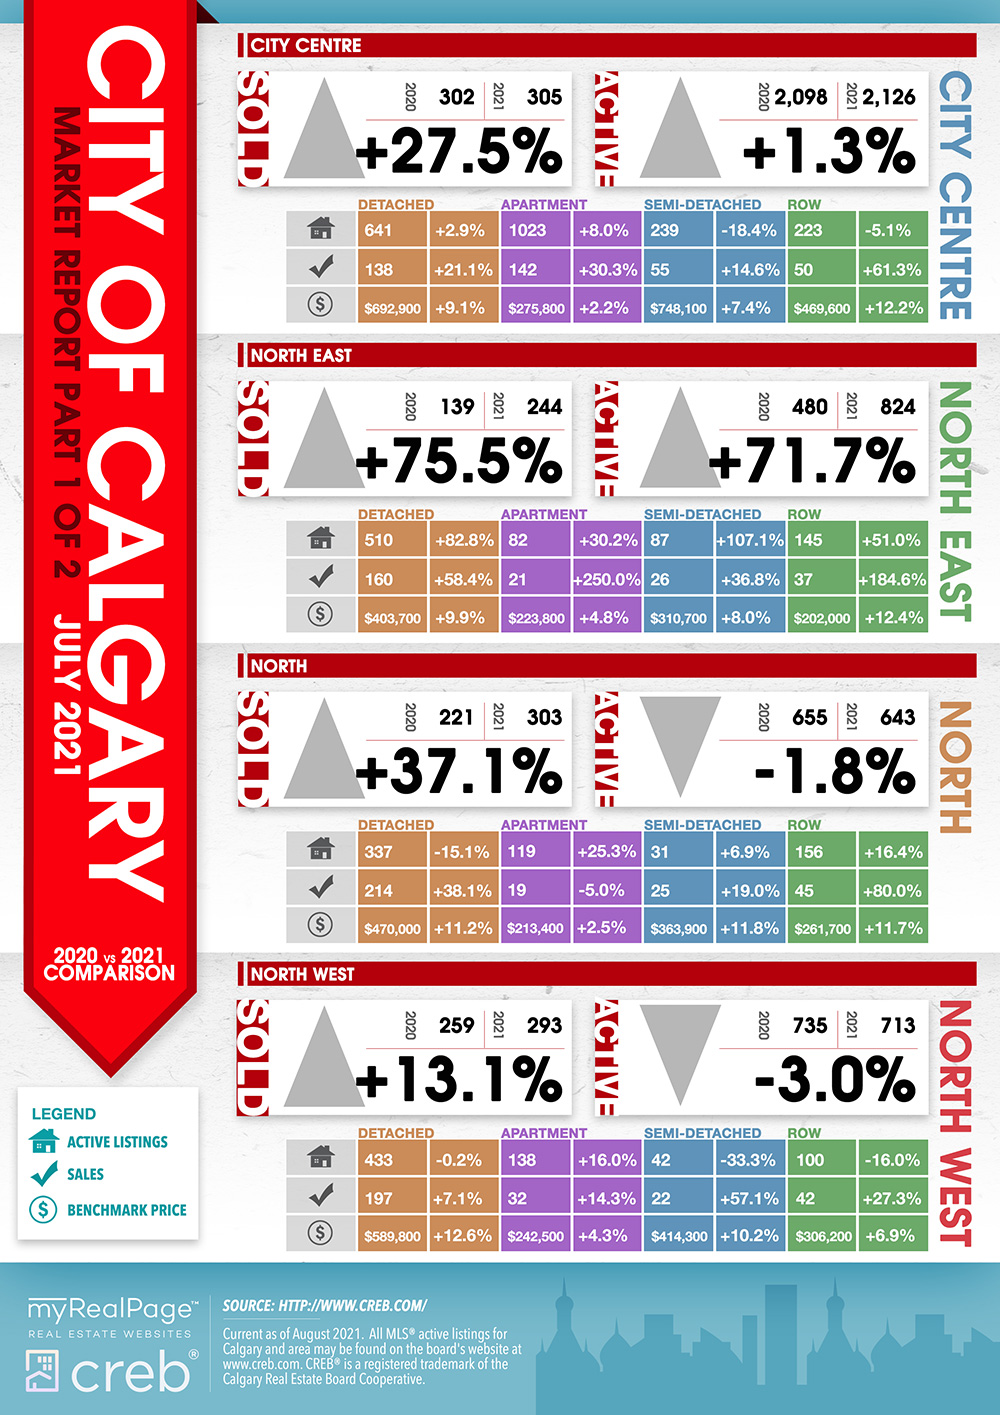
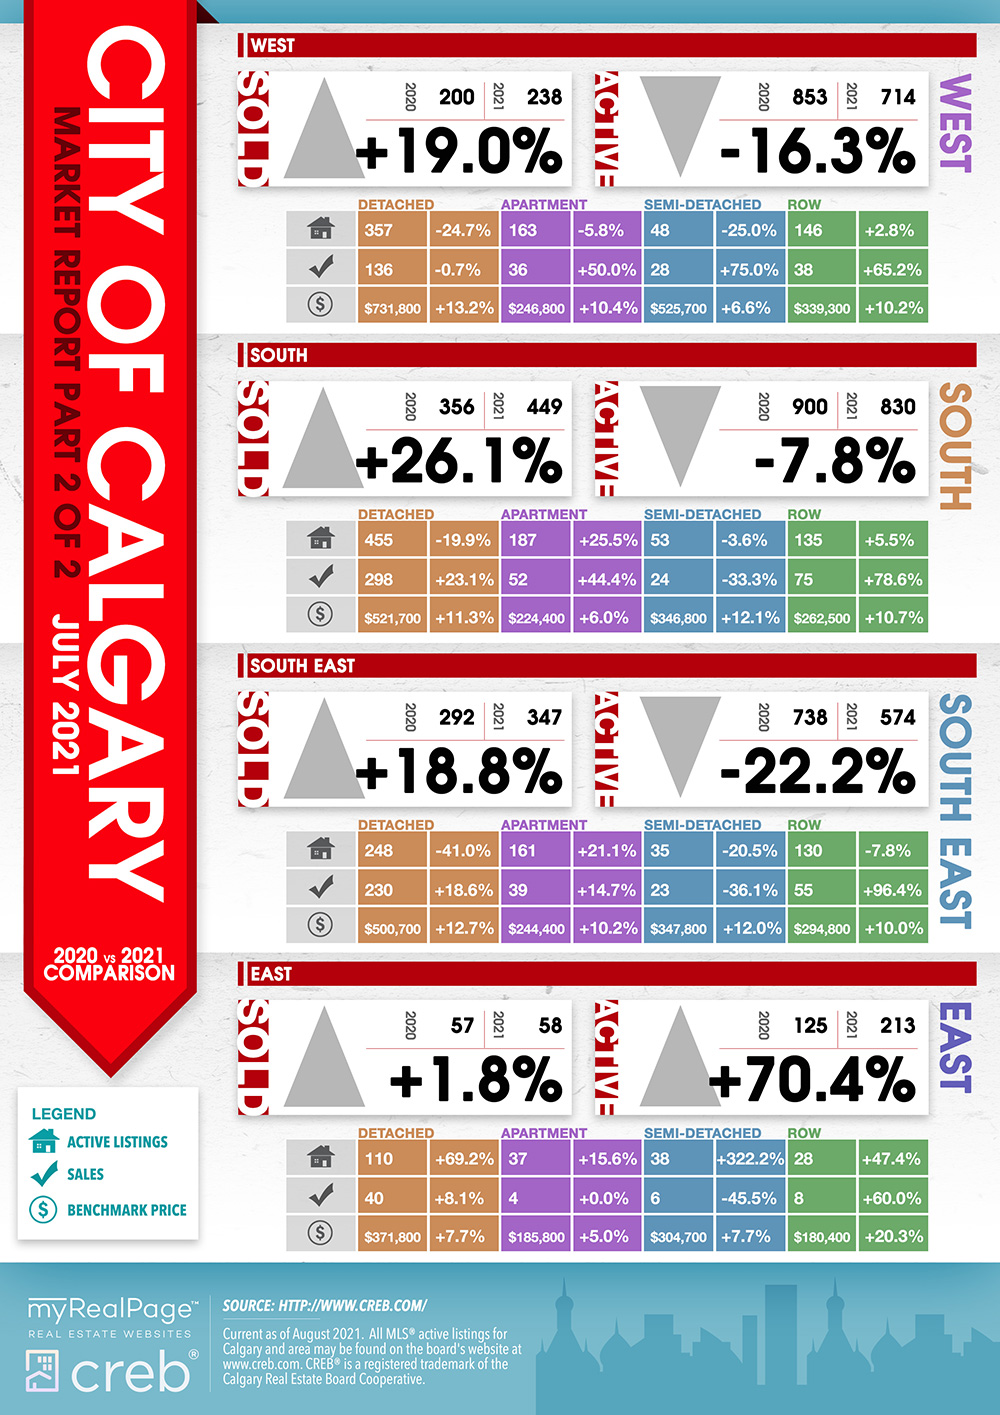
With 6,678 units in inventory in July, the months of supply rose to just under three months. These gains are leading to far more balance between sellers and buyers. However, there is a significant variation between product type, as the months of supply ranged from two months in the detached sector to nearly six months in the apartment condominium sector.
Read the full report on the CREB website!
The following data is a comparison between July 2020 and July 2021 numbers, and is current as of August 2021. For last month’s numbers, check out our previous infographic.
Or follow this link for all our CREB Infographics!
Click on the images for a larger view! (Protip: Make sure to grab the printable PDF versions, too! It fits best when printed on A4-sized sheets, AND we’ve added an area on the sheet where you can attach your business card! 🙂 )
Download Printable Version – July 2021 CREB, City of Calgary Report
Download Printable Version – July 2021 CREB, Calgary Region Report
Last Updated on July 25, 2022 by myRealPage
