INFOGRAPHICS: August 2021 FVREB Fraser Valley, South Surrey, Etc. Market Reports

A market of extremes: near record sales in August combined with lowest supply in four decades
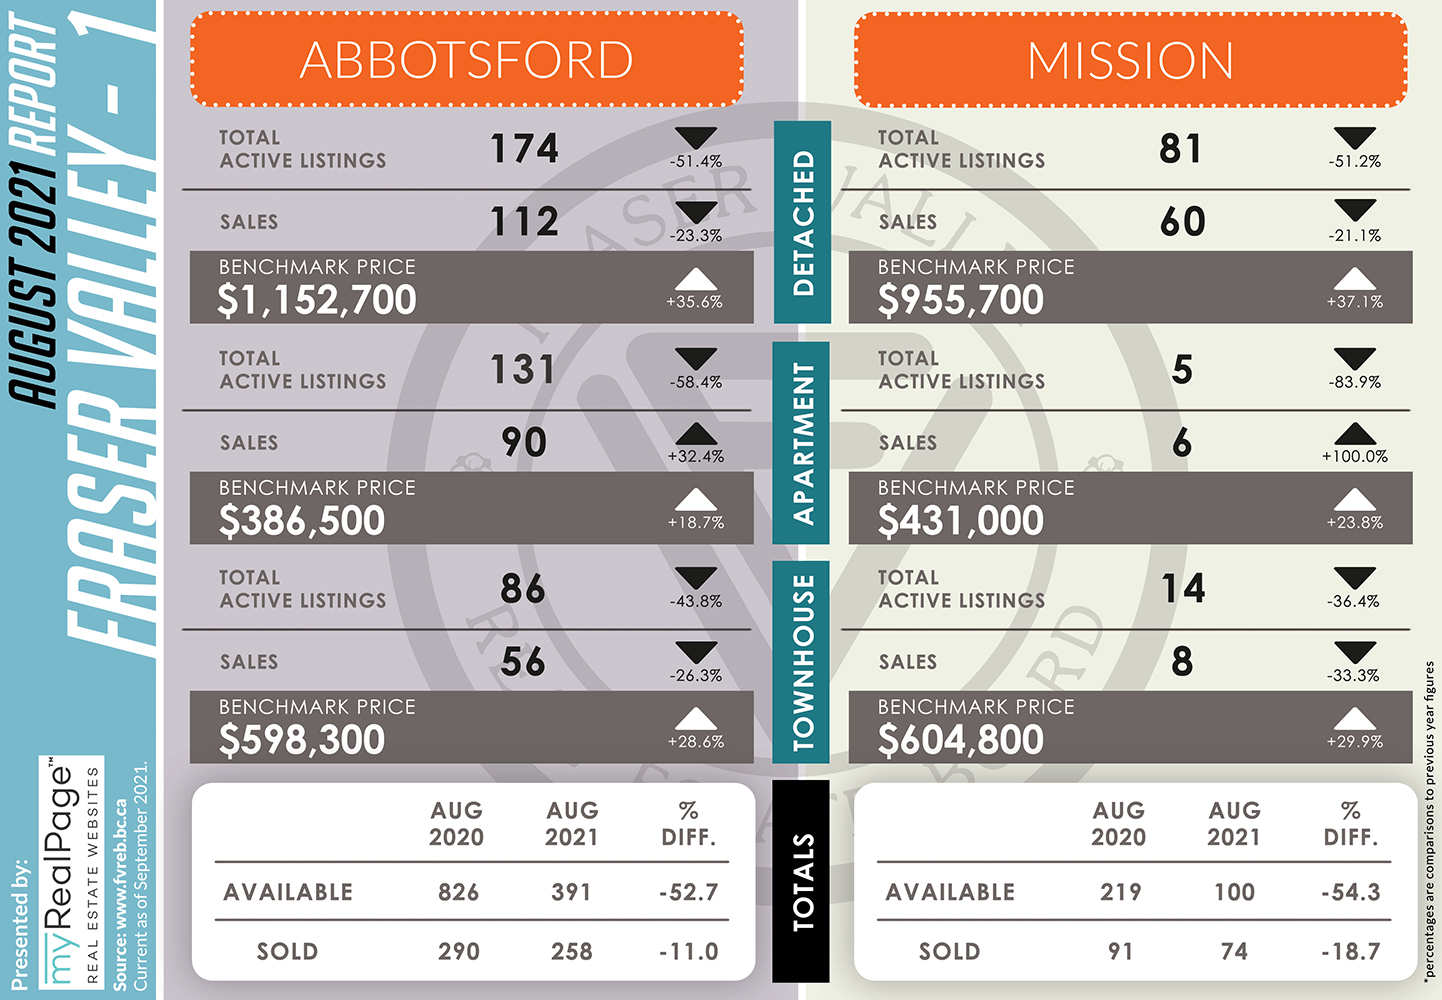
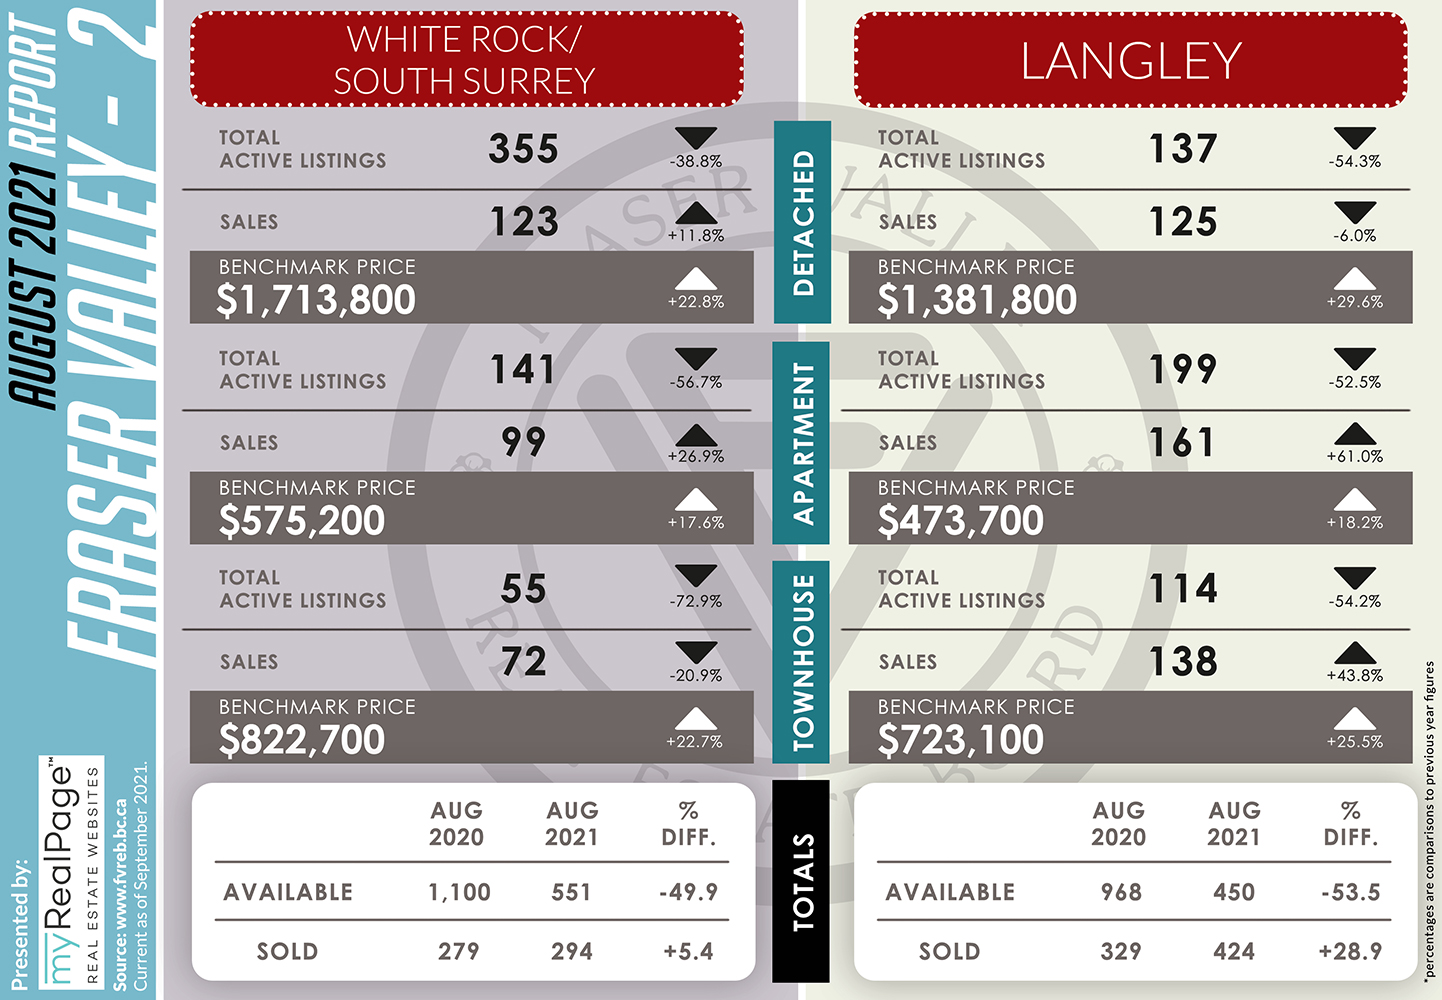
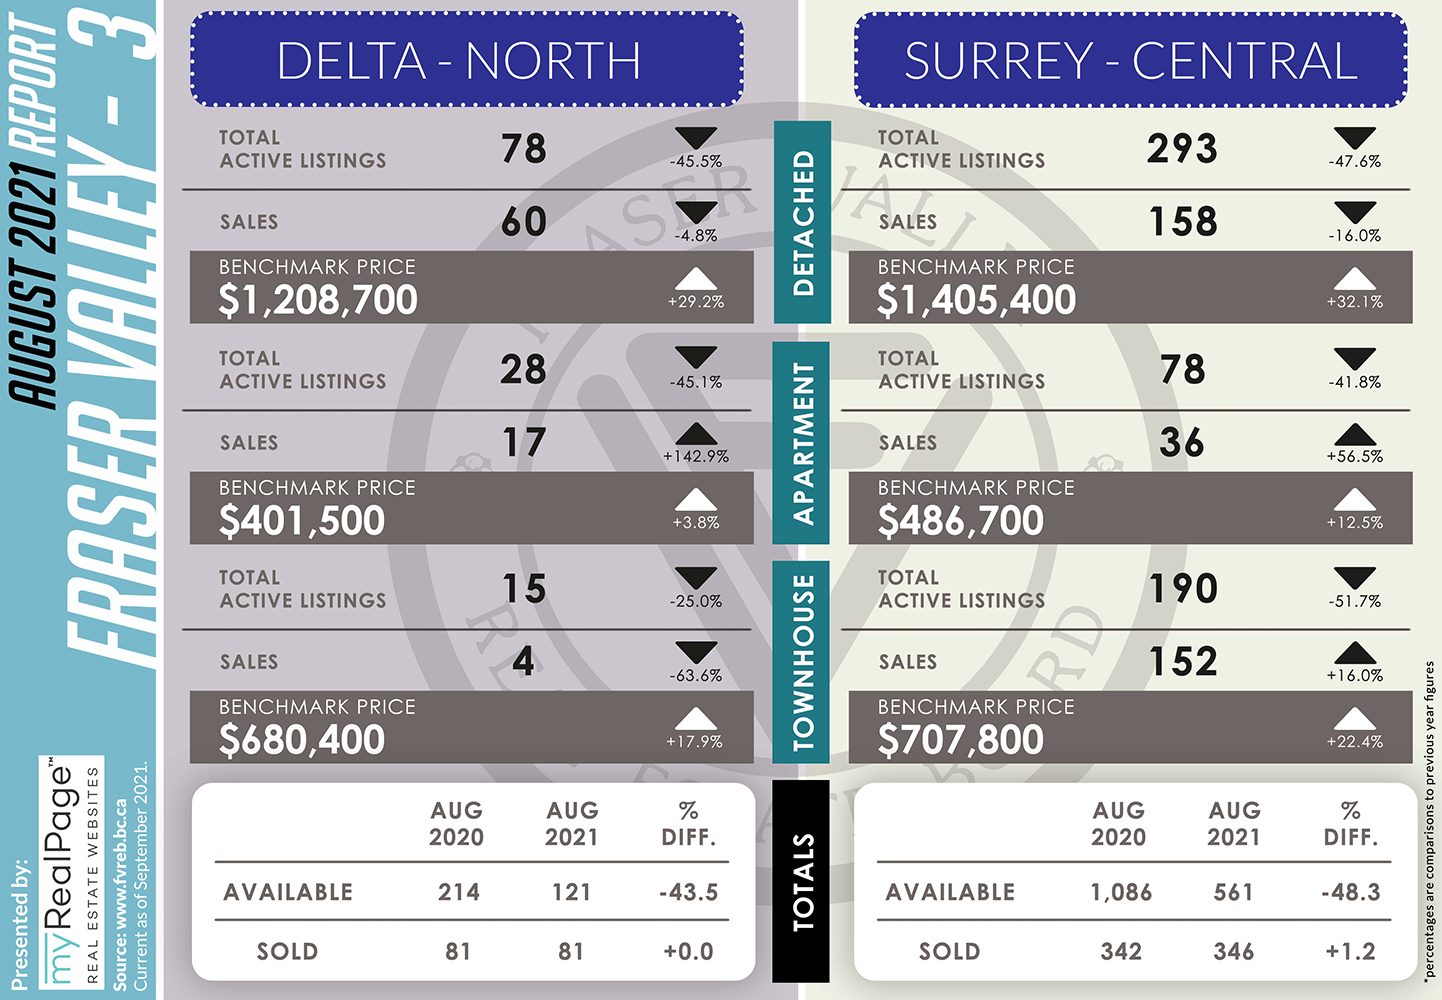
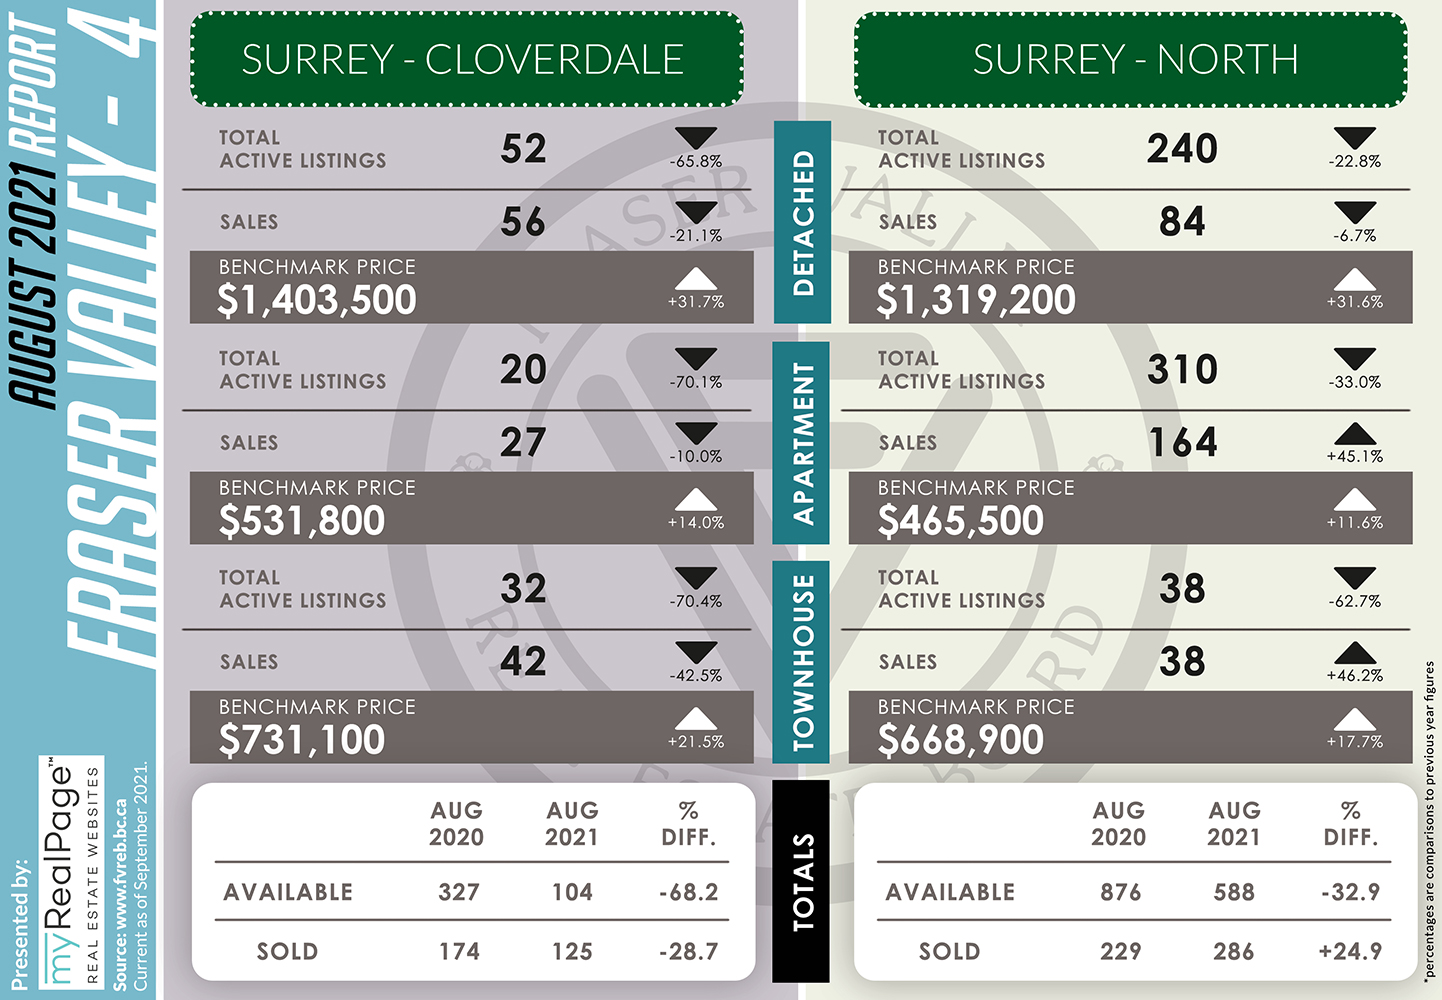
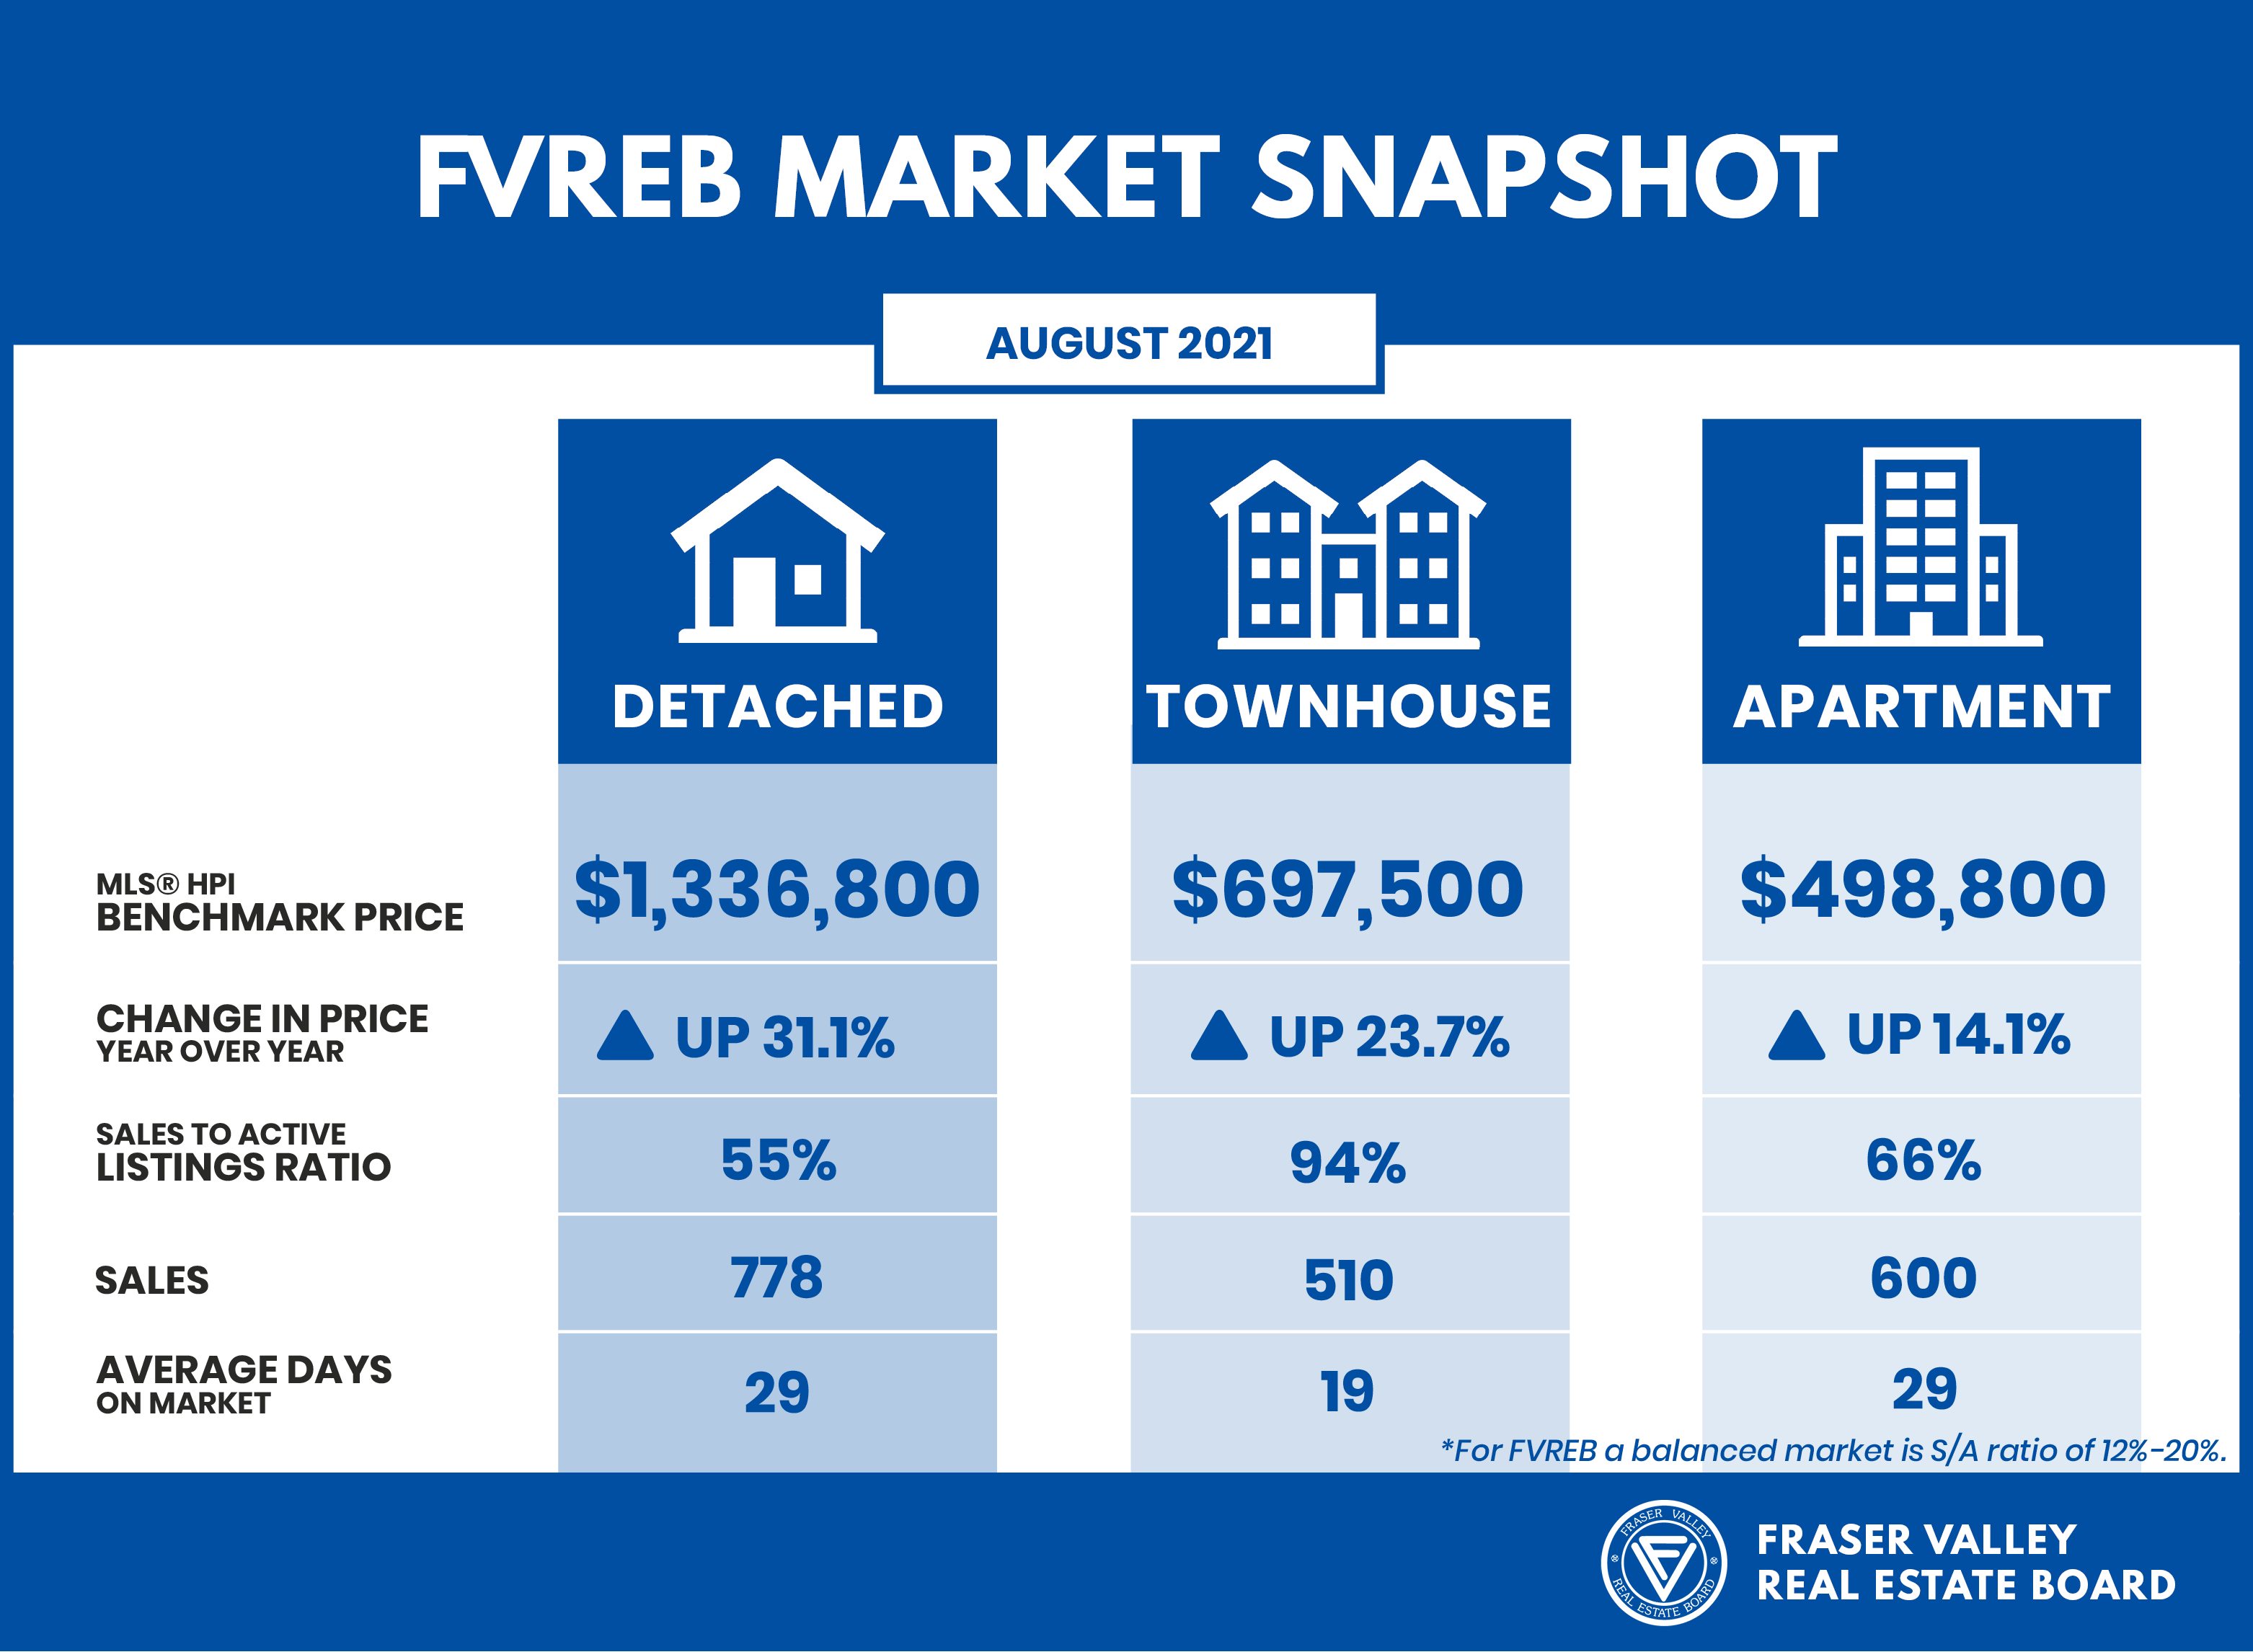
Demand for Fraser Valley real estate remained elevated in August reaching the second highest sales ever for the month against a backdrop of decreasing supply.
The Board processed a total of 2,087 property sales on its Multiple Listing Service® (MLS®) in August, an increase of 4.0% compared to July and a 2.4% increase compared to the same month last year. Sales remained unusually high for the month; second only to August of 2005.
Larry Anderson, President of the Board, said, “Home buyers are facing one of the worst supply shortages in Fraser Valley history. Our sales are over 30% above normal, while our housing stock is at levels last seen in the early 80s.”
Read the full report on the FVREB website!
The following data is a comparison between August 2020 and August 2021 numbers, and is current as of September 2021. For last month’s report, check out our previous infographic!
Or follow this link for all our FVREB Infographics!
These infographics cover current trends in Fraser Valley neighbourhoods that are within the FVREB. Click on the images for a larger view! (Protip: Make sure to grab the printable PDF version, too! It fits best when printed on A4-sized sheets, AND we’ve added an area on the sheet where you can attach your business card! 🙂 )
Download Printable Version – FVREB August 2021 Market Report
Last Updated on July 25, 2022 by myRealPage
