INFOGRAPHICS: July 2021 FVREB Fraser Valley, South Surrey, Etc. Market Reports

Fraser Valley home sales remained steady in July; lowest supply in forty years
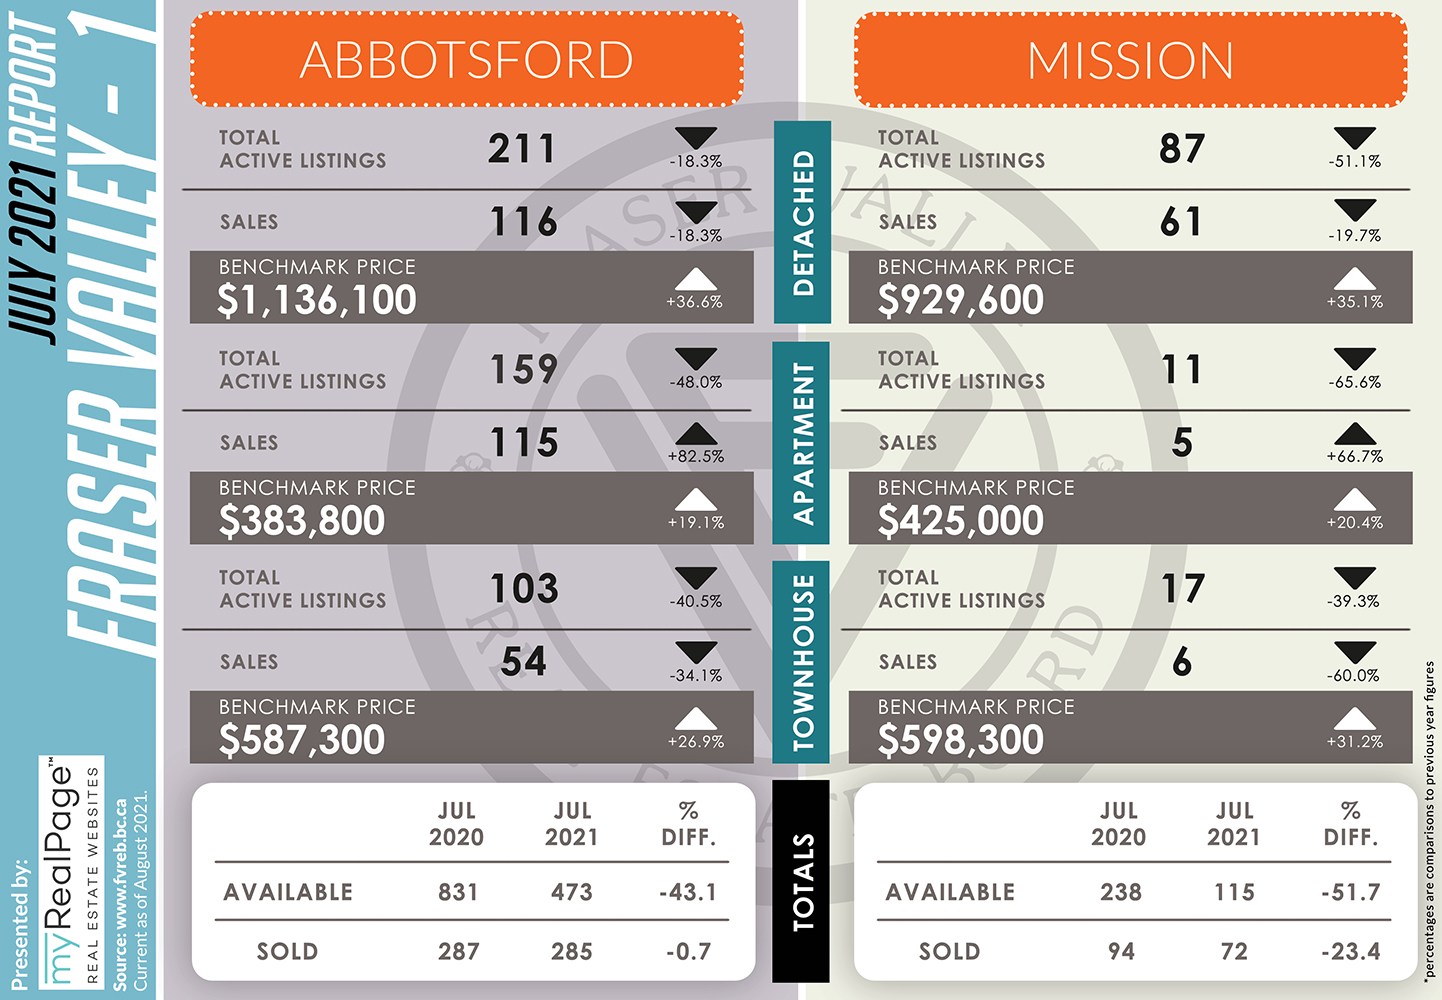
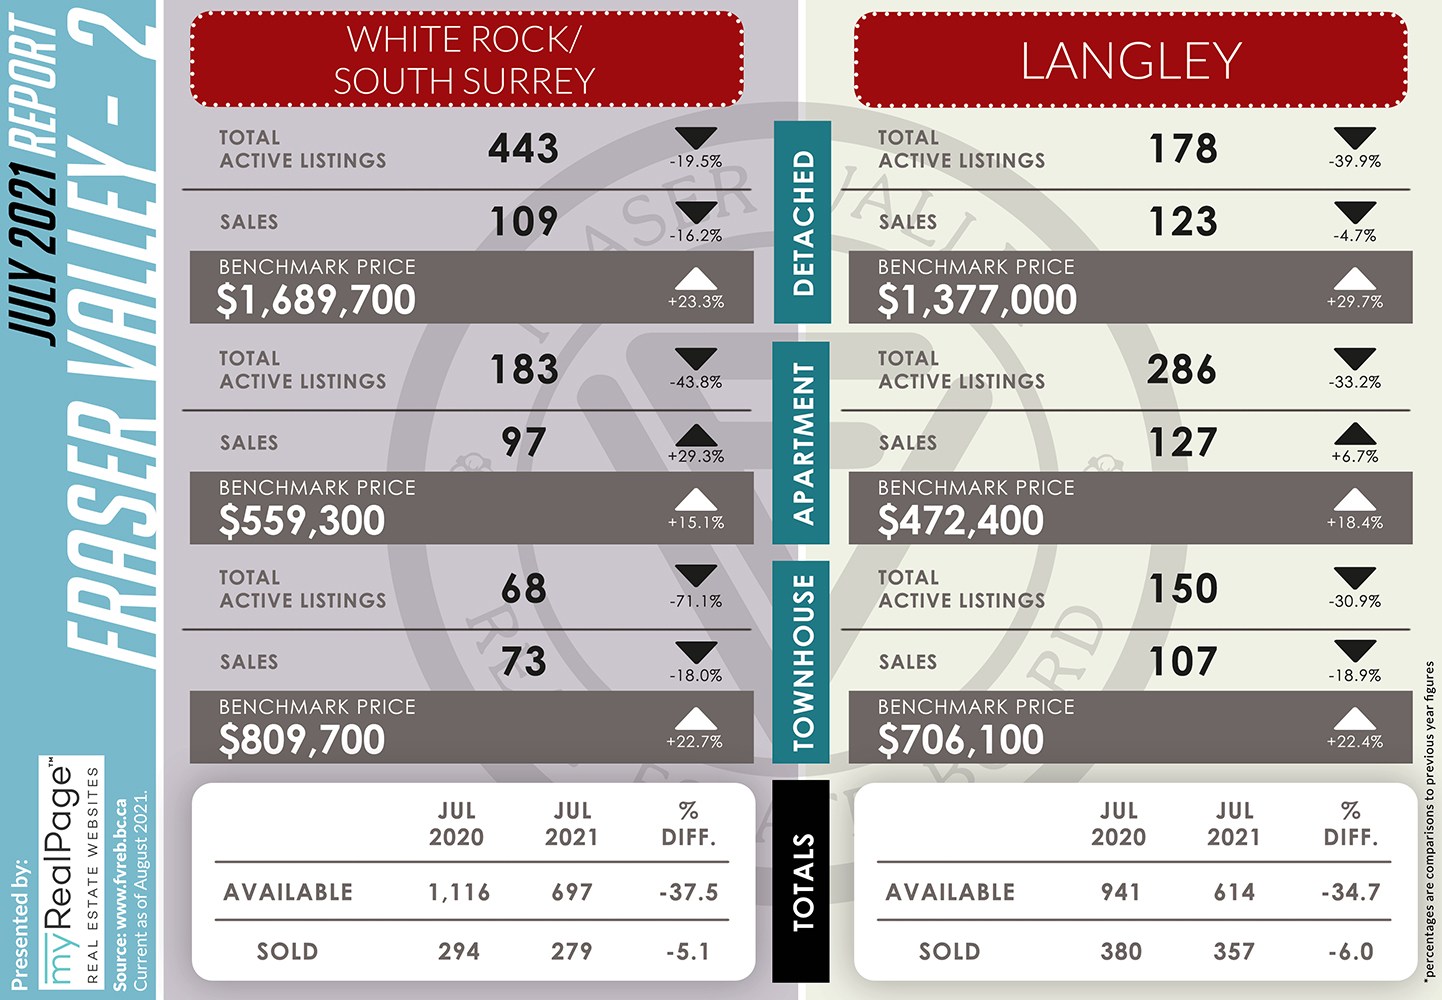
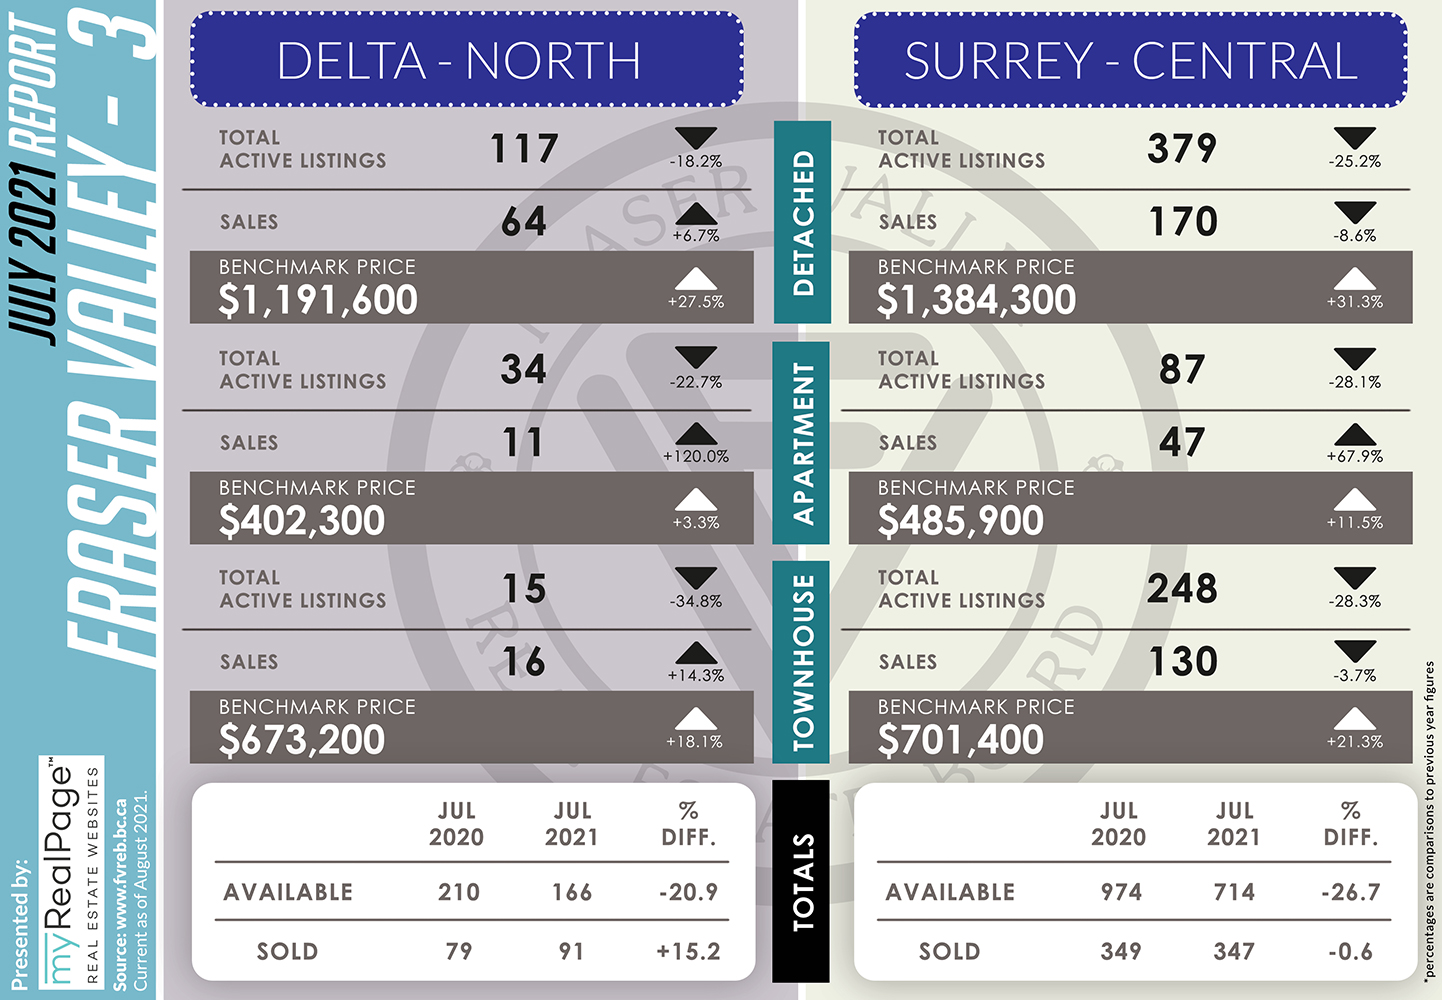
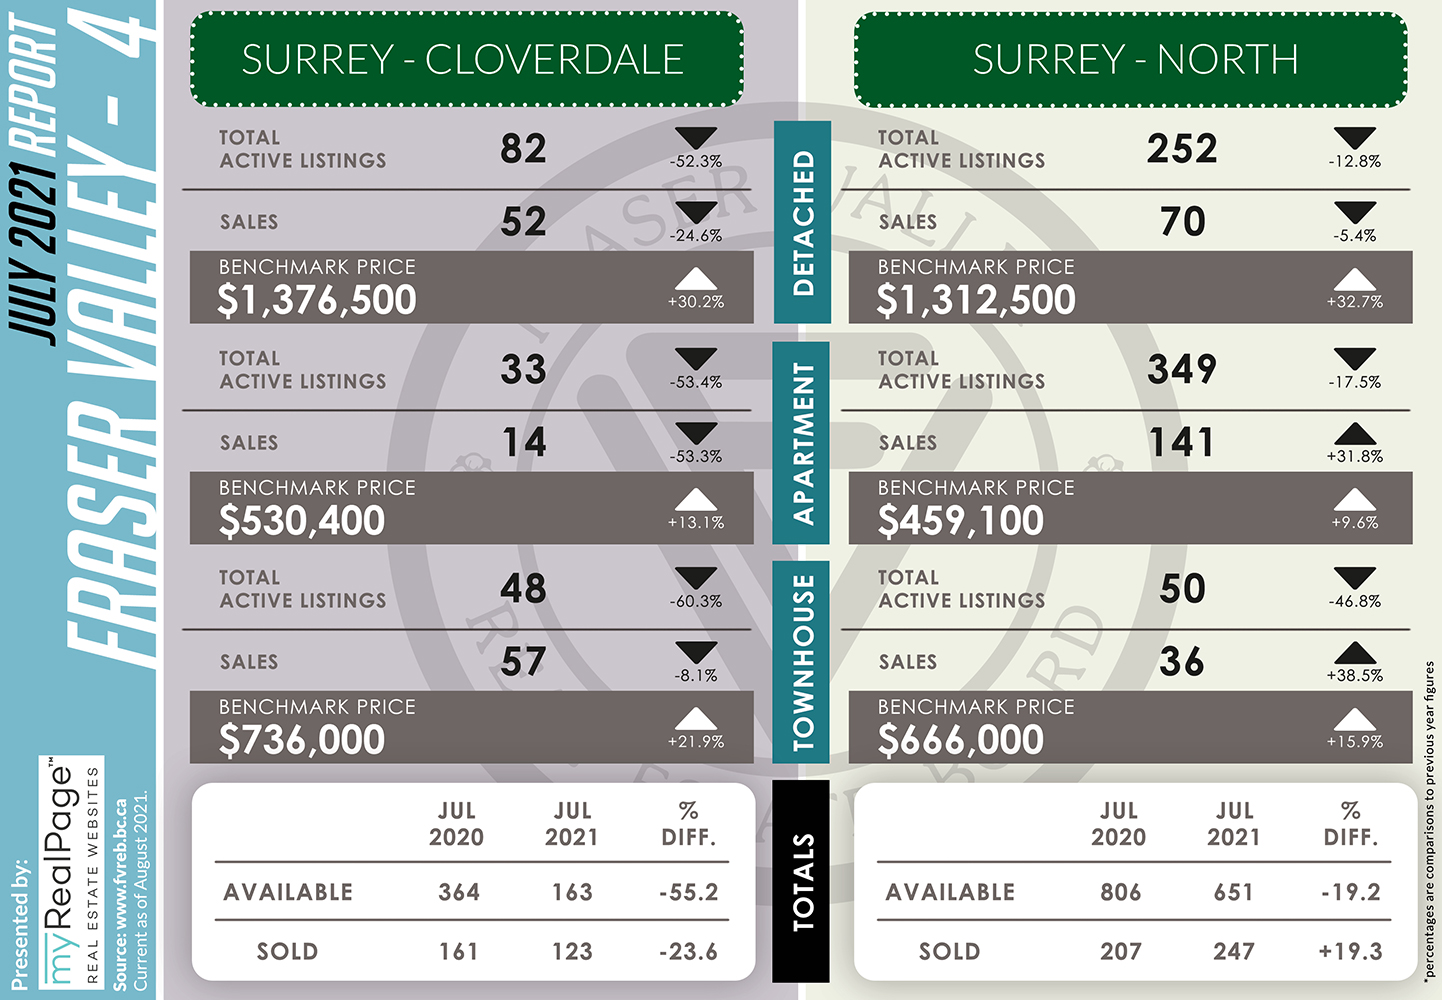
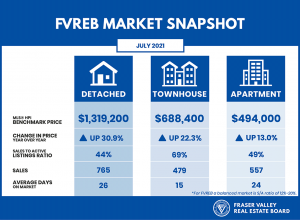
Market activity in the Fraser Valley – both sales and new listings – softened in July, however buyers continued to significantly outnumber sellers resulting in inventory reaching the lowest for the month since 1981.
The Board processed a total of 2,006 property sales on its Multiple Listing Service® (MLS®) in July, a decrease of 11 % compared to June and a 4.5% decrease compared to the same month last year. Sales continued to remain above normal for July – 15% above the ten-year average.
Read the full report on the FVREB website!
The following data is a comparison between July 2020 and July 2021 numbers, and is current as of August 2021. For last month’s report, check out our previous infographic!
Or follow this link for all our FVREB Infographics!
These infographics cover current trends in Fraser Valley neighbourhoods that are within the FVREB. Click on the images for a larger view! (Protip: Make sure to grab the printable PDF version, too! It fits best when printed on A4-sized sheets, AND we’ve added an area on the sheet where you can attach your business card! 🙂 )
Download Printable Version – FVREB July 2021 Market Report
-
- (from FVREB Twitter)

Last Updated on July 25, 2022 by myRealPage
