INFOGRAPHICS: June 2021 FVREB Fraser Valley, South Surrey, Etc. Market Reports
Mirroring the weather, Fraser Valley’s hot housing market cooled slightly in June going from a boil to a simmer
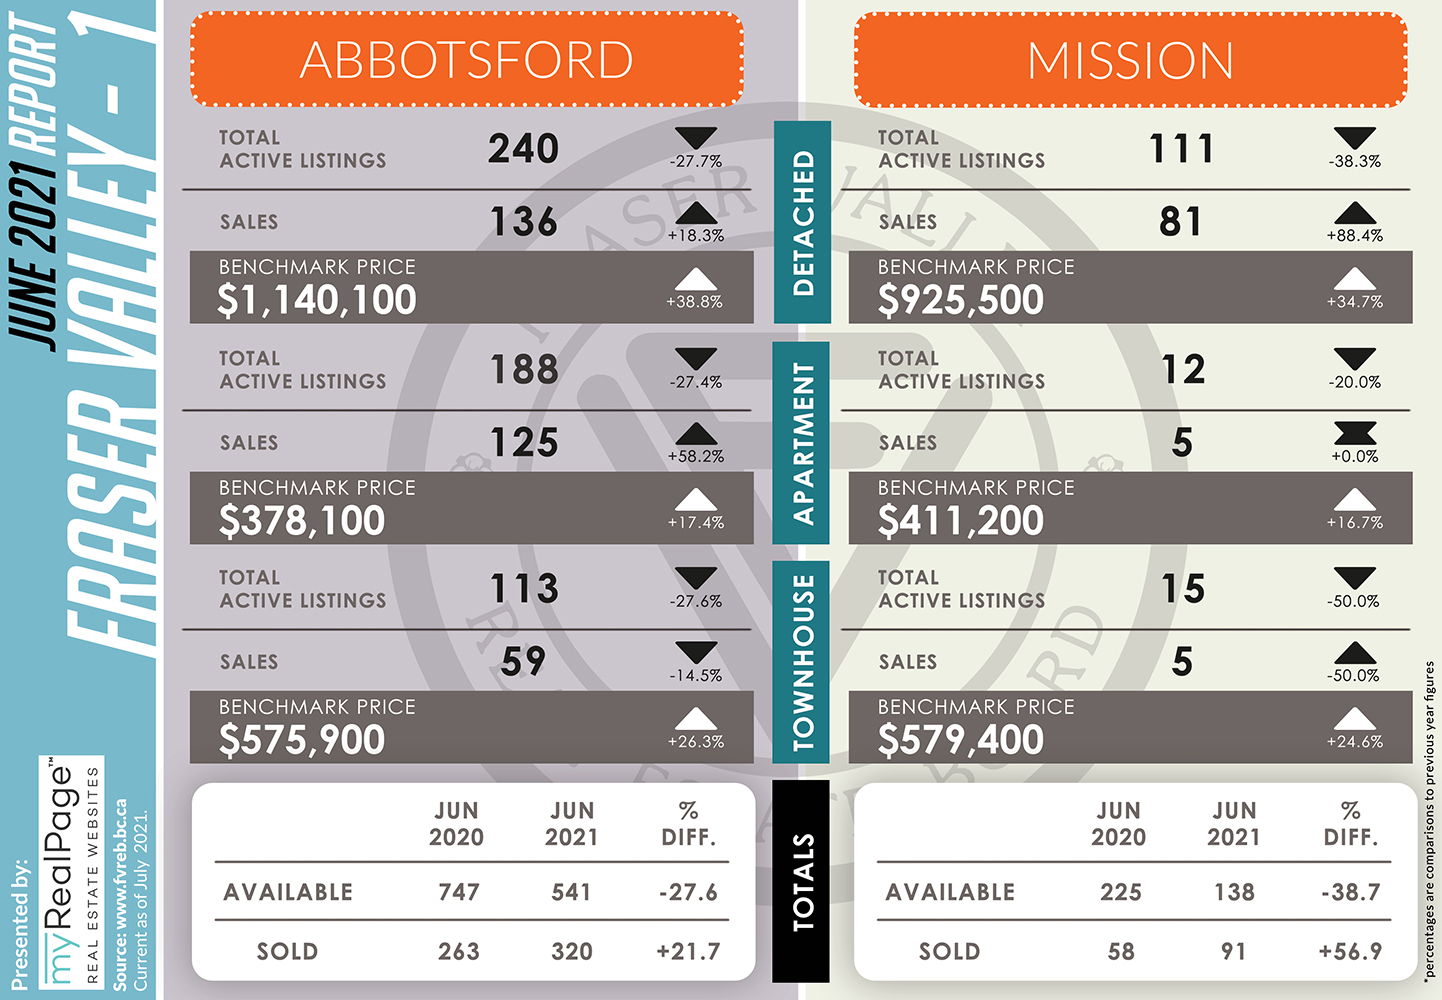
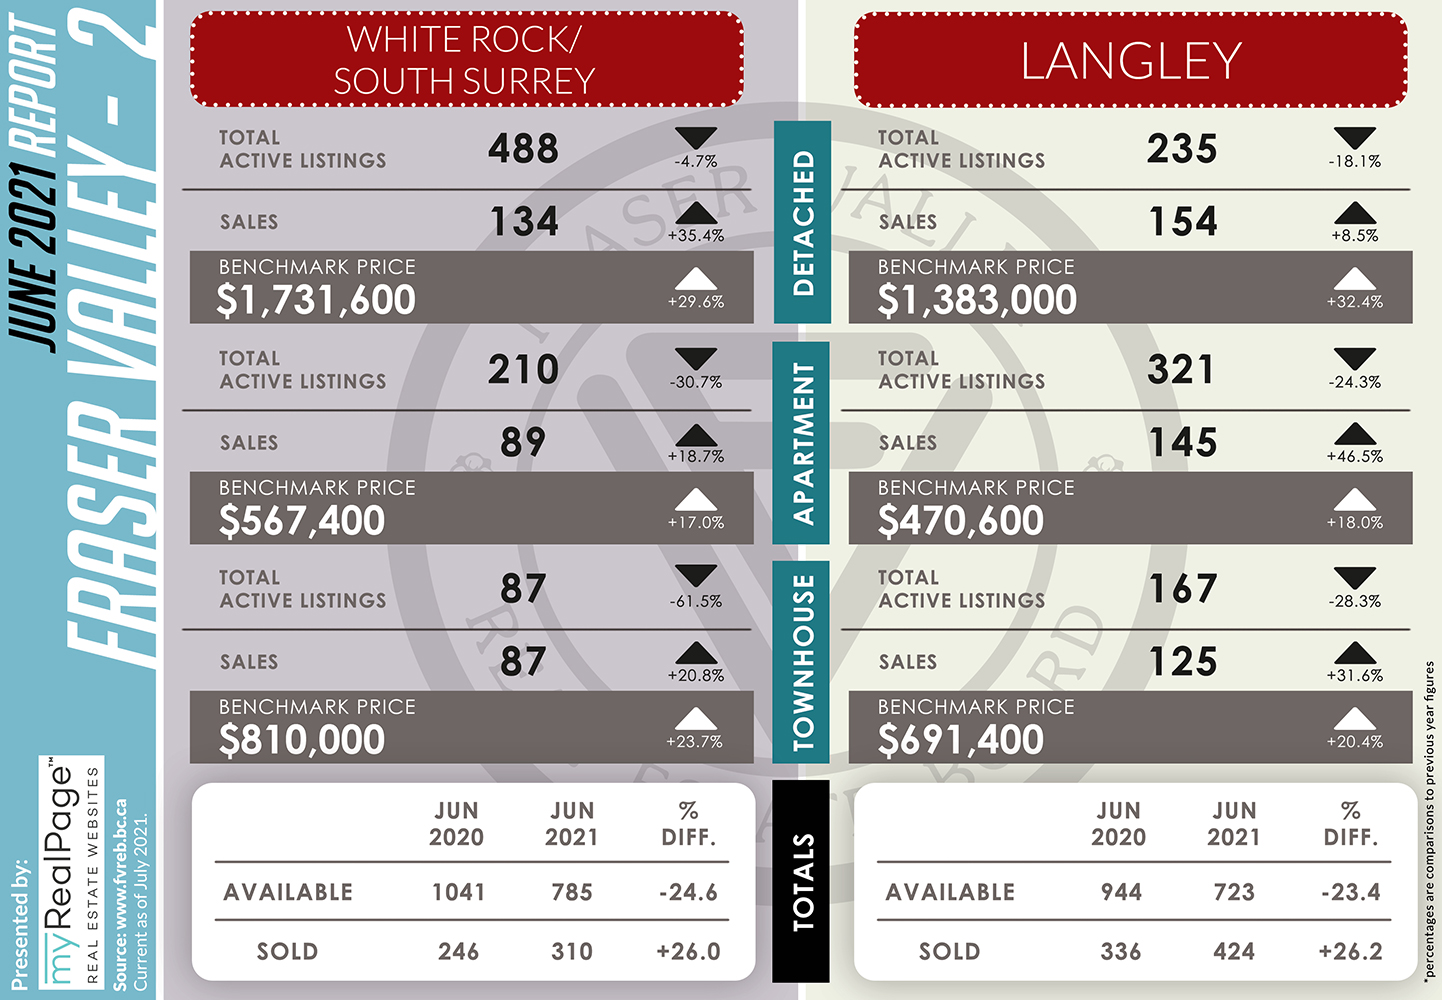
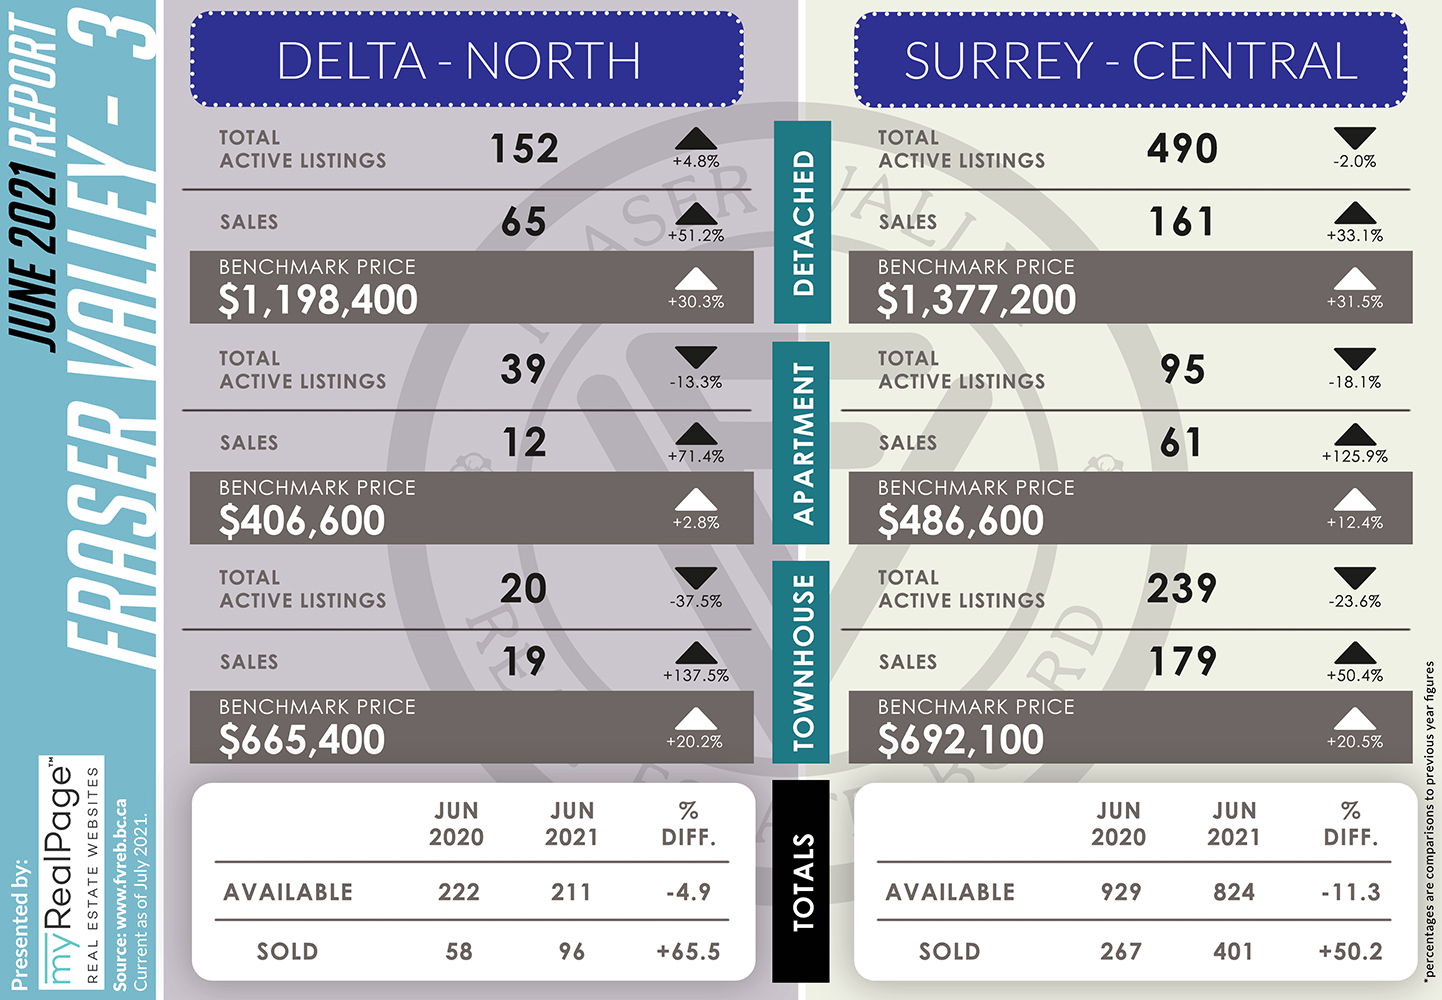
Sales on the Fraser Valley Real Estate Board’s Multiple Listing Service® (MLS®) remained robust in June however, for the first time since last September, monthly sales did not break a historical record.
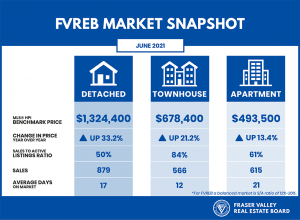
In June, the Board processed 2,247 sales on its MLS®, a decrease of 24% compared to May and a 31% increase compared to June of last year. Sales continued to remain elevated compared to a typical June – 22% above the ten-year average.
Read the full report on the FVREB website!
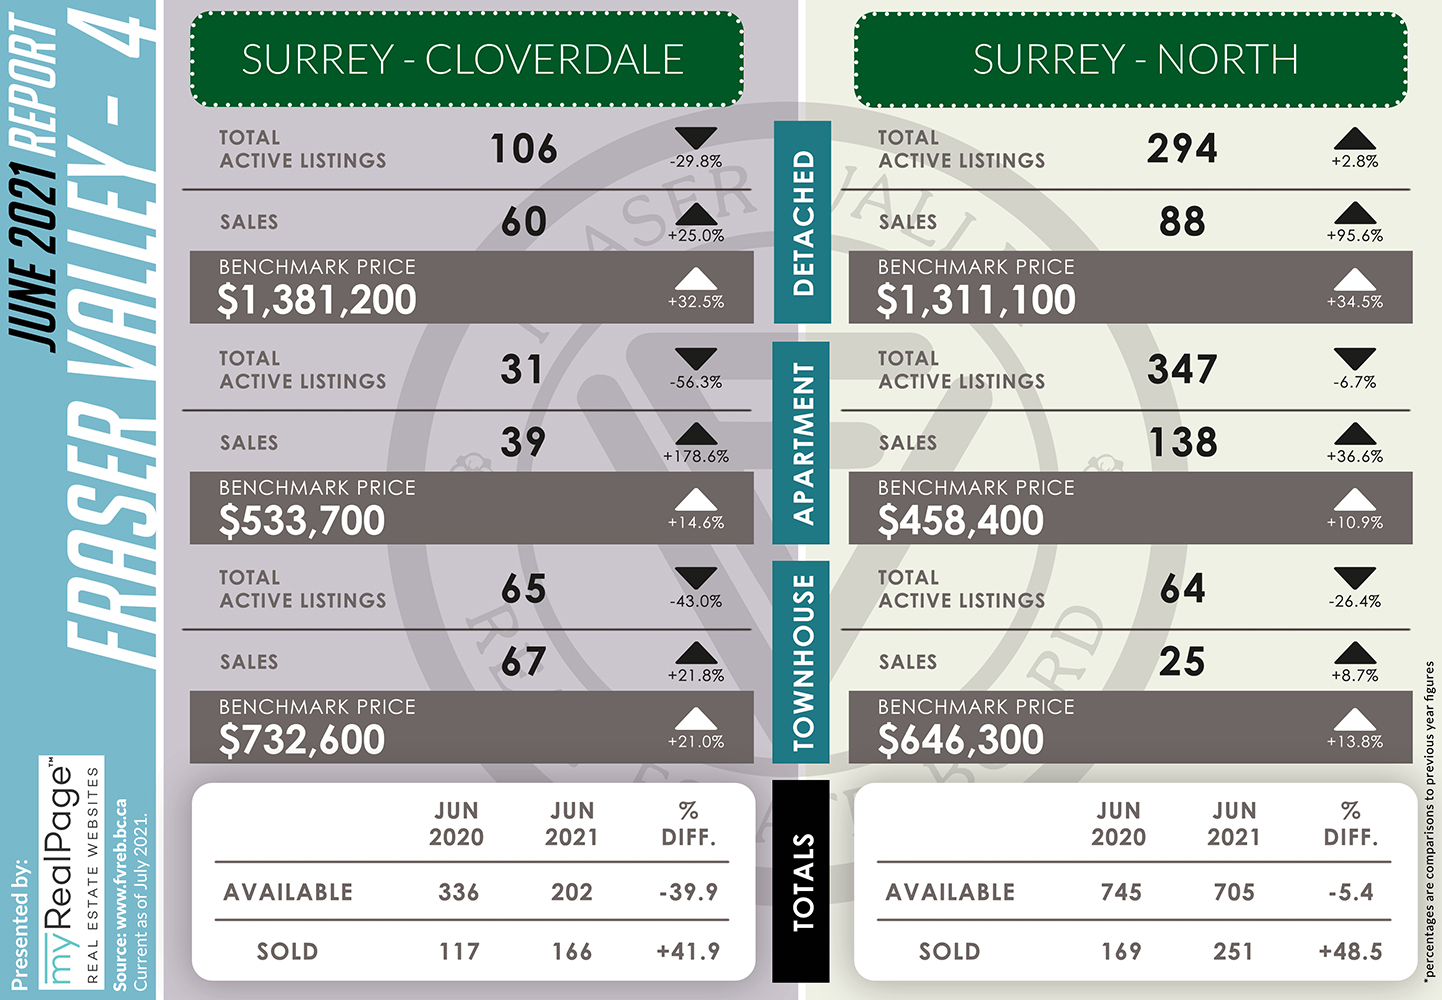
The following data is a comparison between June 2020 and June 2021 numbers, and is current as of July 2021. For last month’s report, check out our previous infographic!
Or follow this link for all our FVREB Infographics!
These infographics cover current trends in Fraser Valley neighbourhoods that are within the FVREB. Click on the images for a larger view! (Protip: Make sure to grab the printable PDF version, too! It fits best when printed on A4-sized sheets, AND we’ve added an area on the sheet where you can attach your business card! 🙂 )
Download Printable Version – FVREB June 2021 Market Report
-
- (from FVREB Twitter)

Last Updated on July 25, 2022 by myRealPage
