INFOGRAPHICS: May 2021 FVREB Fraser Valley, South Surrey, Etc. Market Reports

Near record-breaking new listings in the Fraser Valley not enough to match insatiable buyer demand
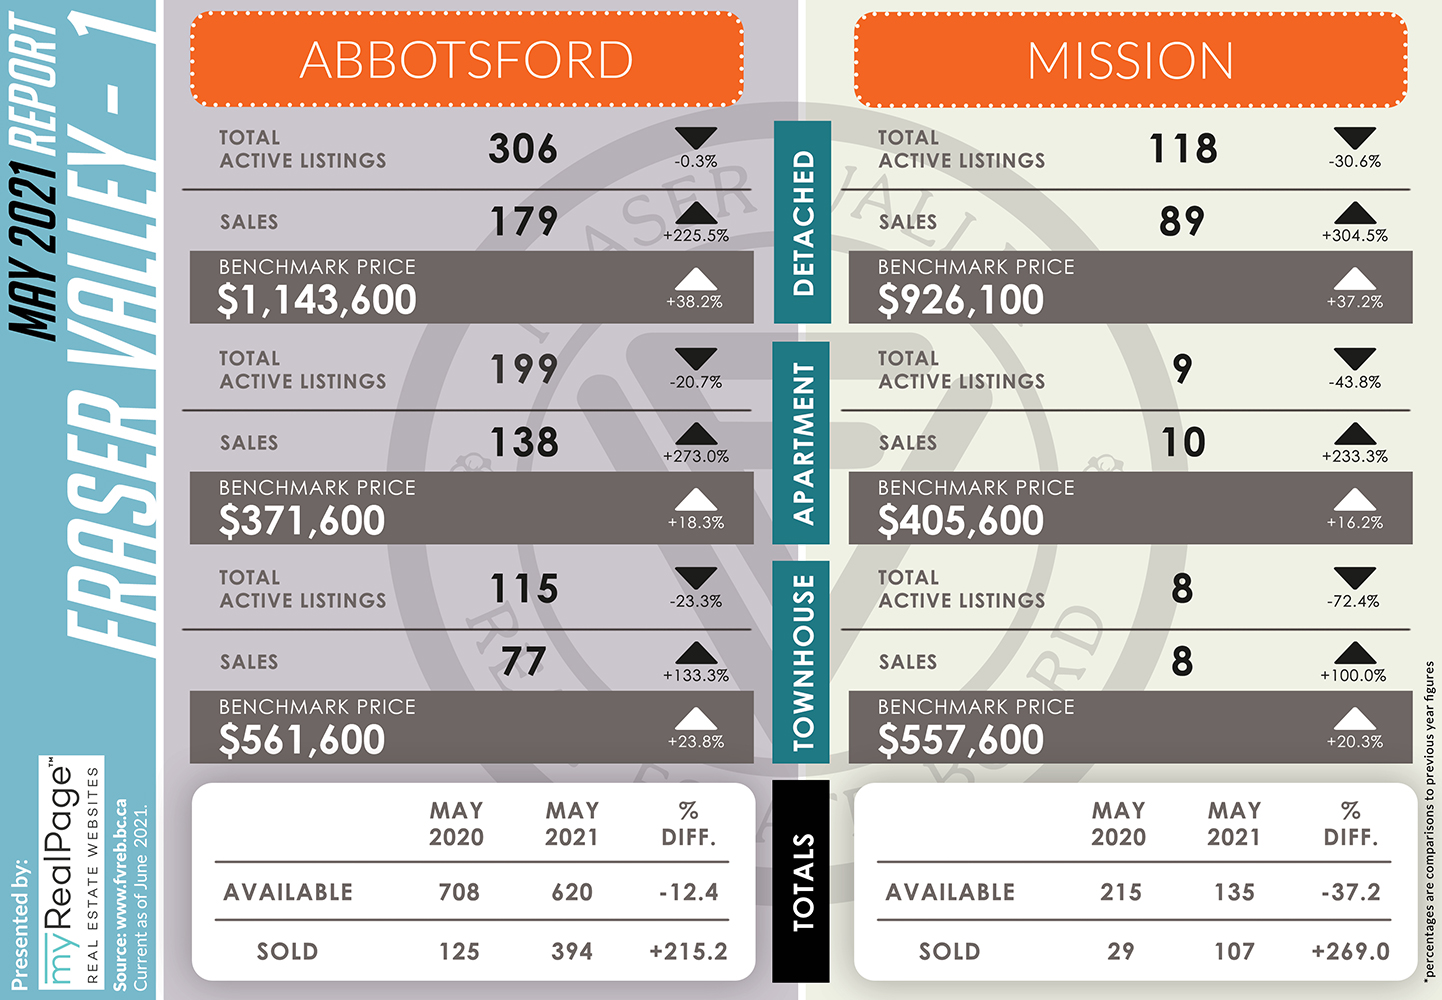
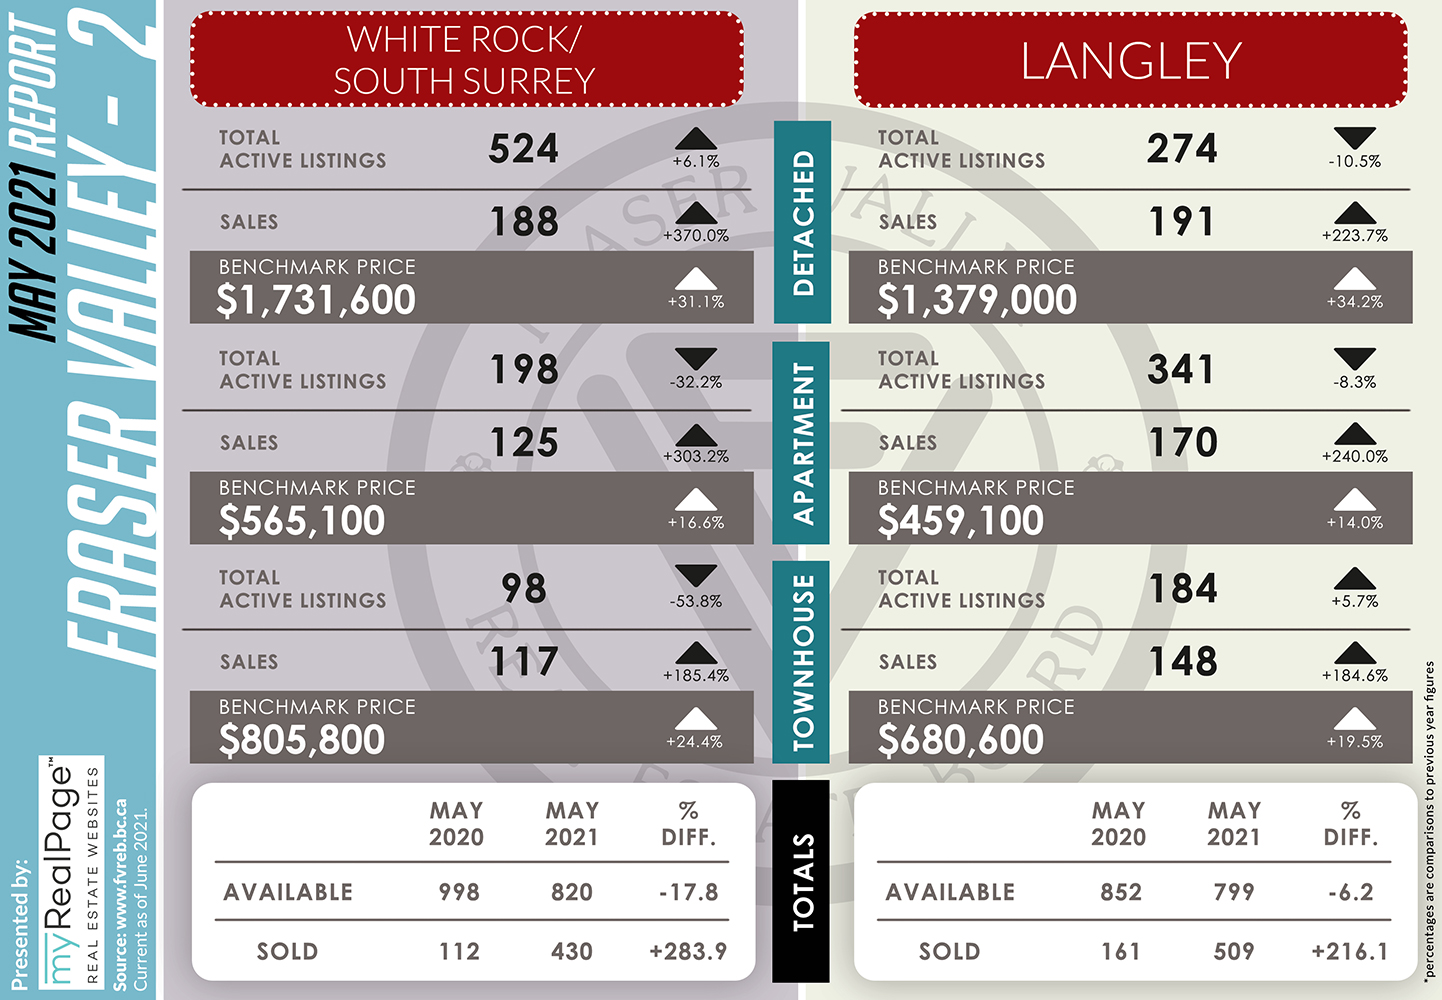
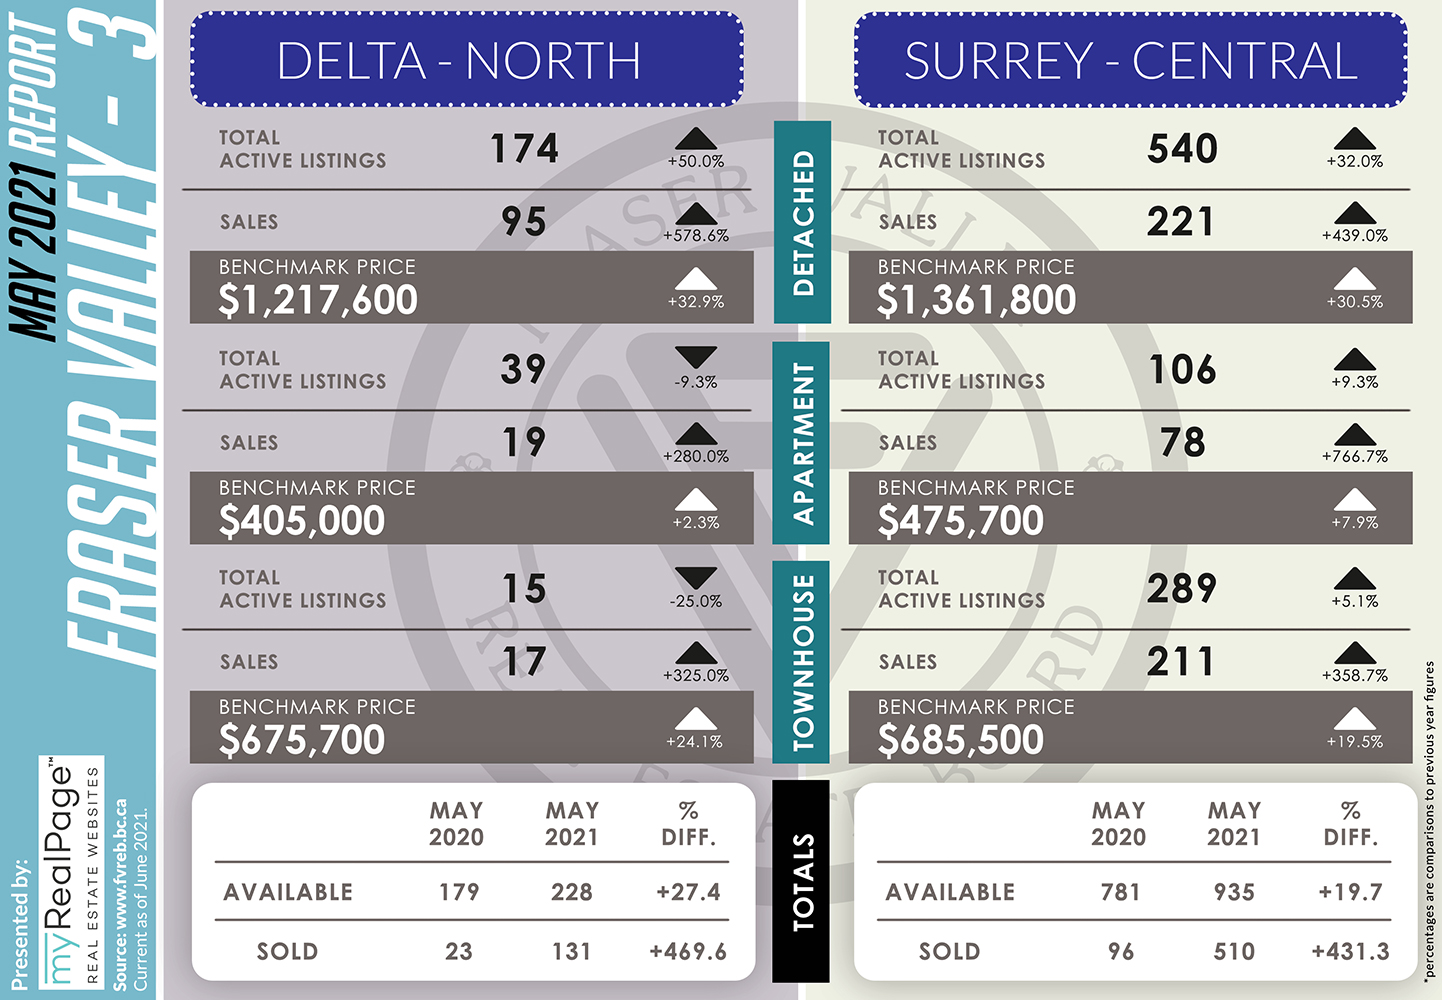
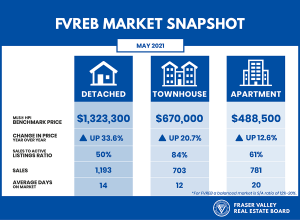
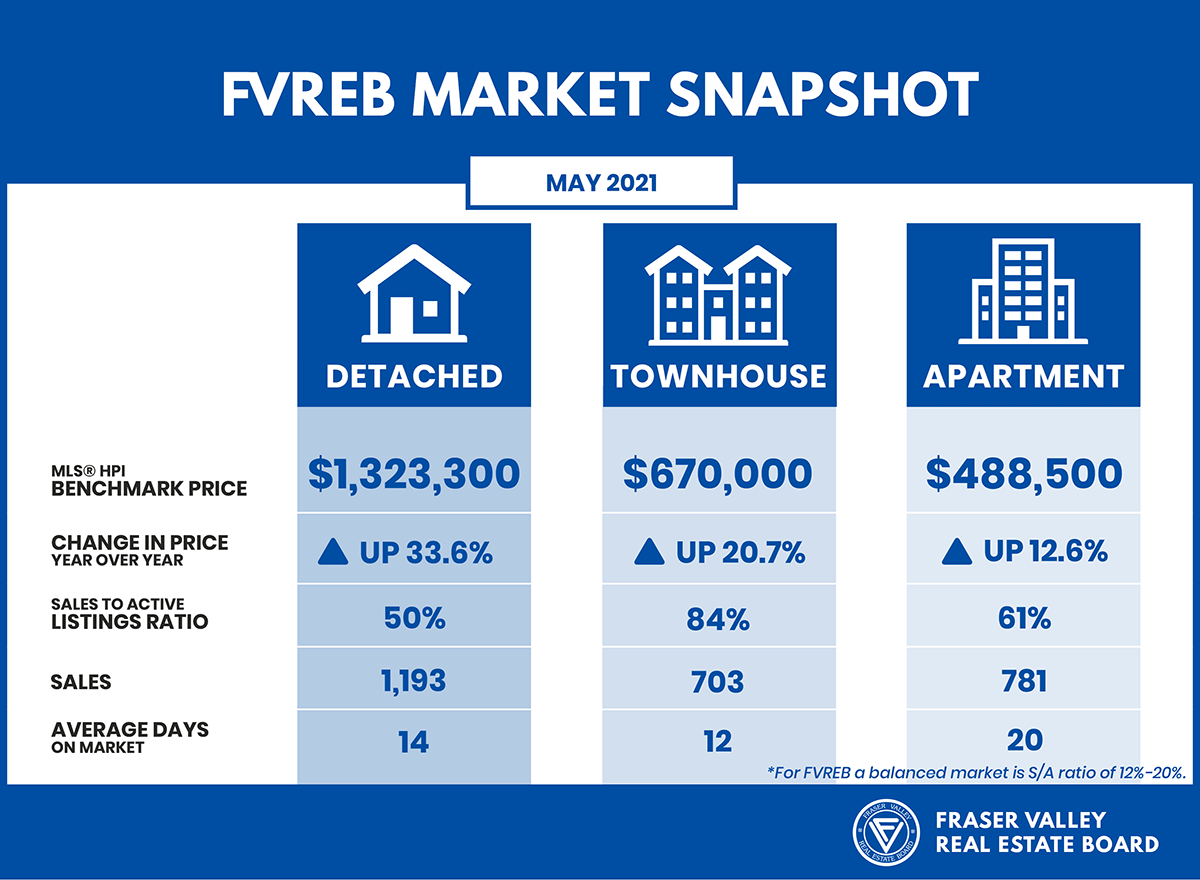
Fraser Valley’s extraordinary pandemic real estate market continued to break sales records – for the ninth consecutive month – while at the same time, reaching near-historic levels of new listings in May.
In May, the Fraser Valley Real Estate Board (FVREB) processed 2,951 sales on its Multiple Listing Service® (MLS®), an increase of 267% compared to May 2020 and a 2% decrease compared to April. (Note that last year, the market was significantly restricted due to the lockdown.) The previous record high for sales in May for the Fraser Valley region was 2,911 in 2016.
Read the full report on the FVREB website!
The following data is a comparison between May 2020 and May 2021 numbers, and is current as of June 2021. For last month’s report, check out our previous infographic!
Or follow this link for all our FVREB Infographics!
These infographics cover current trends in Fraser Valley neighbourhoods that are within the FVREB. Click on the images for a larger view! (Protip: Make sure to grab the printable PDF version, too! It fits best when printed on A4-sized sheets, AND we’ve added an area on the sheet where you can attach your business card! 🙂 )
Download Printable Version – FVREB May 2021 Market Report

-
- (from FVREB Facebook)
Last Updated on July 25, 2022 by myRealPage
