INFOGRAPHICS: August 2021 TRREB Toronto Market Reports

GTA Housing Demand Remains Strong In August
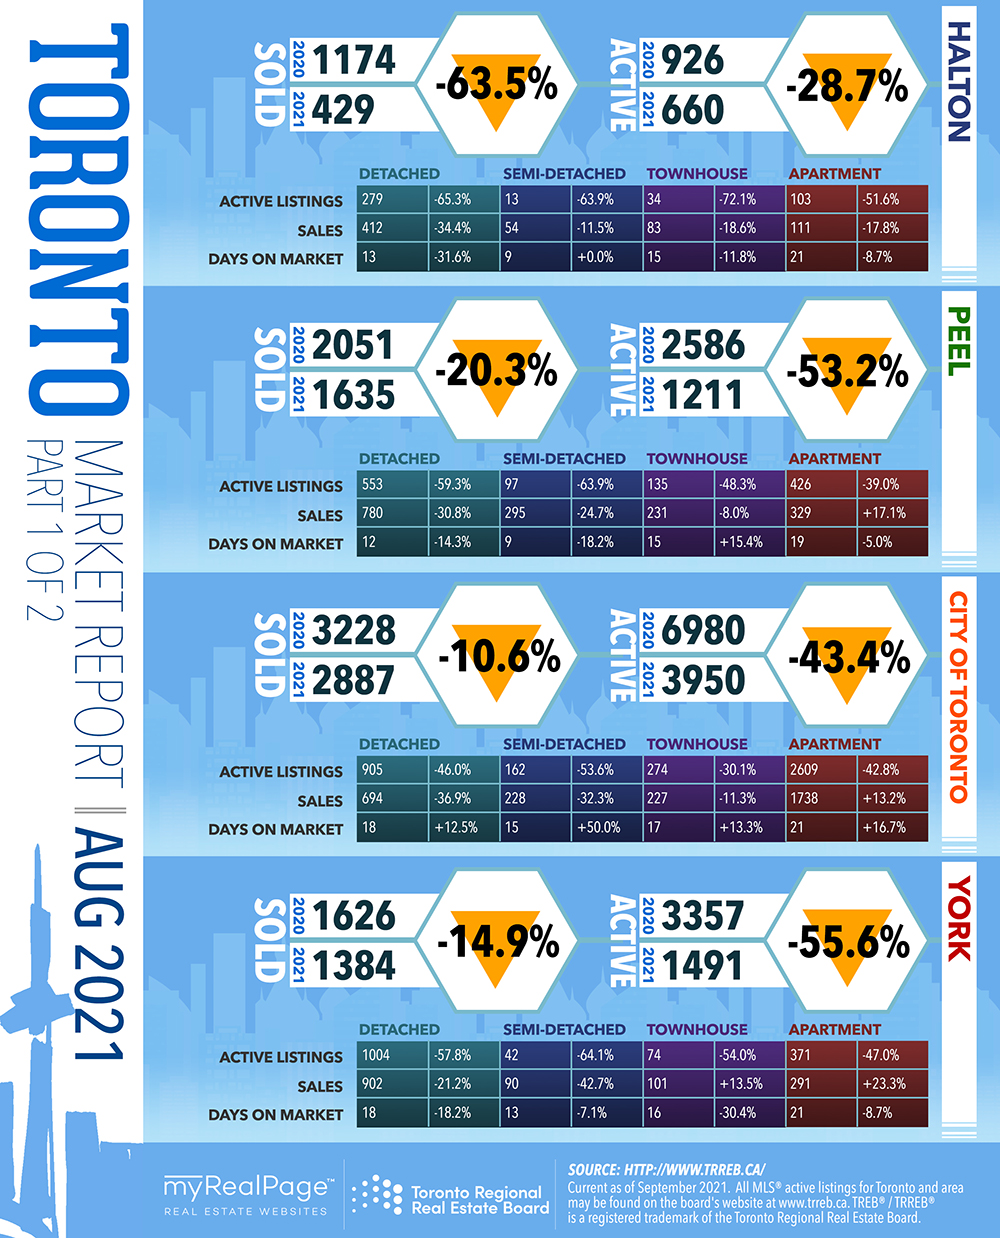
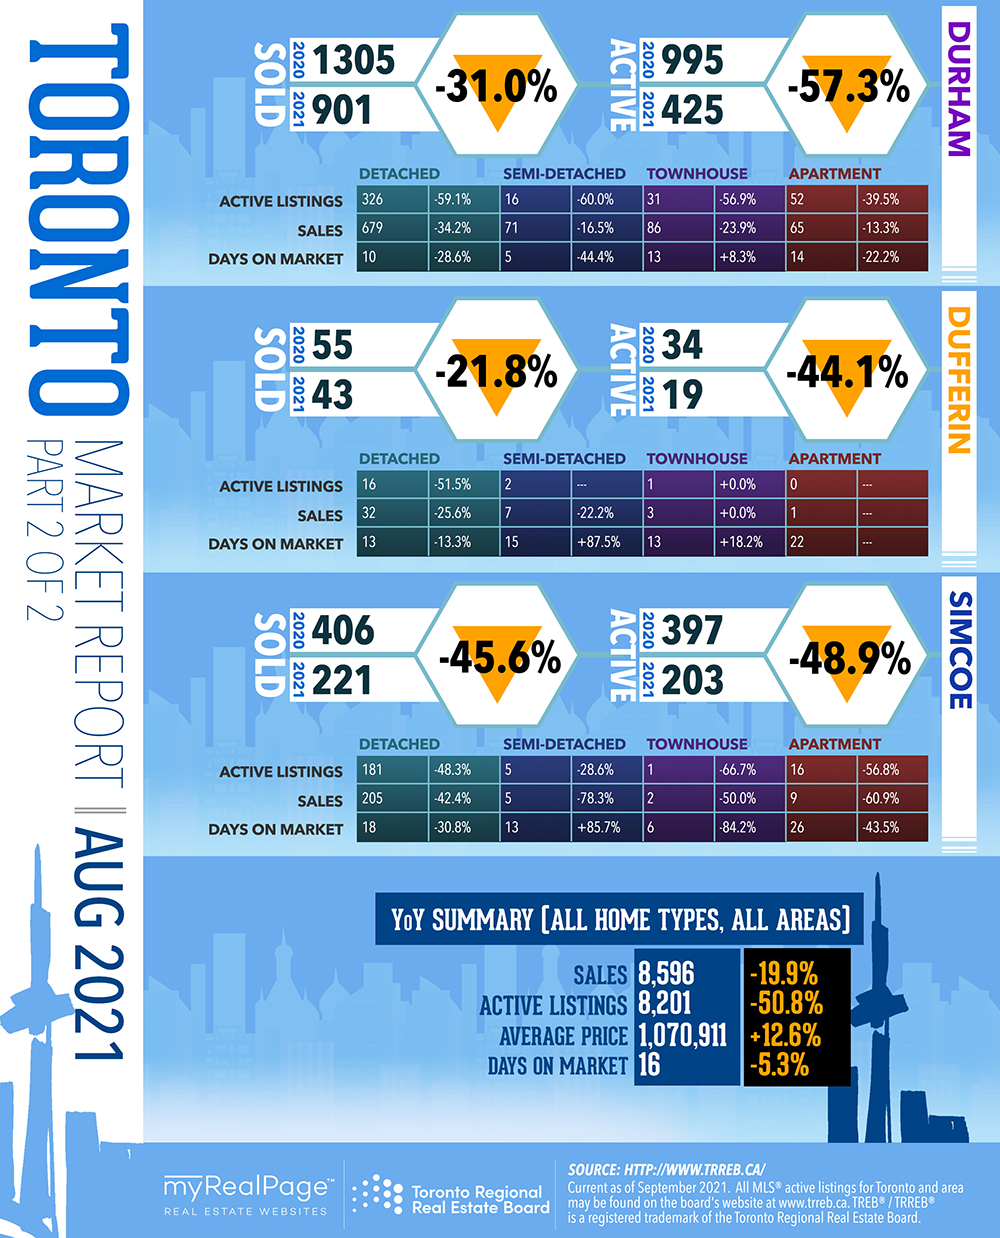
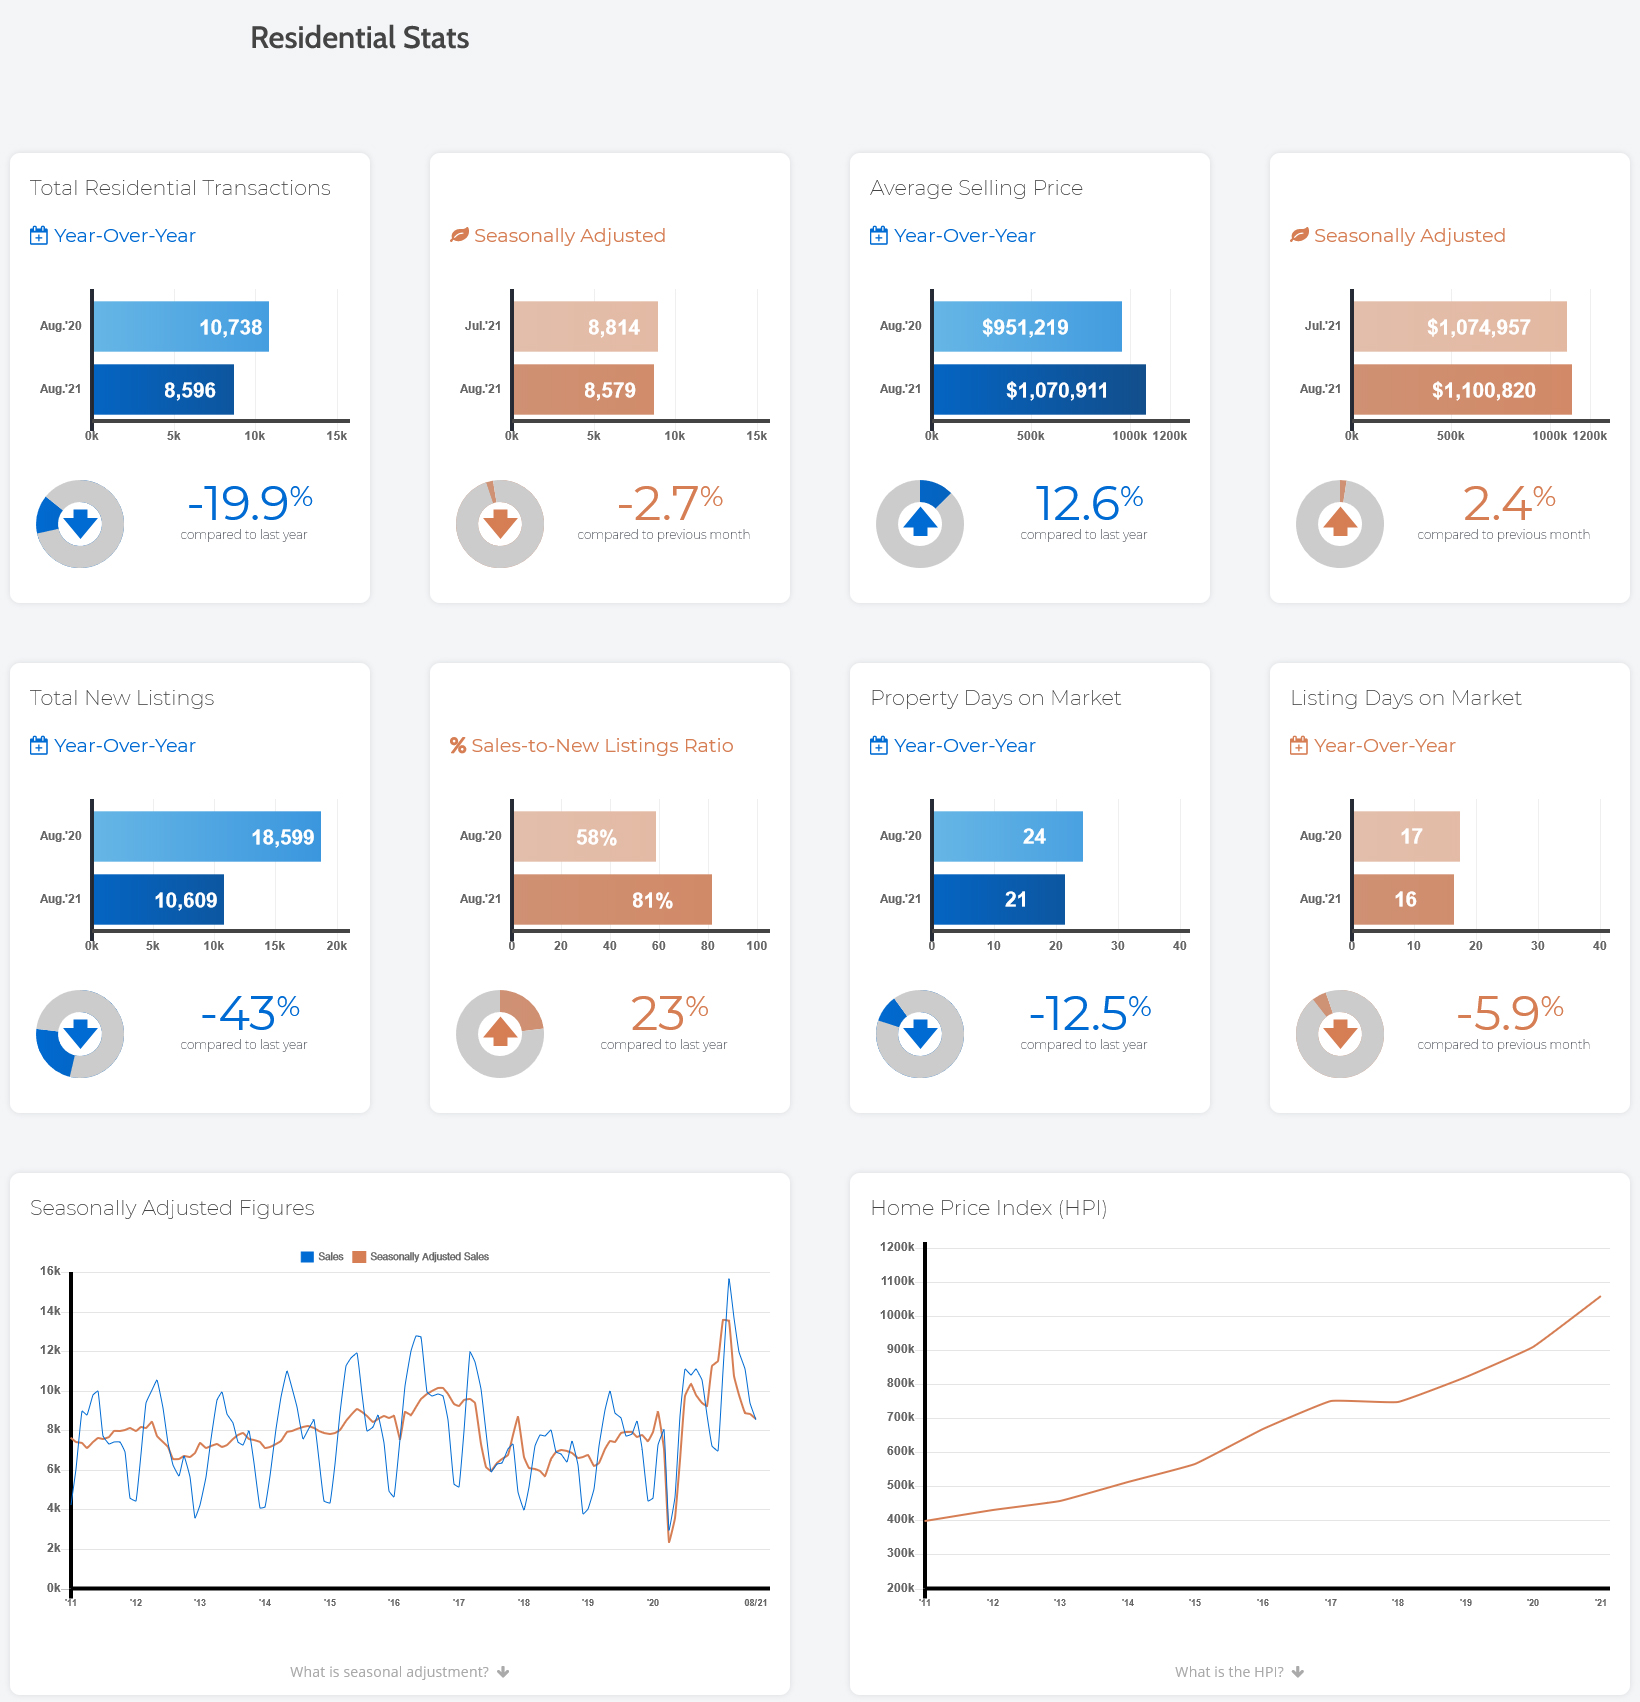
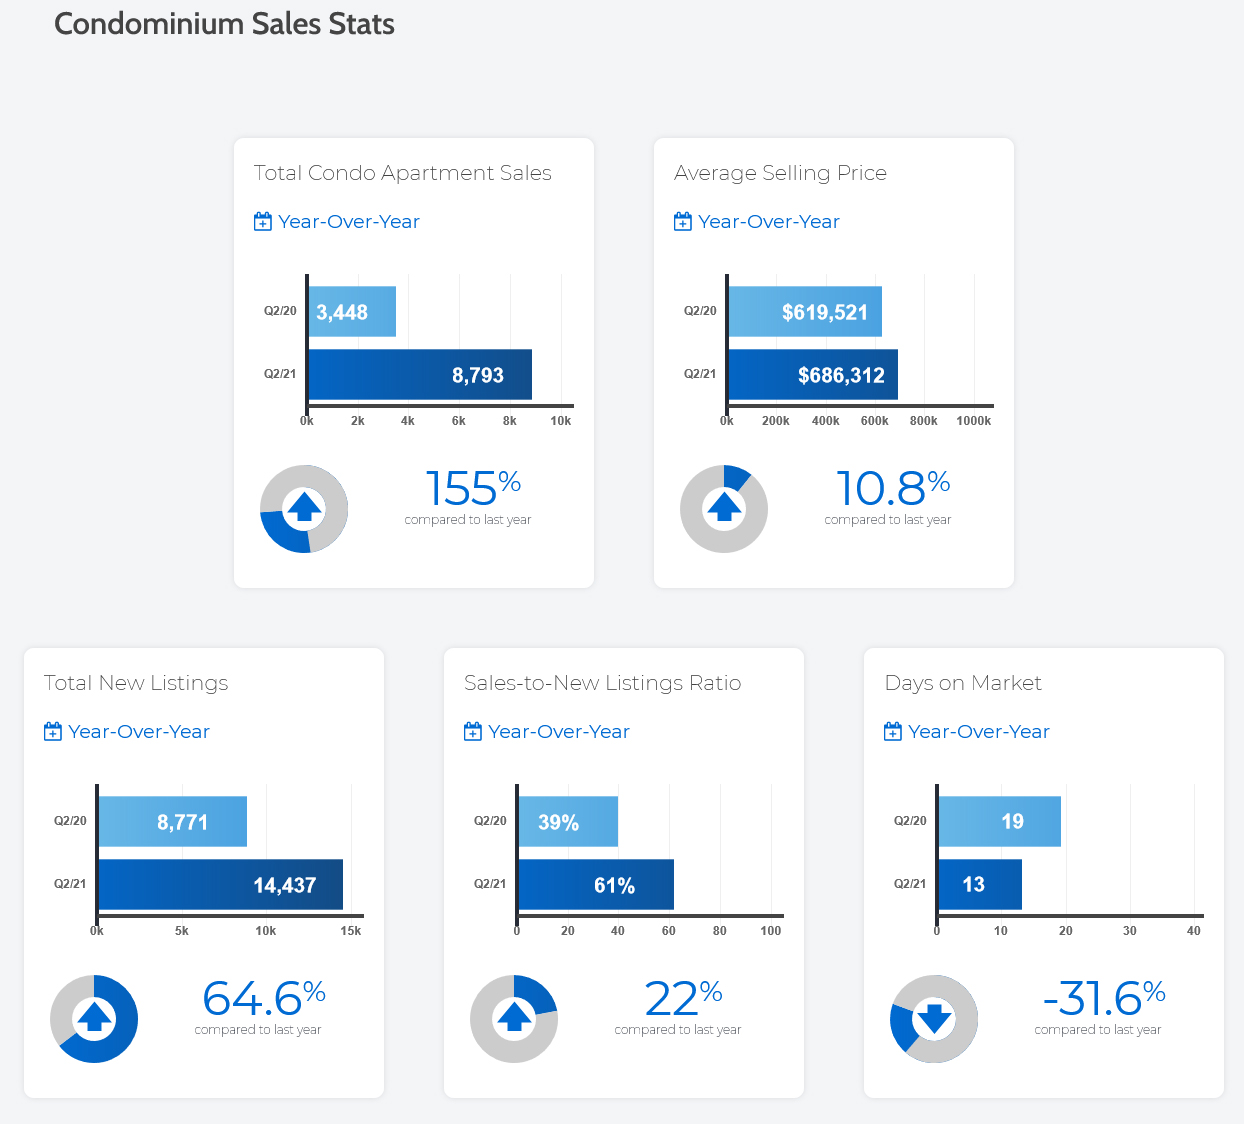
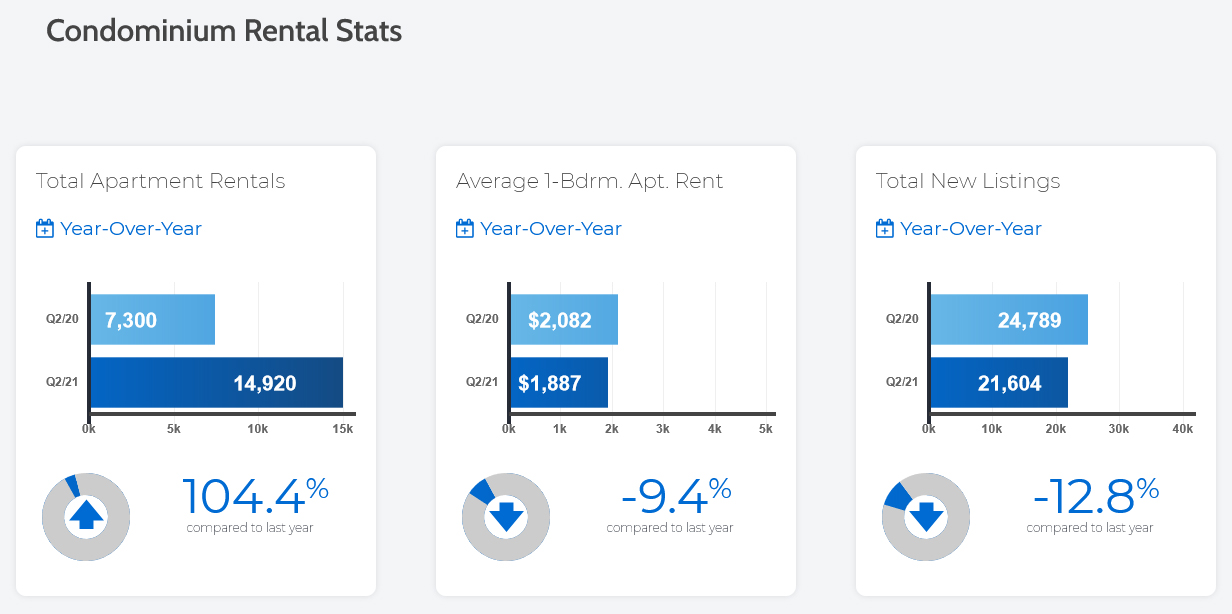
TRREB is reporting the third-best sales result on record for the month of August. While the market has taken its regular summer breather, it is clear that the demand for ownership housing remains strong. At the same time, the supply of listings is down. The result has been tighter market conditions and sustained competition between buyers, resulting in double-digit annual increases in selling prices.
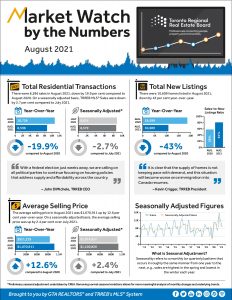
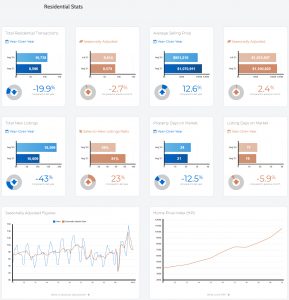
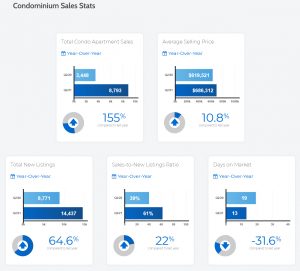
Greater Toronto Area REALTORS® reported 8,596 sales through TRREB’s MLS® System in August 2021 – down by 19.9% compared to the August 2020 record of 10,738. The condominium apartment market segment bucked the overall sales trend, with year-over-year growth in sales, continuing a marked resurgence in 2021. The number of new listings entered into the System was down year-over-year by 43%.
Read the full report on the TRREB website!
The following data is a comparison between August 2020 and August 2021 numbers, and is current as of September 2021. For last month’s numbers, check out our previous infographic!
Or follow this link for all our TREB / TRREB Infographics!
Click on the images for a larger view! (Protip: Make sure to grab the printable PDF versions, too! It fits best when printed on A4-sized sheets, AND we’ve added an area on the sheet where you can attach your business card! 🙂 )
Download Printable Version – August 2021 TRREB, Toronto Market Report
-
- (from TRREB website)

-
- (from TRREB website)
-
- (from TRREB website)
-
- (from TRREB website)
-
- (from TRREB website)
-

- (from TRREB Twitter)

-

- (from TRREB Twitter)

Last Updated on July 25, 2022 by myRealPage
