INFOGRAPHICS: July 2021 TRREB Toronto Market Reports

July Numbers Show Strong Demand Continues For Home Ownership In GTA
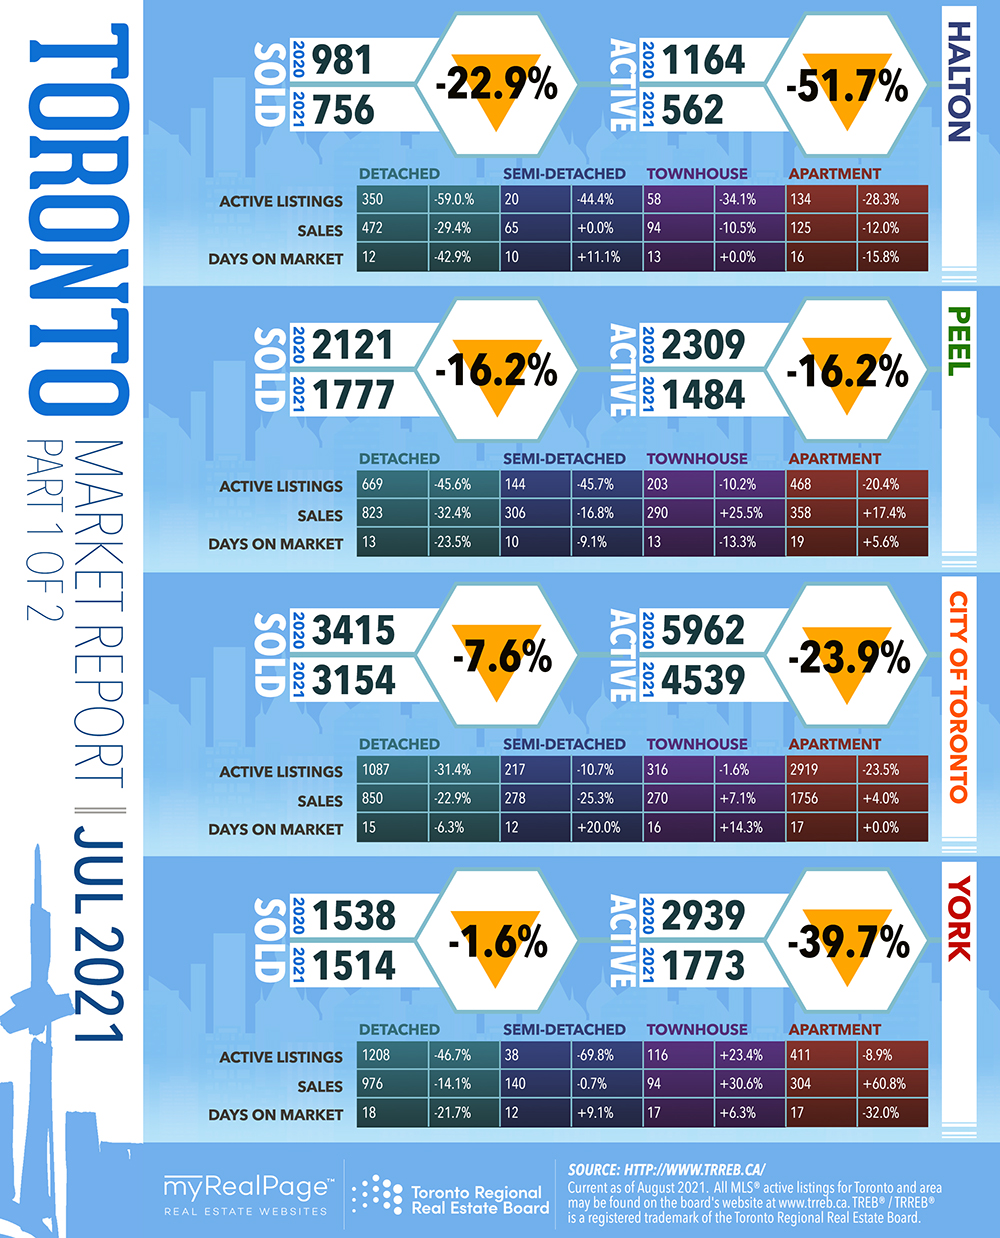
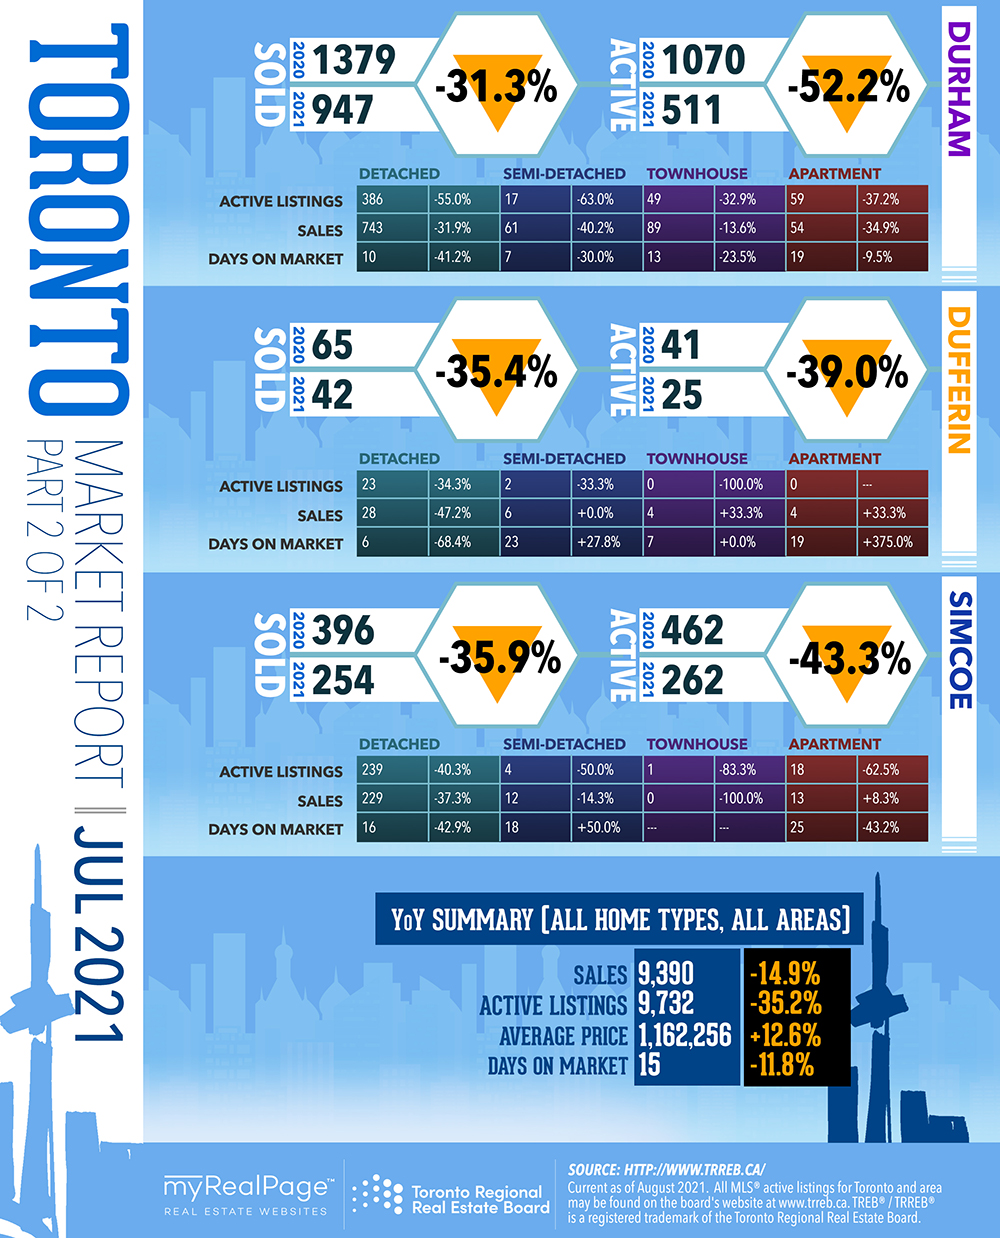
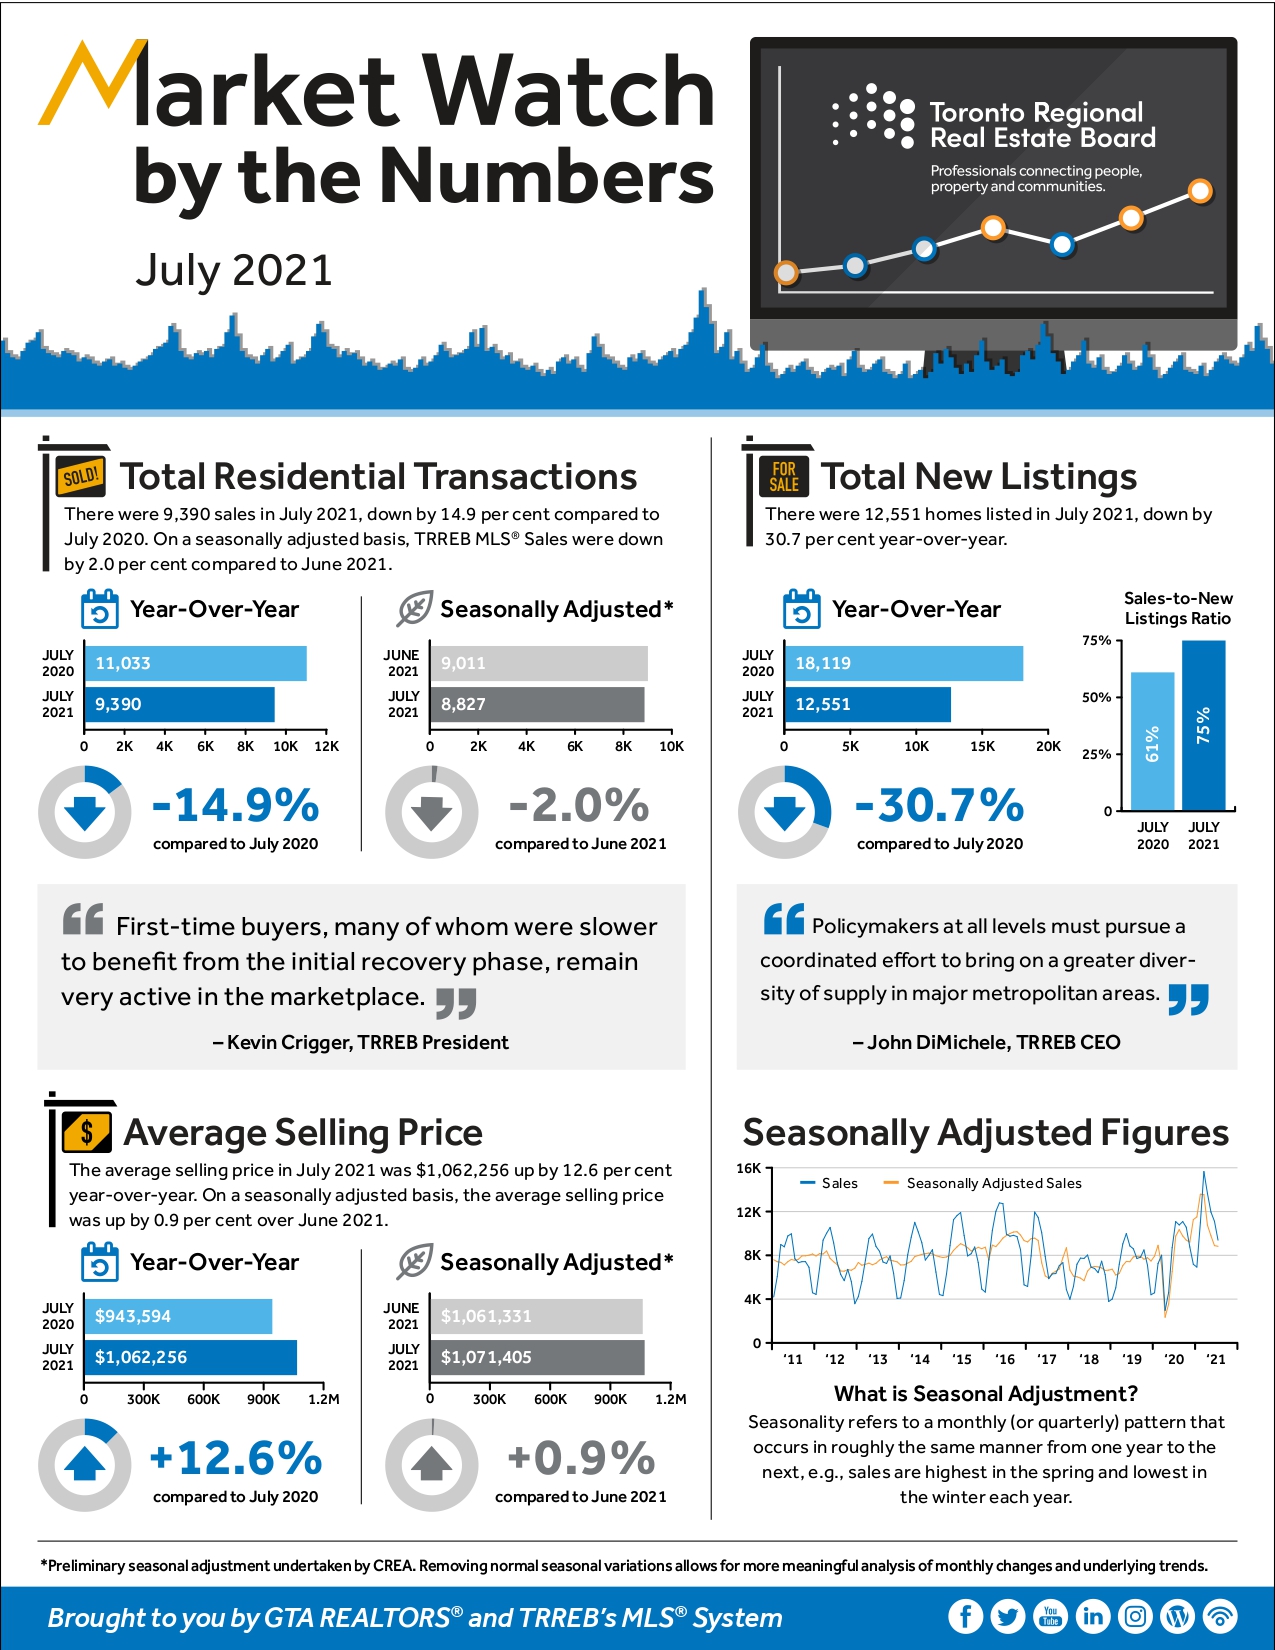
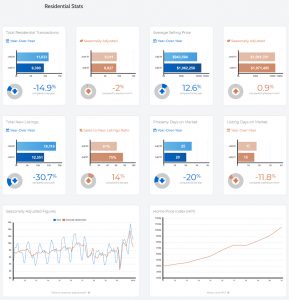
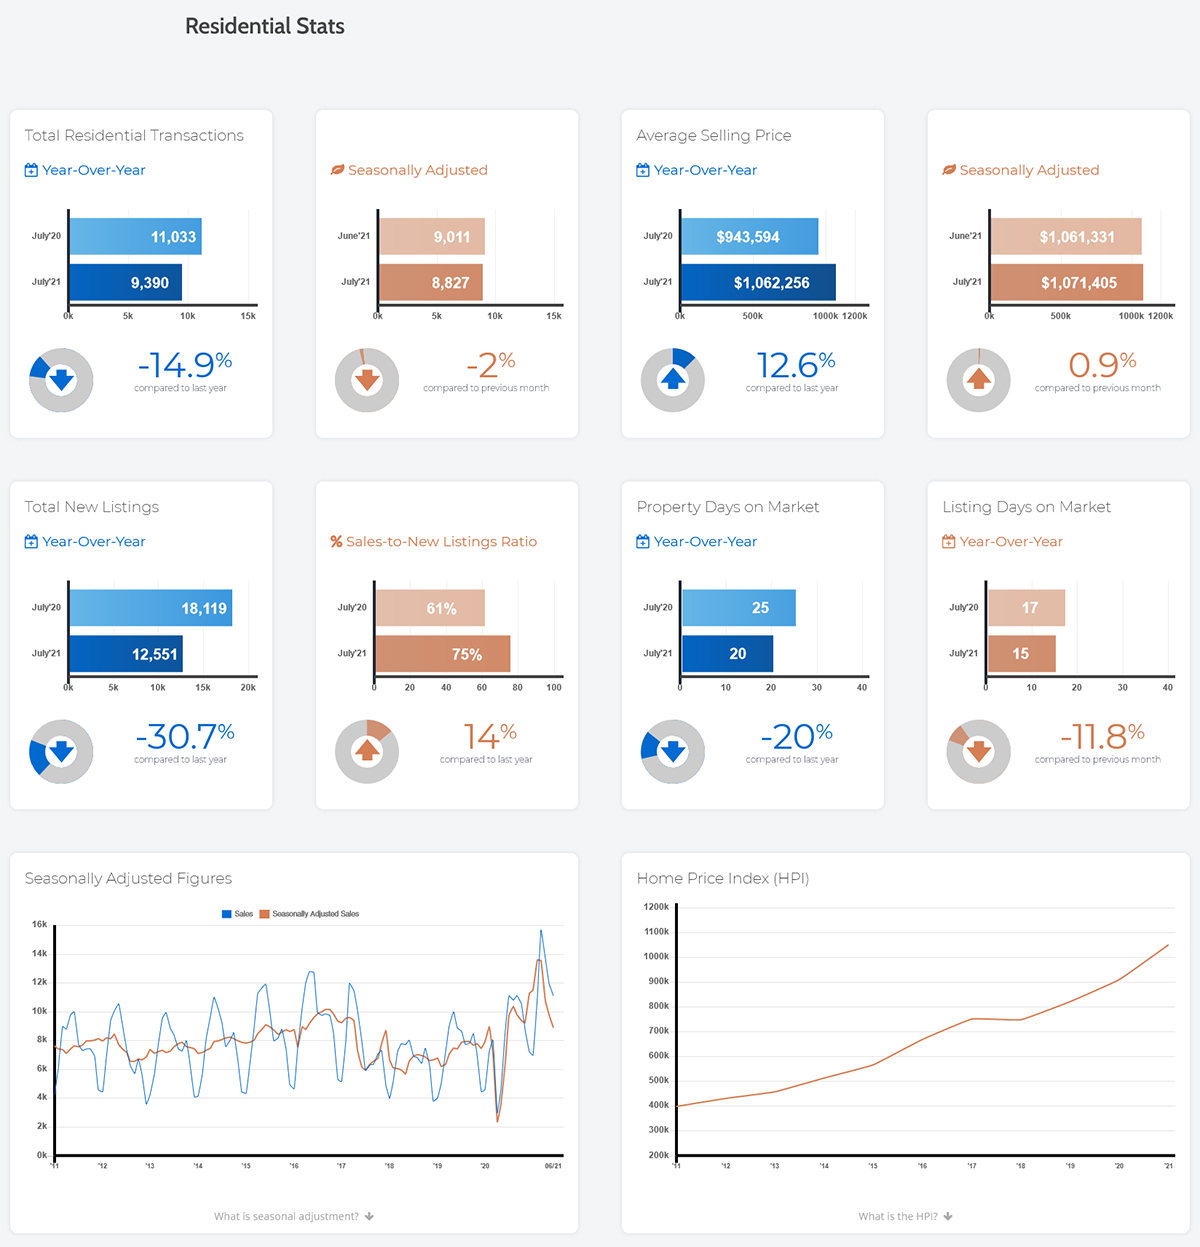
With almost 9,400 sales reported in July 2021, demand for ownership housing remained well-above average for the time of year despite being below the record July result set a year earlier. Market conditions actually tightened relative to July 2020, with sales accounting for a greater share of new listings compared to last year. The sellers’ market conditions sustained a double-digit annual rate of price growth.
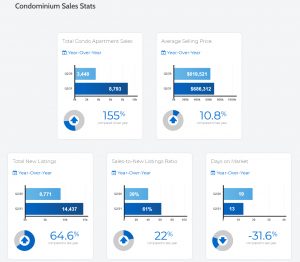
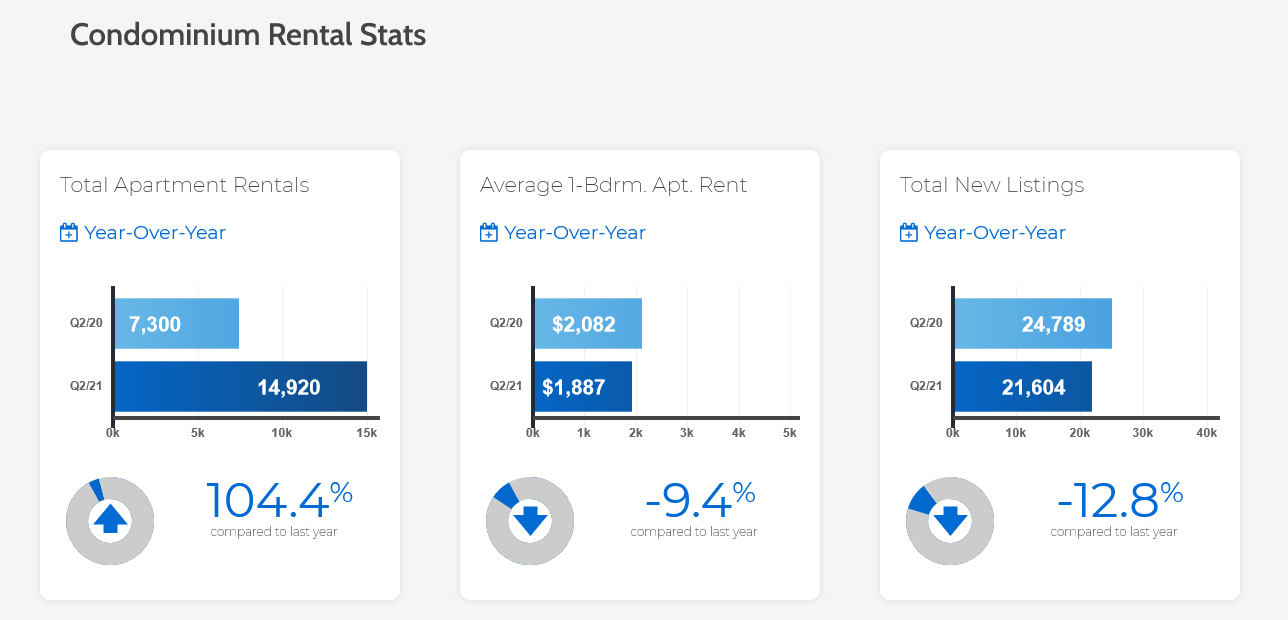
“Demand for ownership housing has remained strong despite a pandemic-related lull in population growth. Of specific note is the condominium apartment market, which has seen a marked turn-around in 2021 with sales up compared to last year. First-time buyers, many of whom were slower to benefit from the initial recovery phase, remain very active in the market place,” said TRREB President Kevin Crigger.
Read the full report on the TRREB website!
The following data is a comparison between July 2020 and July 2021 numbers, and is current as of August 2021. For last month’s numbers, check out our previous infographic!
Or follow this link for all our TREB / TRREB Infographics!
Click on the images for a larger view! (Protip: Make sure to grab the printable PDF versions, too! It fits best when printed on A4-sized sheets, AND we’ve added an area on the sheet where you can attach your business card! 🙂 )
Download Printable Version – July 2021 TRREB, Toronto Market Report
-
- (from TRREB website)
-
- (from TRREB website)
-
- (from TRREB website)

-
- (from TRREB website)

-
- (from TRREB website)
-

- (from TRREB Twitter)

-

- (from TRREB Twitter)

Last Updated on July 25, 2022 by myRealPage
