INFOGRAPHICS: June 2021 TRREB Toronto Market Reports

TRREB Updates Its Sales Forecast and Average List Price Upwards
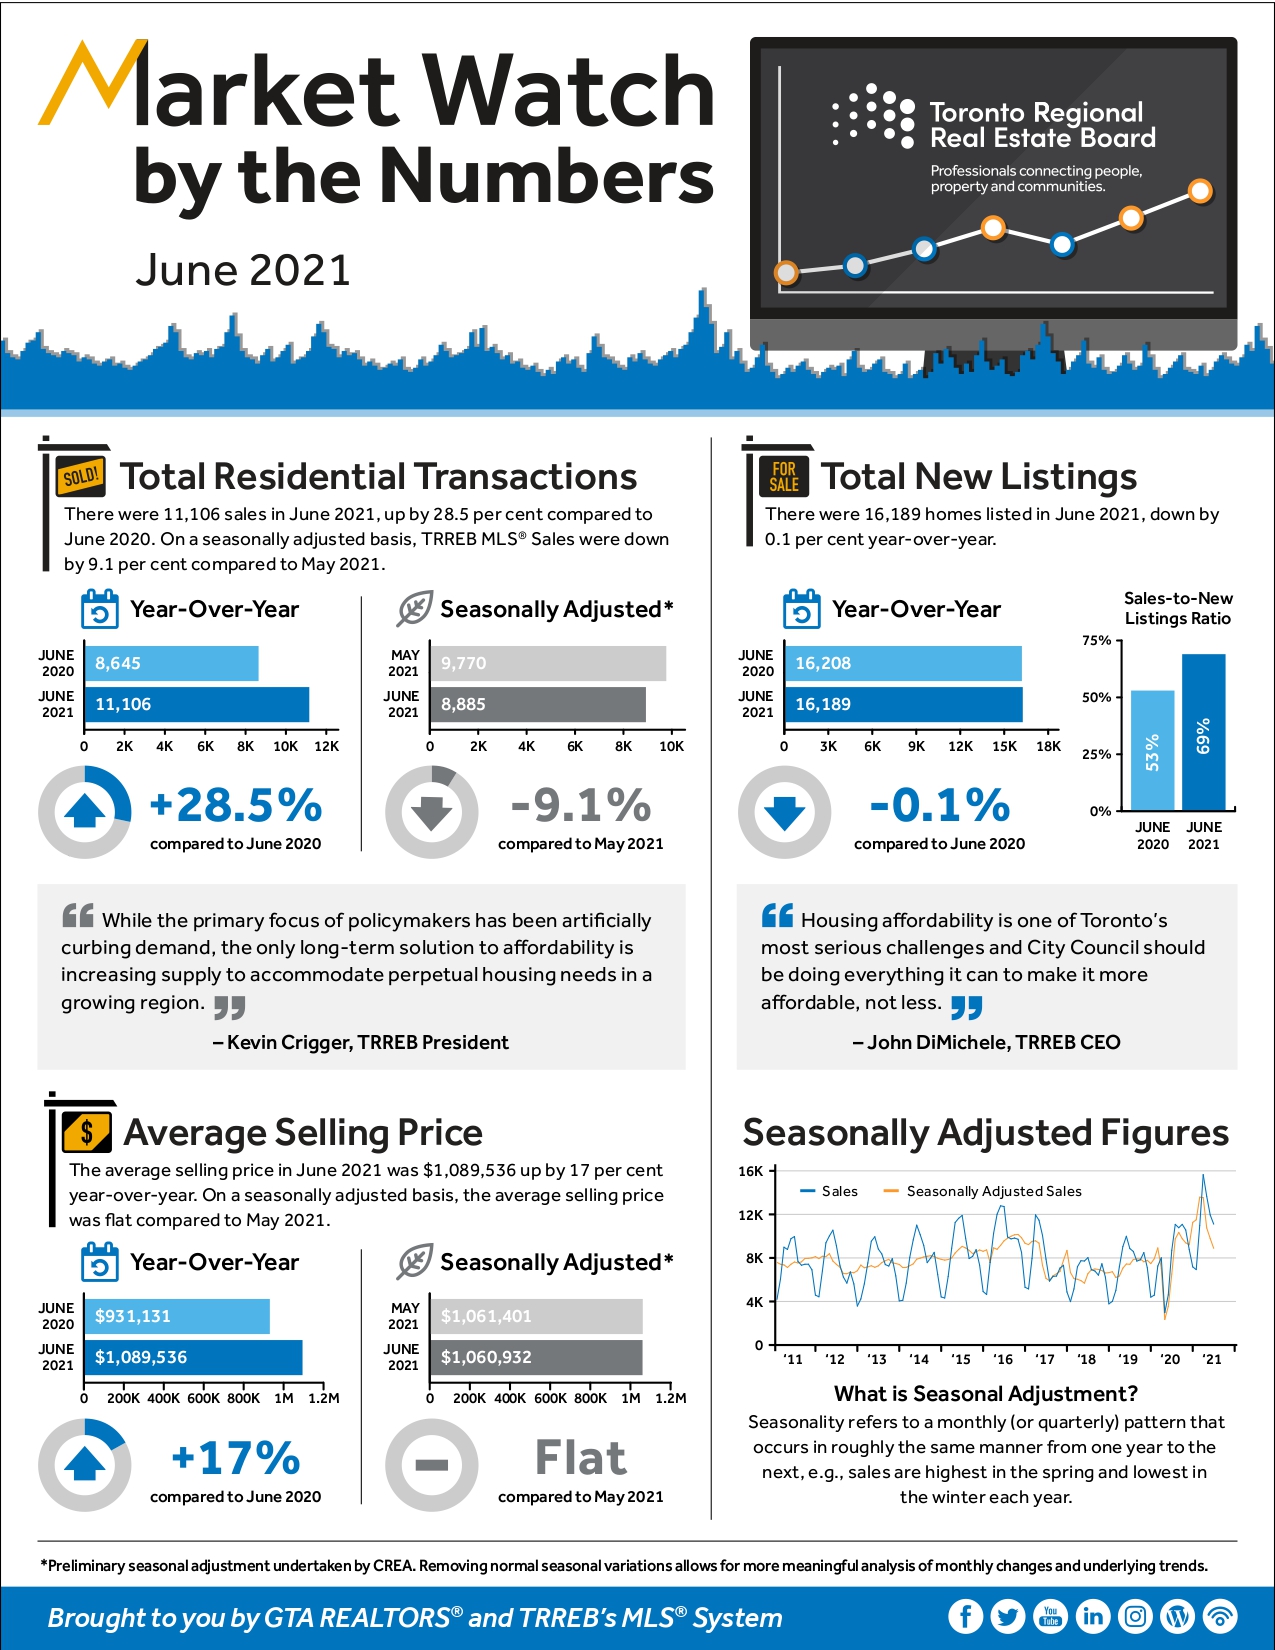
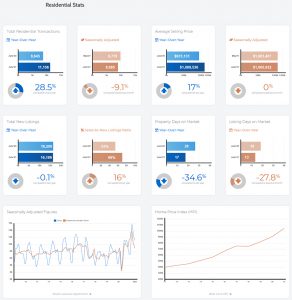
June home sales were up compared to last year, but remained below the March 2021 peak and were lower than the number of transactions reported for May 2021, consistent with the regular seasonal trend. The average selling price in June increased by double digits compared to last year as well, but the annual rate of increase moderated compared to the previous three months.
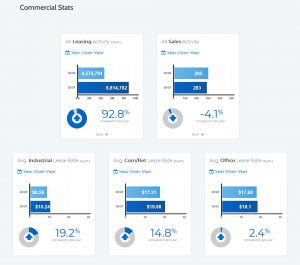
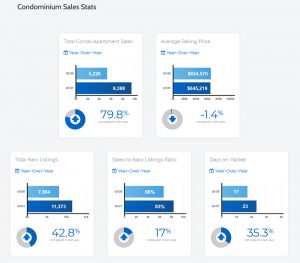
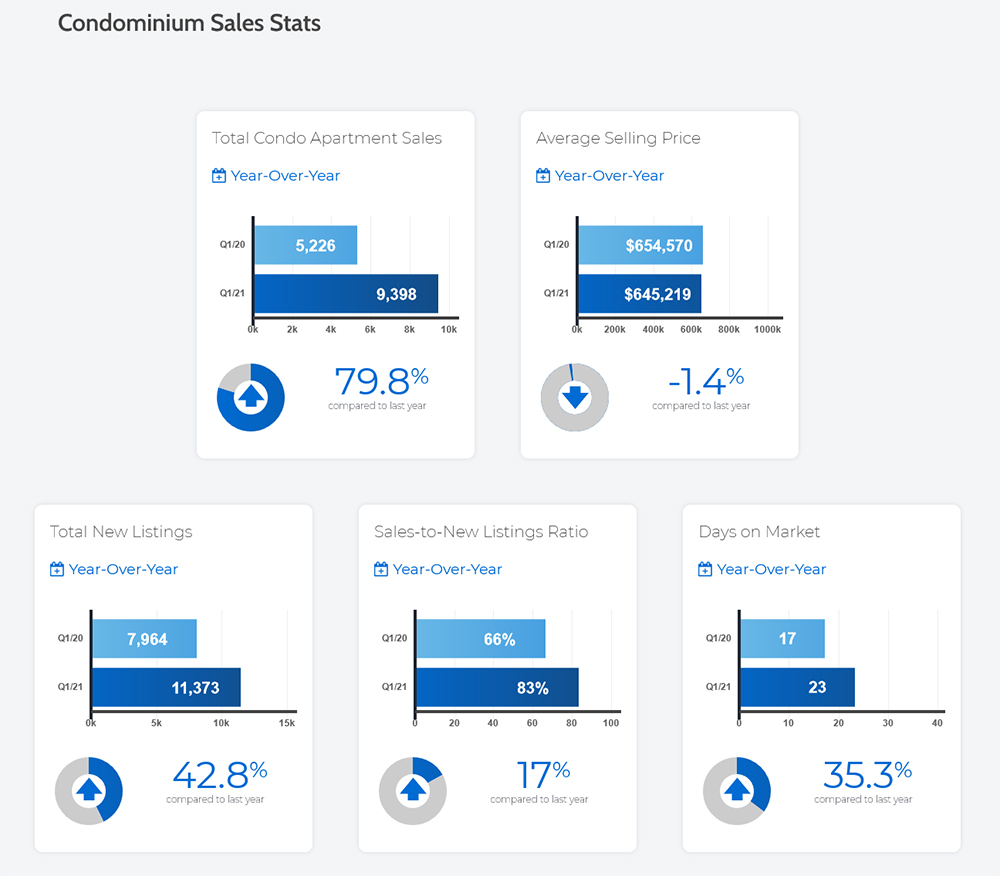
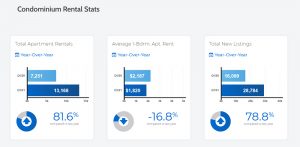
Greater Toronto Area REALTORS® reported 11,106 sales through TRREB’s MLS® System in June 2021 – up by 28.5% compared to June 2020. Looking at the GTA as a whole, year-over-year sales growth was strongest in the condominium apartment segment, both in the City of Toronto and some of the surrounding suburbs. On a month-over-month basis, both actual and seasonally adjusted sales continued to trend lower in June.
Read the full report on the TRREB website!
The following data is a comparison between June 2020 and June 2021 numbers, and is current as of July 2021. For last month’s numbers, check out our previous infographic!
Or follow this link for all our TREB / TRREB Infographics!
Click on the images for a larger view! (Protip: Make sure to grab the printable PDF versions, too! It fits best when printed on A4-sized sheets, AND we’ve added an area on the sheet where you can attach your business card! 🙂 )
Download Printable Version – June 2021 TRREB, Toronto Market Report
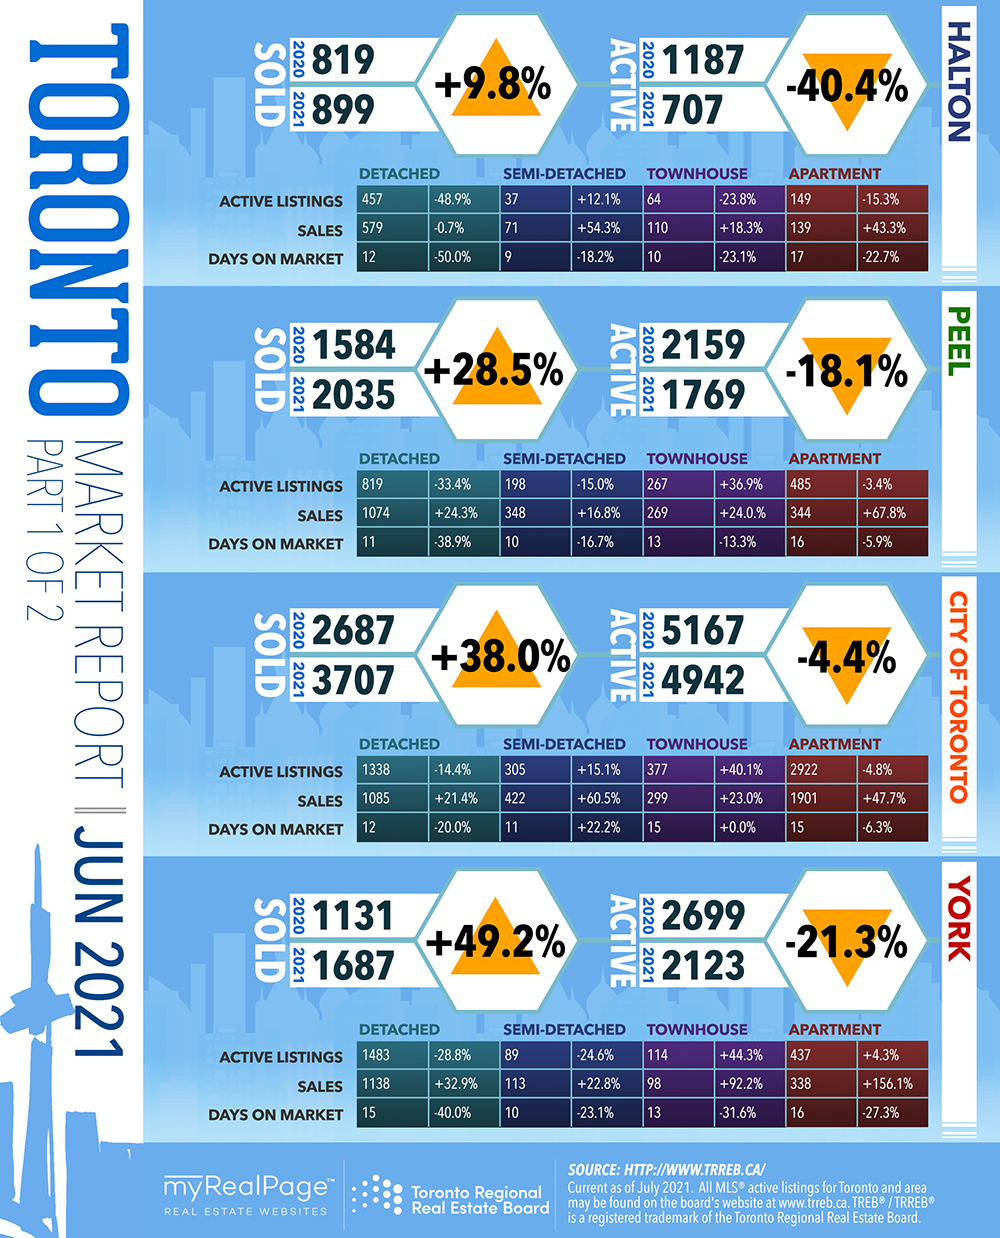
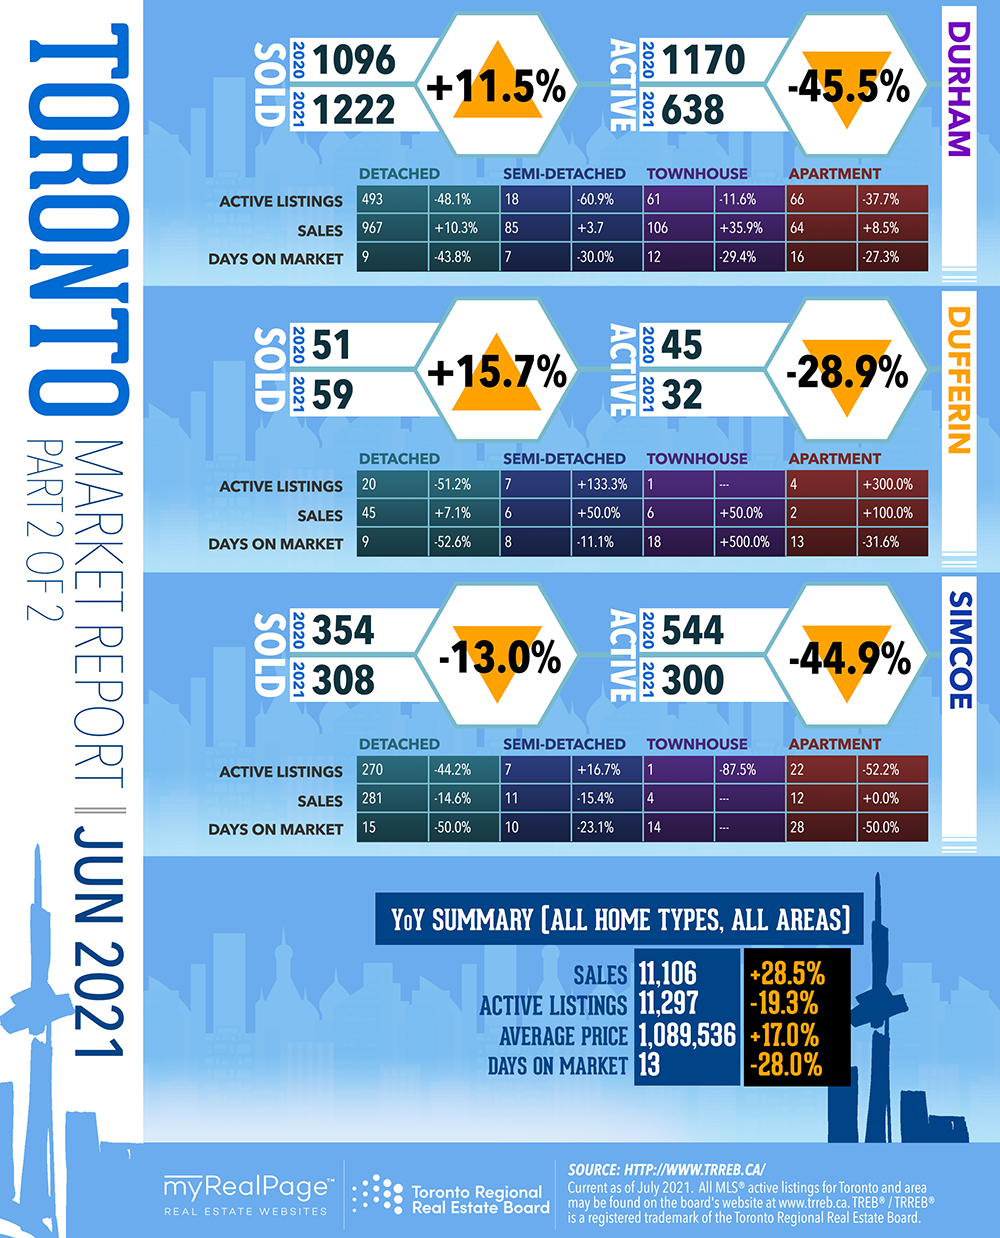
-
- (from TRREB website)
-
- (from TRREB website)

-
- (from TRREB website)

-
- (from TRREB website)
-
- (from TRREB website)

Last Updated on July 25, 2022 by myRealPage
