INFOGRAPHICS: May 2021 TRREB Toronto Market Reports

Strong May GTA Home Sales Remain Below March Peak
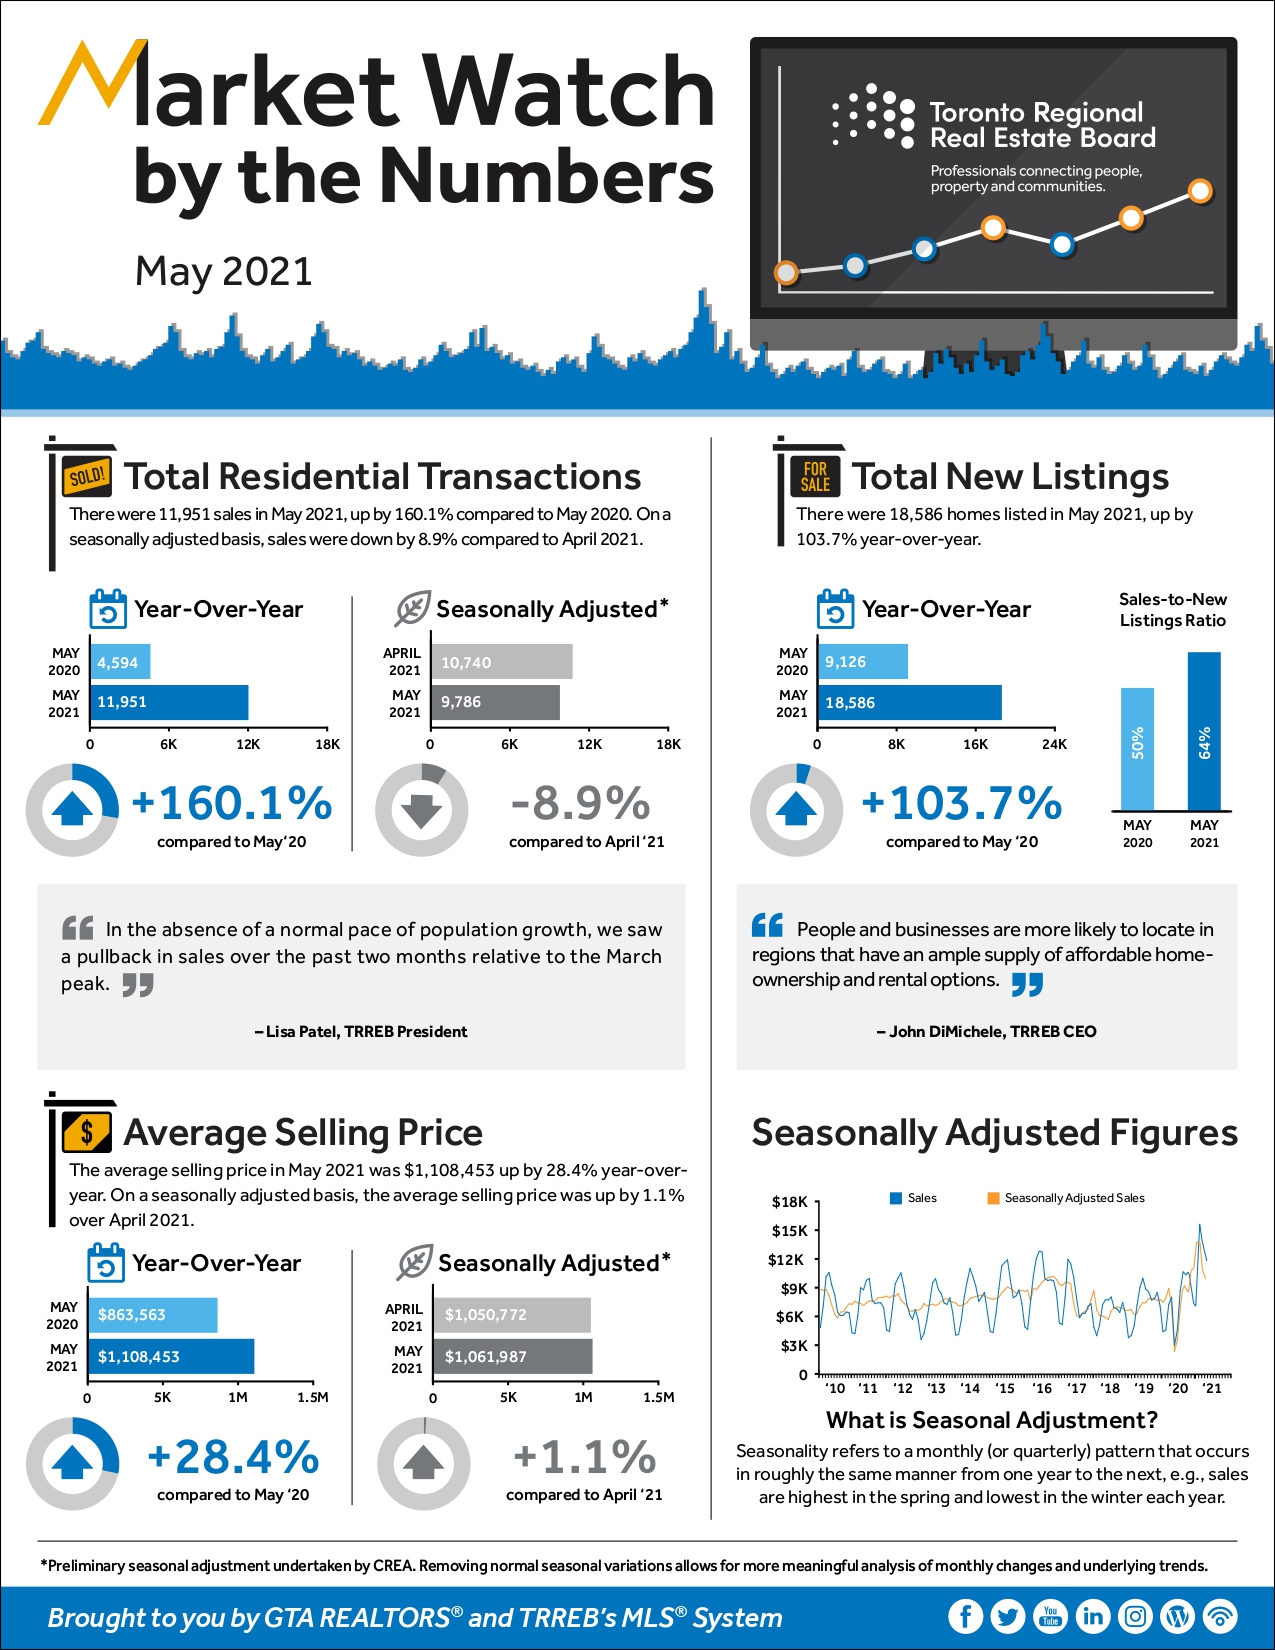
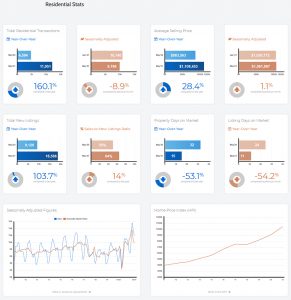
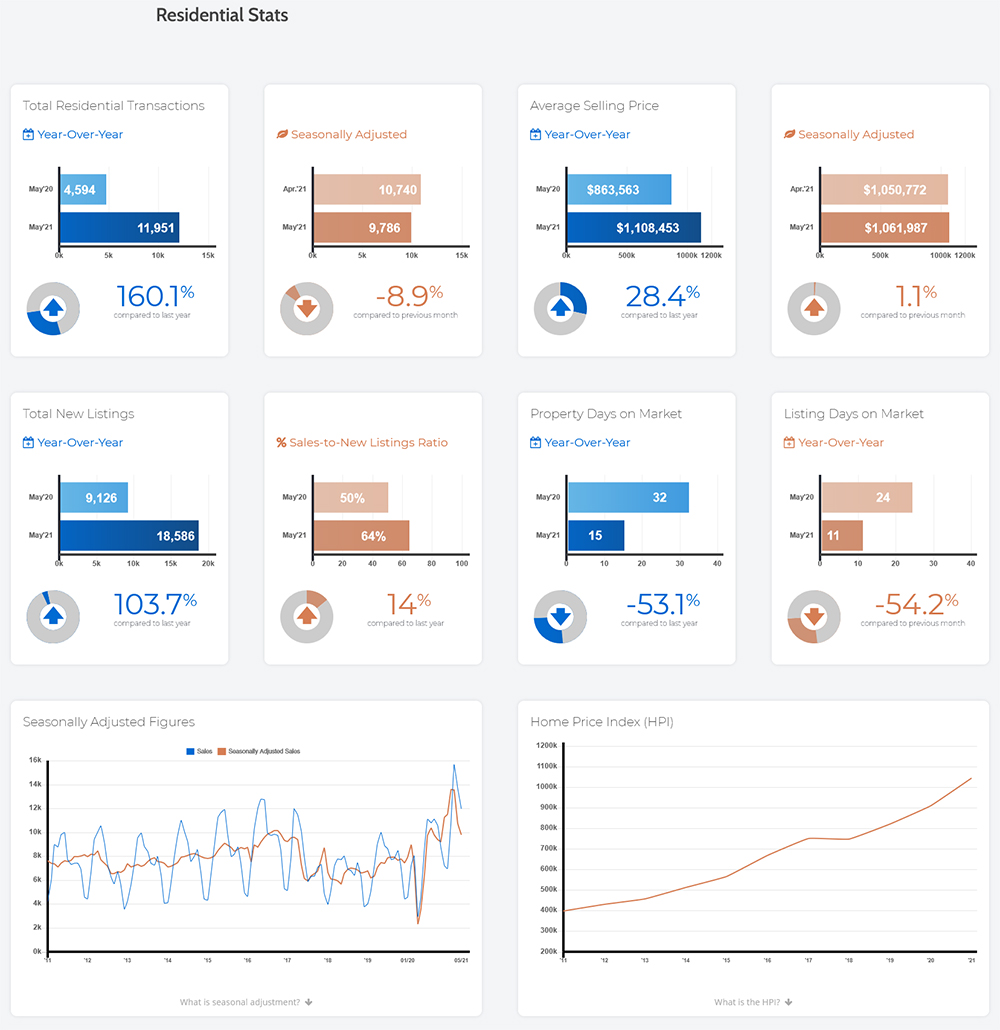
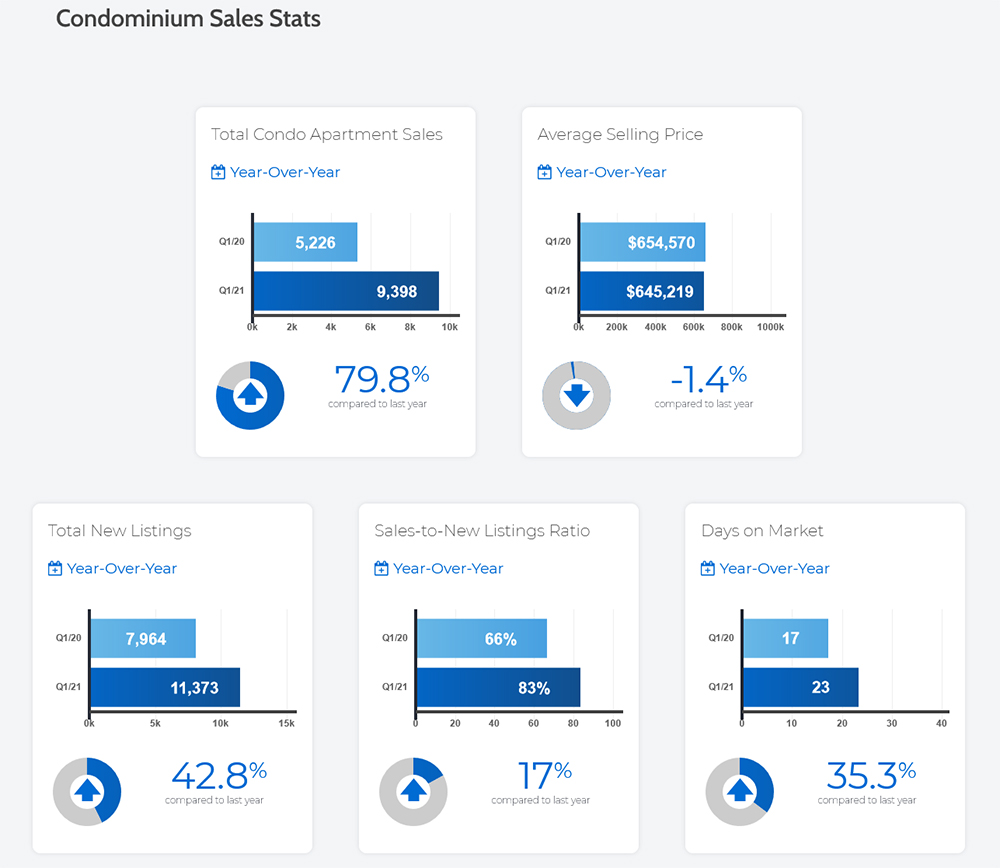
Residential transactions reported through TRREB’s MLS® System remained high in May 2021, but fell short of the 2016 record and remained below this year’s March peak. Despite a slight ebb in sales over the last two months, market conditions remained tight enough to push the average selling price to an all-time record in May.
Greater Toronto Area REALTORS® reported 11,951 sales in May 2021 – more than double the result from May 2020, the second full month of the pandemic. May 2021 sales were below the May 2016 record of 12,789 but remained well above the average May sales of 10,336 for the 2010 through 2019 period. Often, May is the strongest sales month in any given year; however, 2021 results bucked this trend, with May sales below the 15,646 deals reported in March.
Read the full report on the TRREB website!
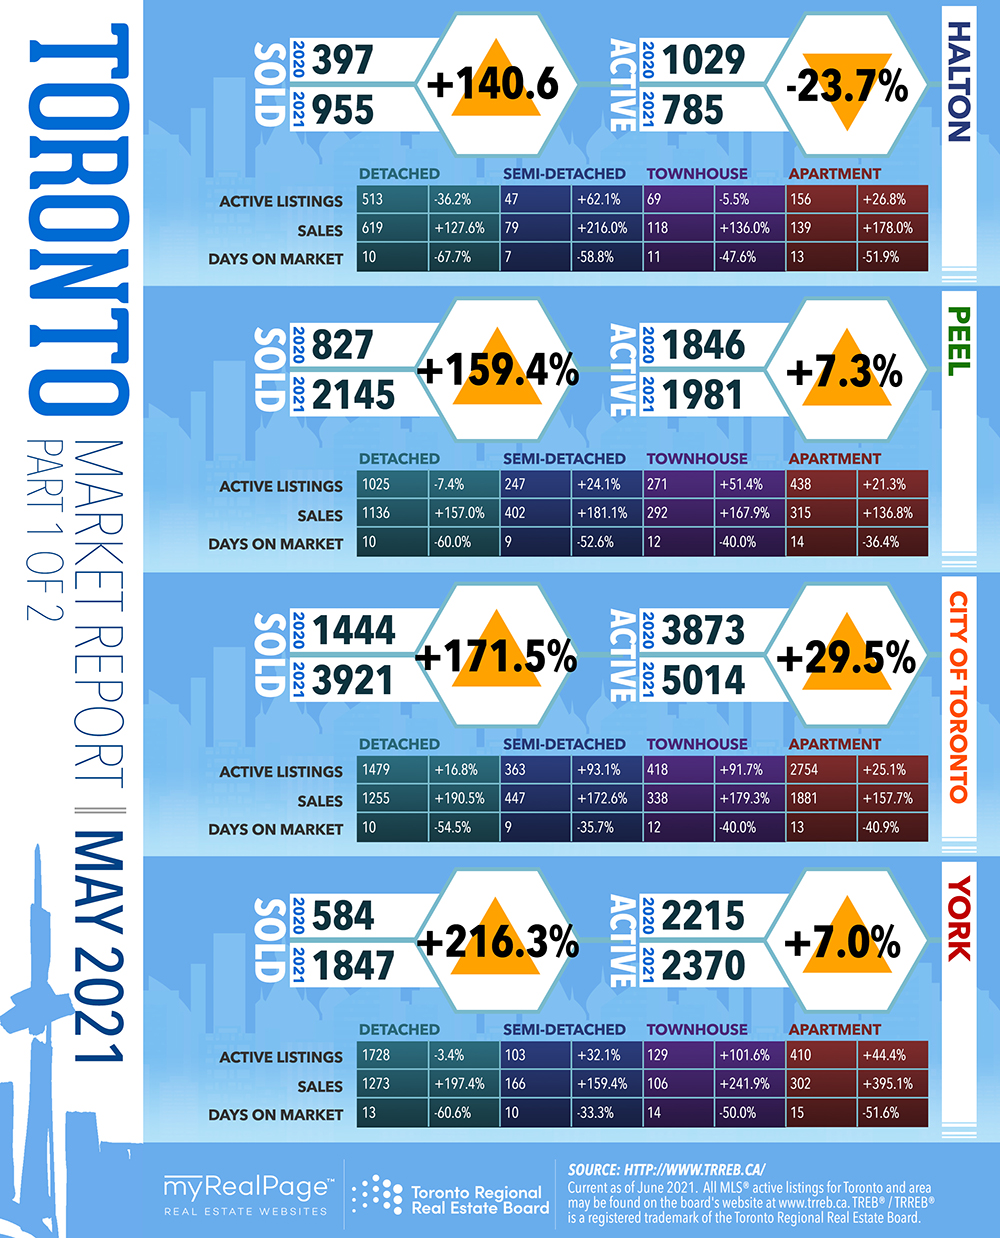
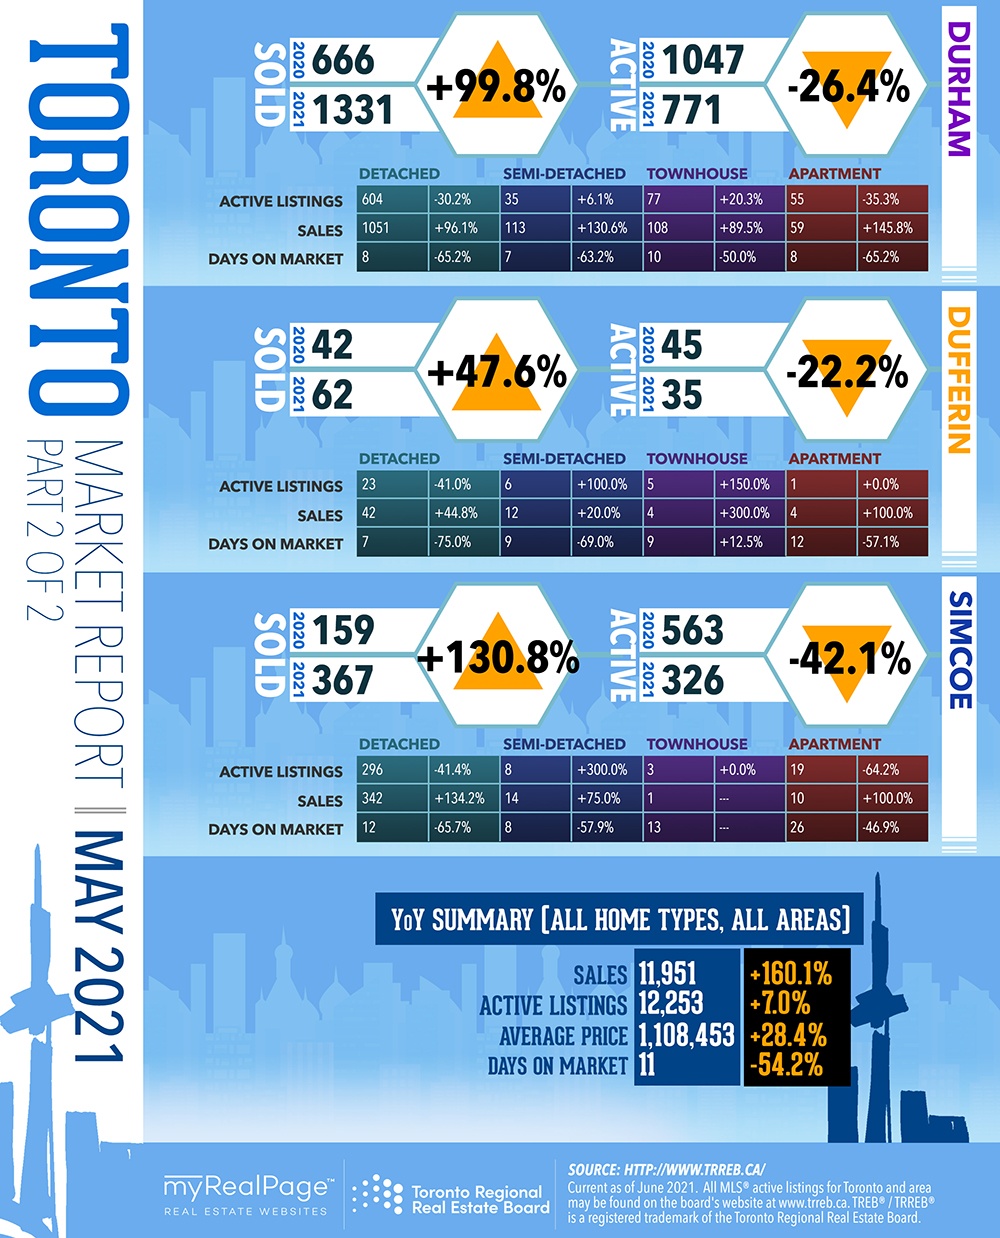
The following data is a comparison between May 2020 and May 2021 numbers, and is current as of June 2021. For last month’s numbers, check out our previous infographic!
Or follow this link for all our TREB / TRREB Infographics!
Click on the images for a larger view! (Protip: Make sure to grab the printable PDF versions, too! It fits best when printed on A4-sized sheets, AND we’ve added an area on the sheet where you can attach your business card! 🙂 )
Download Printable Version – May 2021 TRREB, Toronto Market Report
-
- (from TRREB website)
-
- (from TRREB website)
-
- (from TRREB website)

-
- (from TRREB website)
-
- (from TRREB website)
Last Updated on July 25, 2022 by myRealPage
