INFOGRAPHICS: August 2021 VIREB Vancouver Island Market Reports

Increasing housing supply is key to affordability.
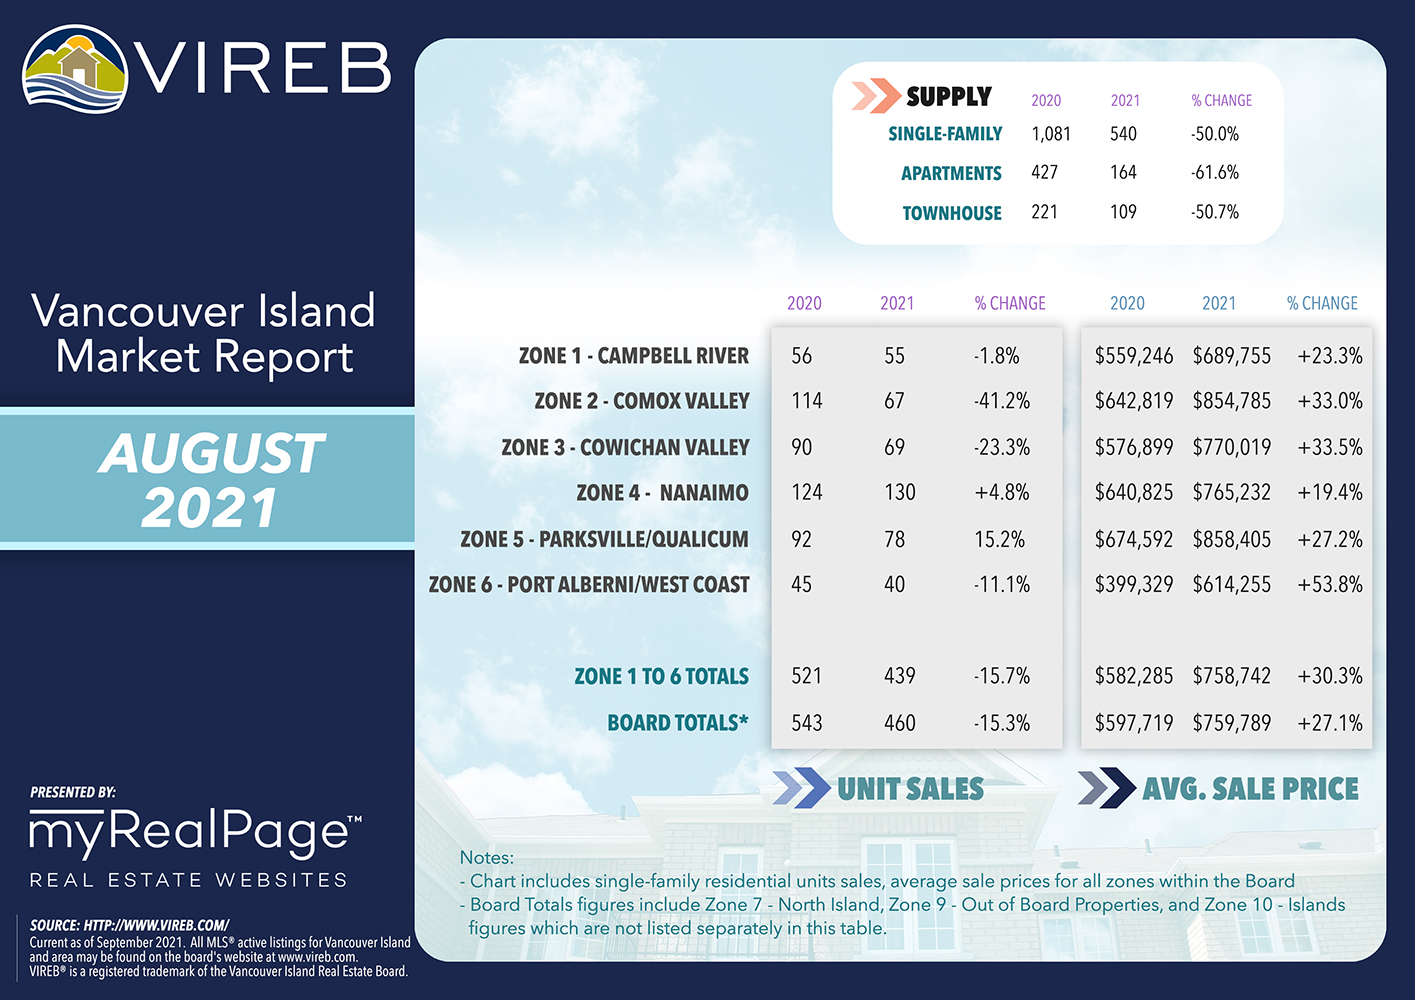
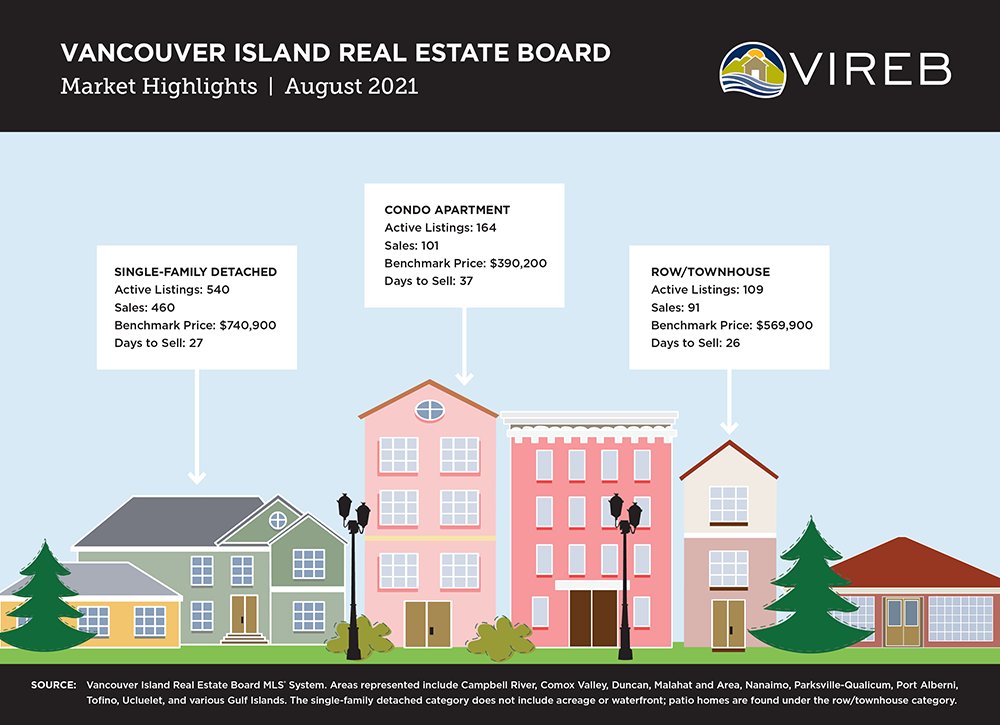
Historically low inventory in the Vancouver Island Real Estate Board (VIREB) area continues to plague potential buyers and hamper sales. Active listings of single-family homes and row/townhouses are 50% lower than in August 2020, while VIREB’s inventory of condo apartments dropped by 61% year over year.
There were 891 unit sales in the VIREB area last month, down 18% from one year ago. By category, 460 single-family homes sold in August, up by two% from July and down by 15% year over year. August saw 101 condo apartment sales compared to 102 the previous year and 124 in July. In the row/townhouse category, there were 91 sales last month compared to 104 in August 2020 and 99 in July 2021.
Read the full report on the VIREB website!
The following data is a comparison between August 2020 and August 2021 numbers, and is current as of September 2021. Click here to check out last month’s infographics.
You can also view all our VIREB infographics by clicking here.
Click on the images for a larger view! (Protip: Make sure to grab the printable PDF versions, too! It fits best when printed on A4-sized sheets, AND we’ve added an area on the sheet where you can attach your business card! 🙂 )
Download Printable Version – August 2021 VIREB Market Report
-

- (from VIREB Twitter)
Last Updated on July 25, 2022 by myRealPage
