INFOGRAPHICS: August 2022 VREB Victoria Market Reports

Less pressure on buyers in August in the Victoria real estate market
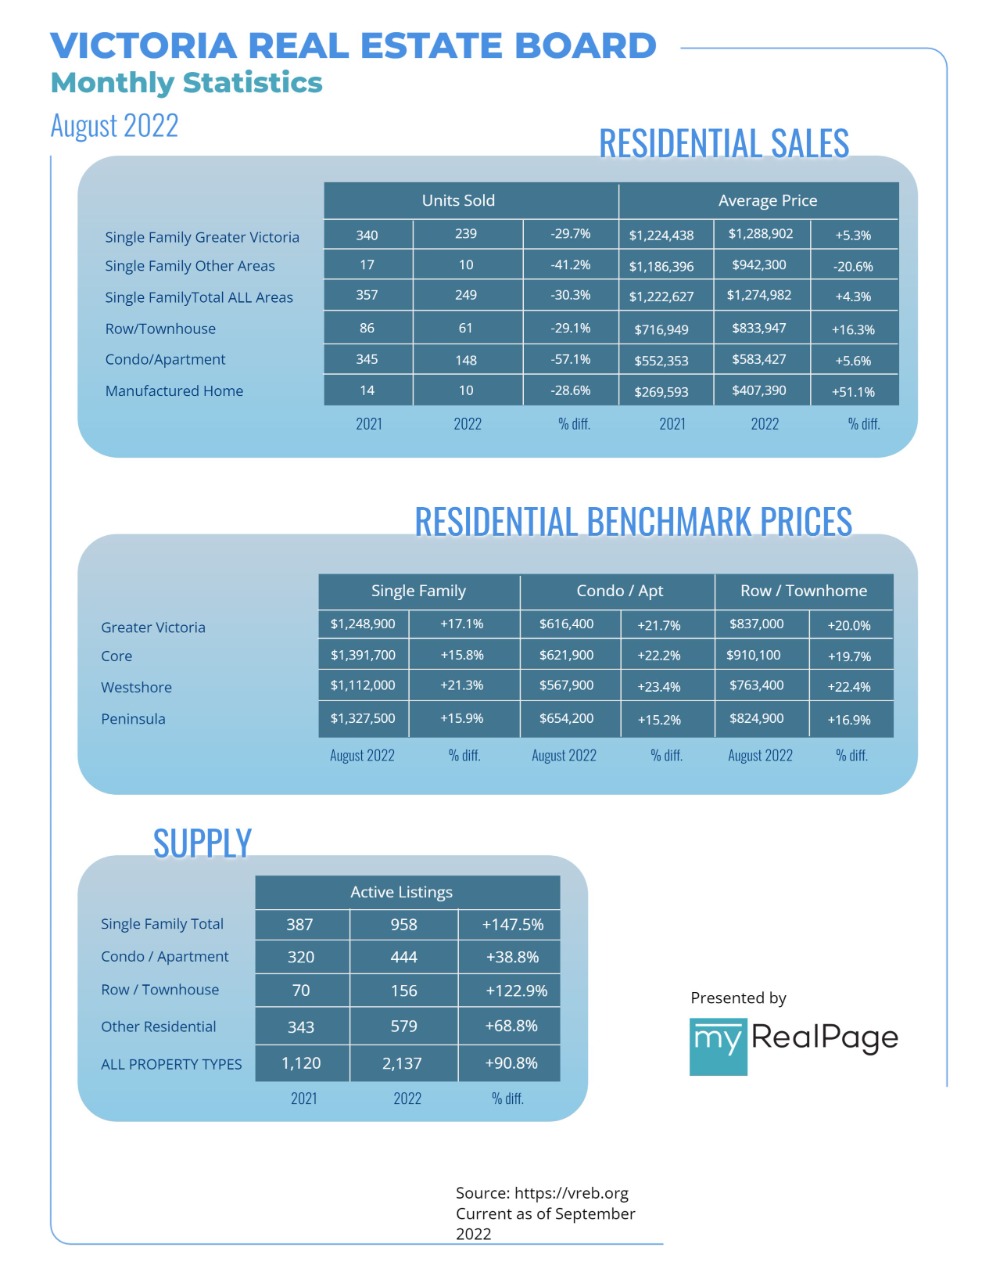
A total of 478 properties sold in the Victoria Real Estate Board region this August, 42.5 per cent fewer than the 831 properties sold in August 2021 and a 6.3 per cent decrease from July 2022. Sales of condominiums were down 57.1 per cent from August 2021 with 148 units sold. Sales of single family homes decreased 30.3 per cent from August 2021 with 249 sold.
“August is typically one of the slower months for real estate in the Greater Victoria area and this year was no exception,” says Victoria Real Estate Board President Karen Dinnie-Smyth. “After two years of market conditions that favoured home sellers, sales have diminished in the past few months and inventory levels have been slowly increasing.”
There were 2,137 active listings for sale on the Victoria Real Estate Board Multiple Listing Service® at the end of August 2022, a decrease of 1.2 per cent compared to the previous month of July but a 90.8 per cent increase from the 1,120 active listings for sale at the end of August 2021.
Read the full report on VREB website!
The following data is a comparison between August 2022 and August 2021 numbers, and is current as of September 2022. Click here to check out last month’s figures!
You can also follow this link for all our Victoria Board monthly infographics!
Click on the images for a larger view!
Download Printable Version – August 2022 VREB, Victoria Market Report

Last Updated on November 28, 2023 by myRealPage


