INFOGRAPHICS: December 2018 REBGV Greater Vancouver Market Reports

Starting fresh! Here are the latest housing market stats for areas covered by the Real Estate Board of Greater Vancouver (REBGV)!
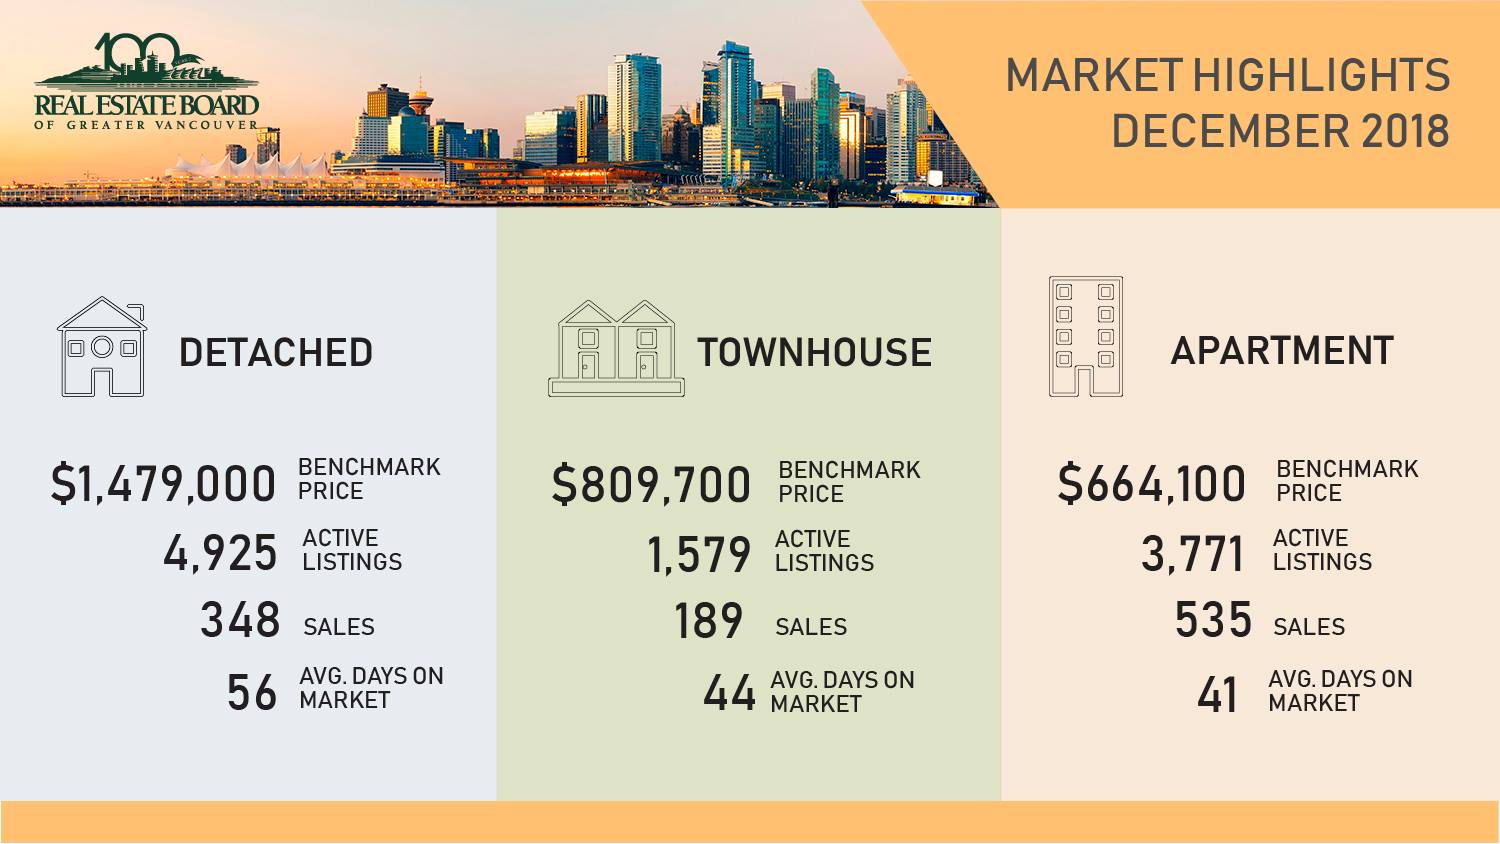
According to the REBGV’s latest press release, Metro Vancouver home sales in 2018 were the lowest annual total in the region since 2000.
They are reporting that in 2018, sales of detached, attached, and apartment properties reached 24,619 on the MLS, which was a 31.6% decrease compared to the 35,993 recorded in 2017. 2018’s sales total was also 25% below the region’s 10-year sales average.
For the month of December, REBGV also reports that residential home sales in the region totaled 1,072, a 46.8% decrease from the 2,016 sales the previous year, and a 33.3% decrease from November 2018 when 1,608 homes sold. December 2018 sales were also 43.3% below the 10-year December sales average.
Phil Moore, REBGV President notes,
“This past year has been a transition period for the Metro Vancouver housing market away from the sellers’ market conditions we experienced in previous years. High home prices, rising interest rates and new mortgage requirements and taxes all contributed to the market conditions we saw in 2018.”
On the supply side, residential listings in Metro Vancouver reached 53,614 in 2018. This is a 1.9% decrease compared to 54,655 homes listed in 2017. For December 2018, 1,407 detached, attached, and apartment homes were newly listed for sale on the MLS in Metro Vancouver. This December figure shows a 25.6% decrease compared to the 1,891 homes listed in December 2017, and a 59.3% decrease compared to November 2018 when 3,461 homes were listed.
Regarding inventories, Phil Moore notes,
“The supply of homes for sale will be an important indicator to follow in 2019. We’ve had record building activity in recent years and many projects will complete soon. This will provide additional housing options for home buyers across the region.”
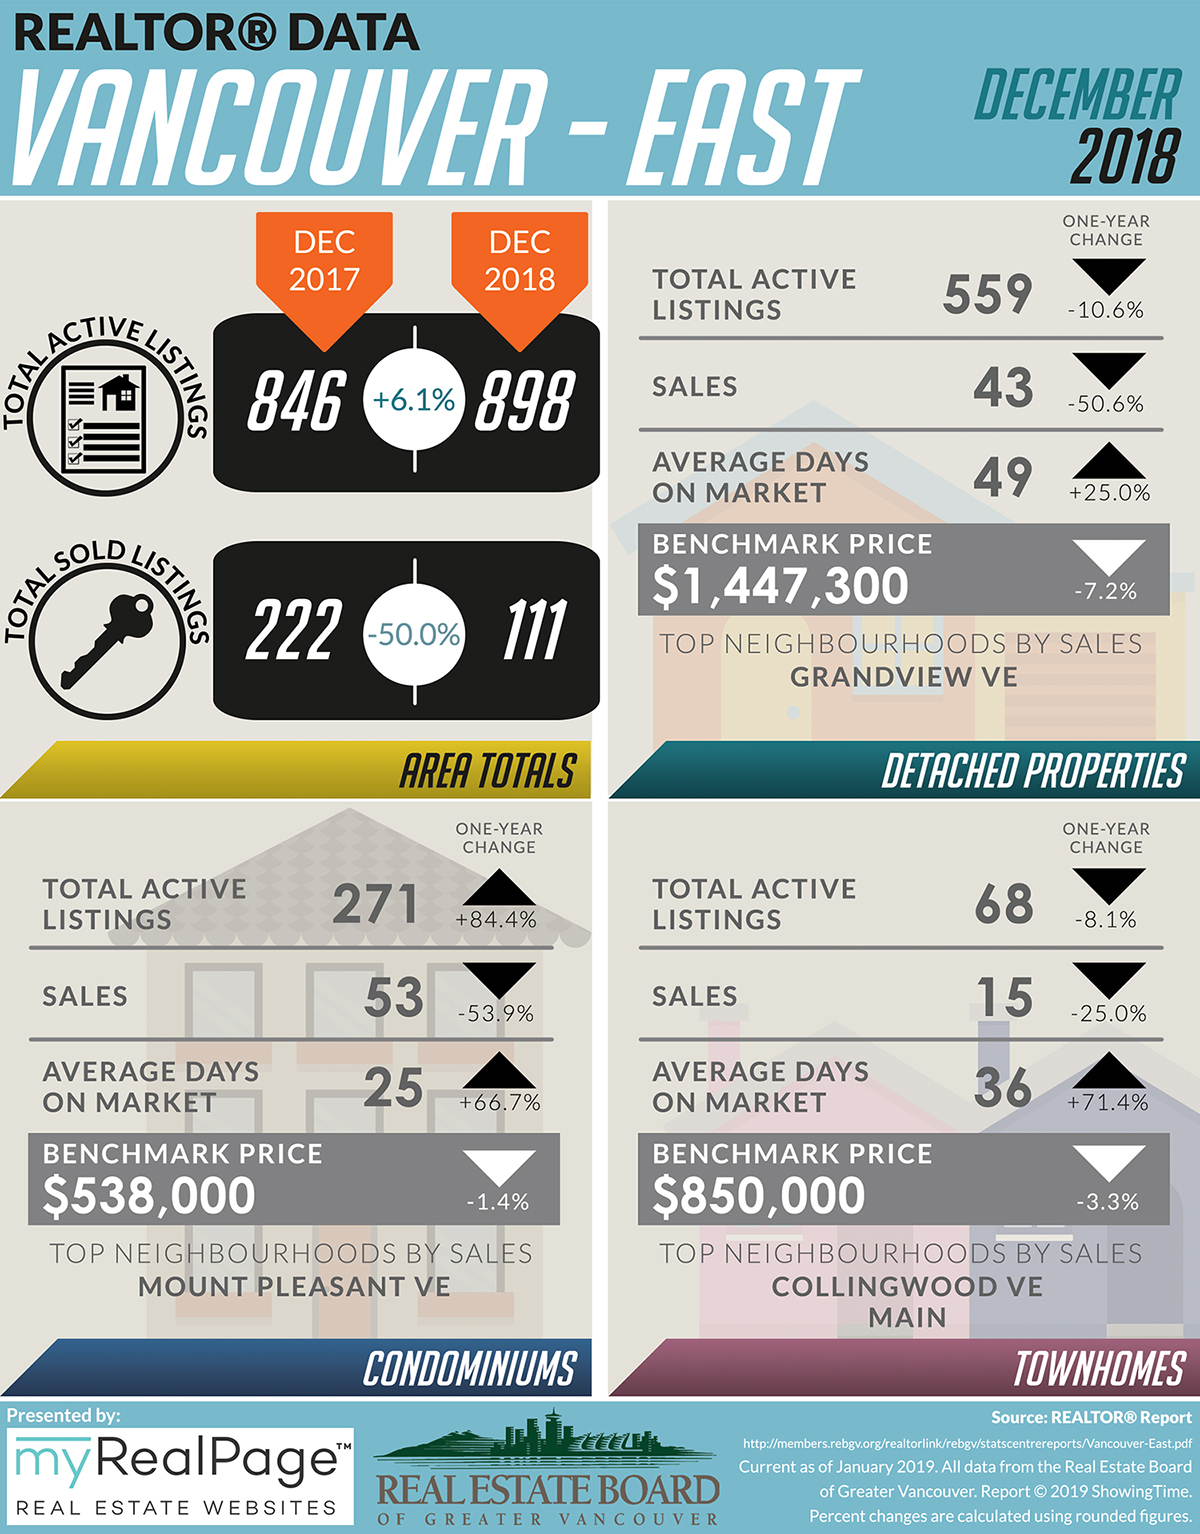
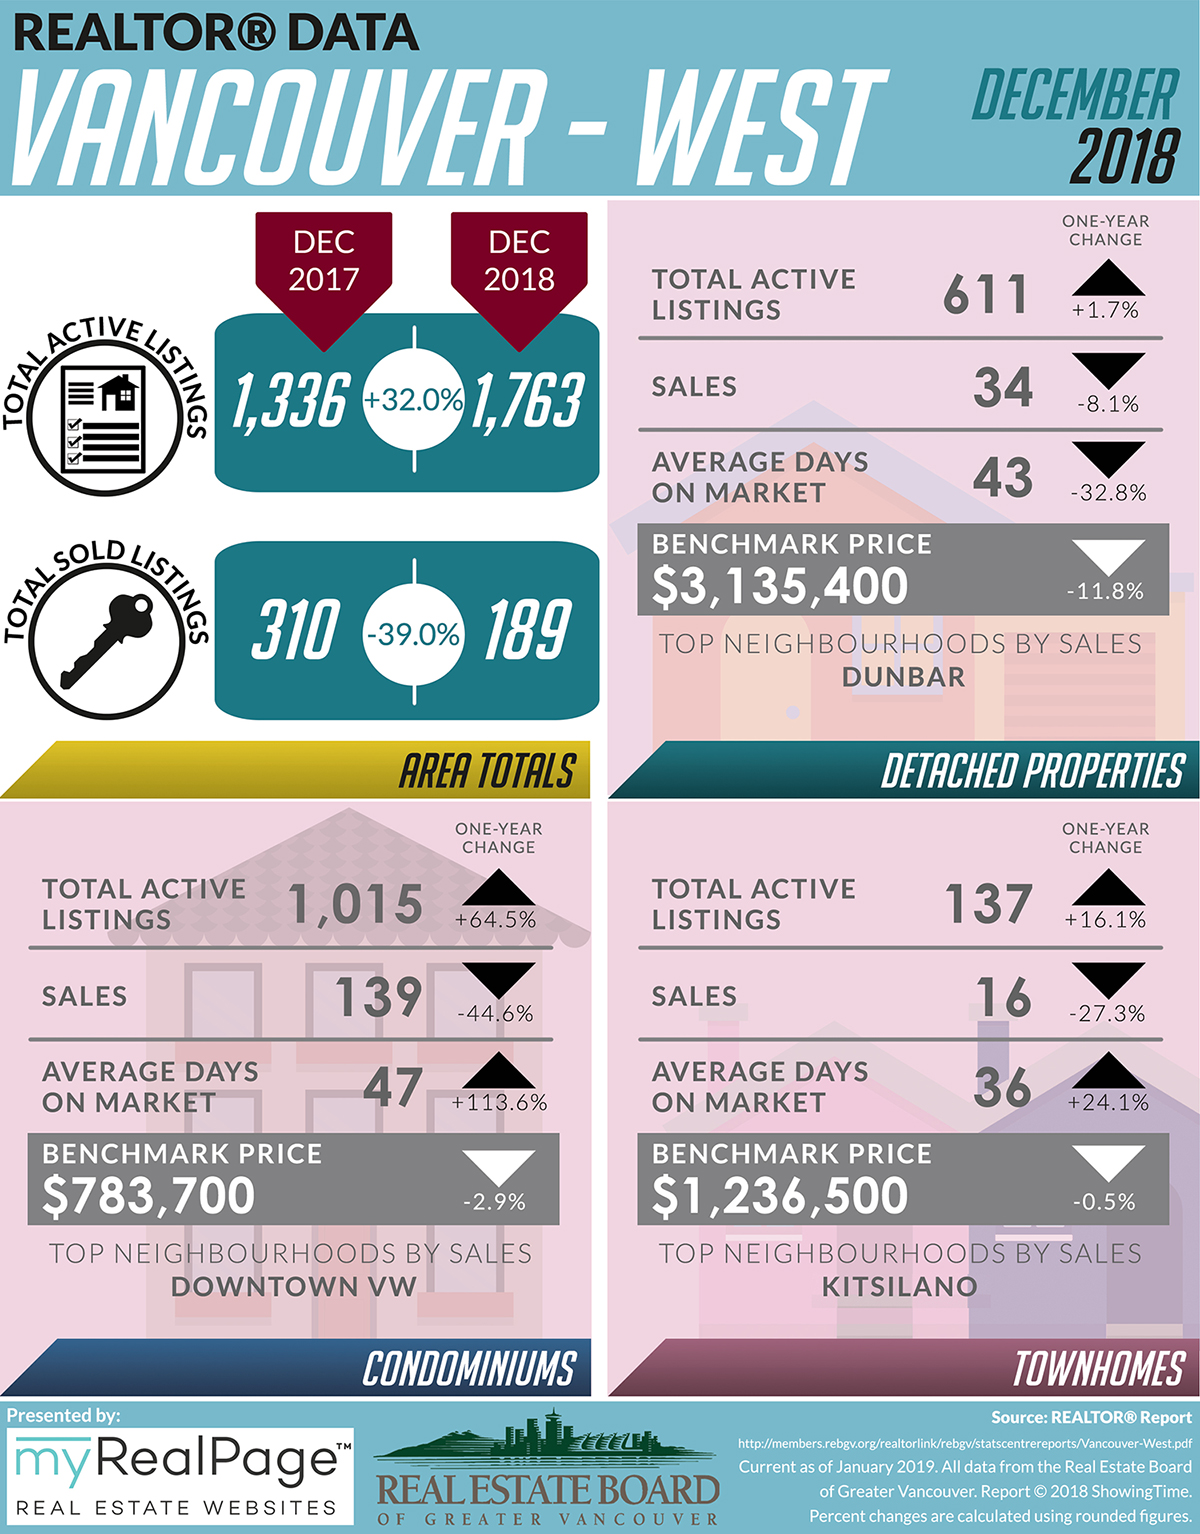
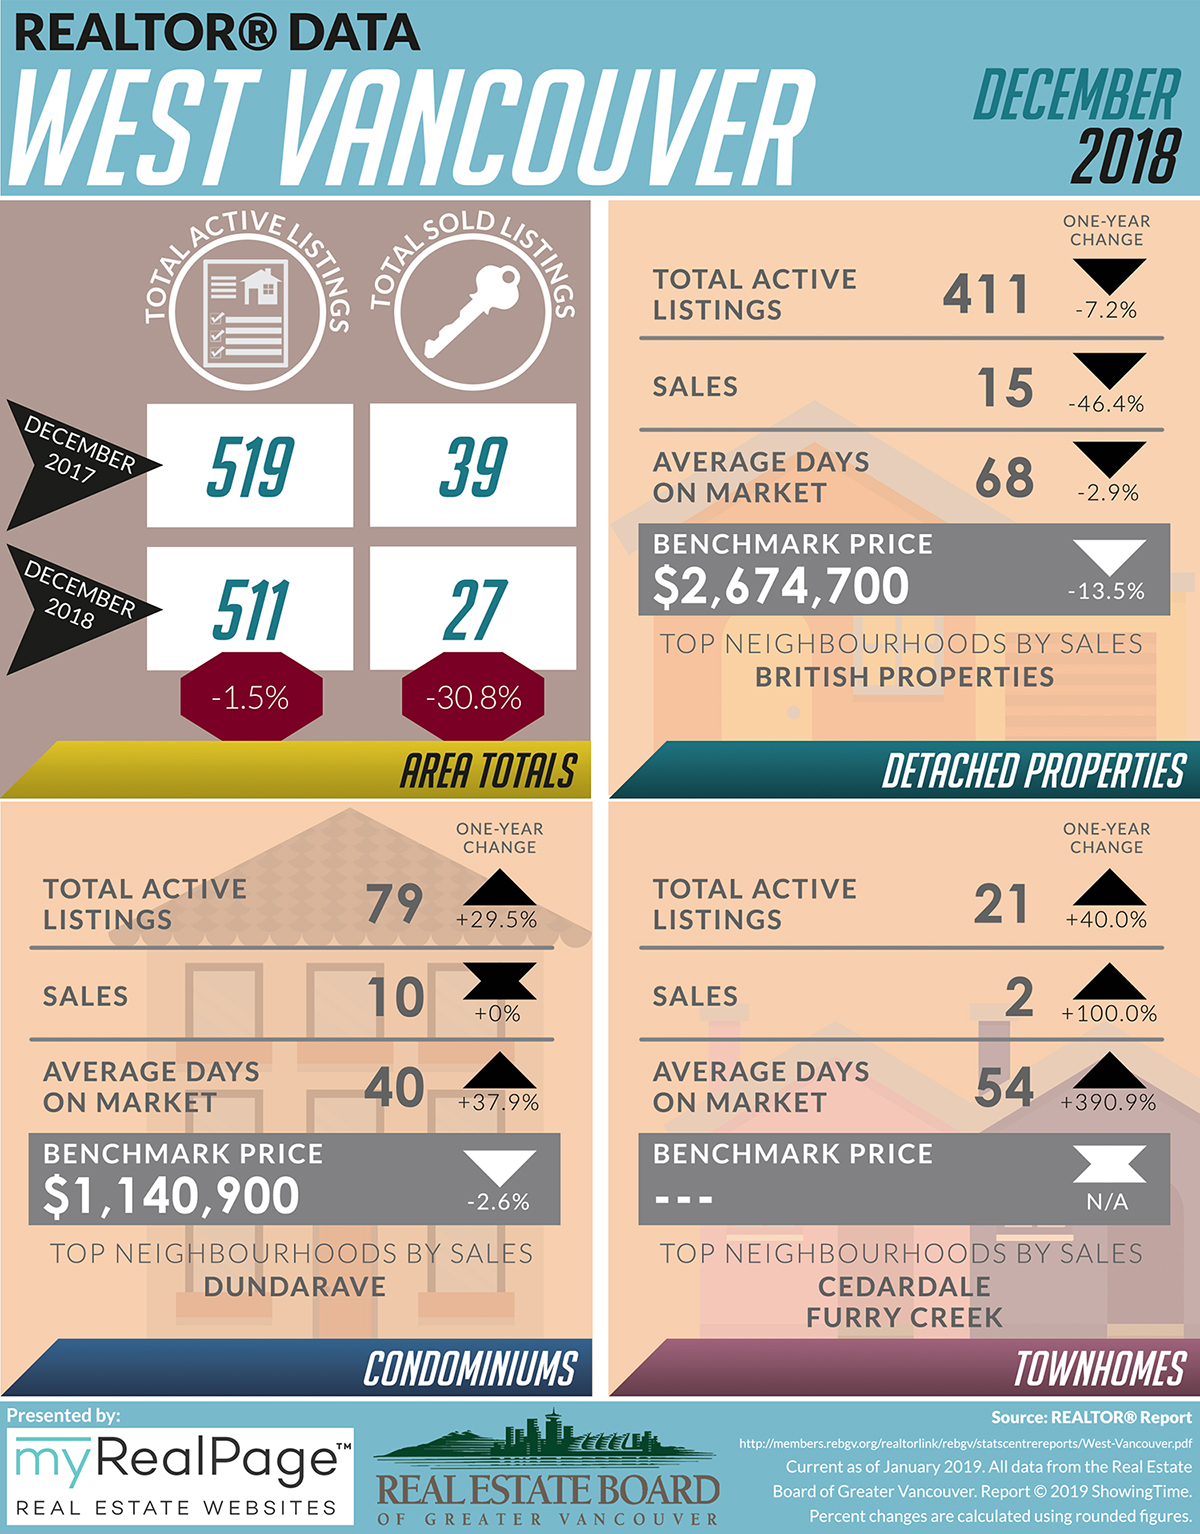
The following data is a comparison between De cember 2017 and December 2018 numbers, and is current as of January 2019. For last month’s update, you can check out our previous post for November 2018 data.
Or follow this link for all our REBGV Infographics!
These infographics cover current trends in North Vancouver, West Vancouver, Vancouver East, and Vancouver West.
Click on the images for a larger view!
(Protip: Make sure to grab the printable PDF versions, too! It fits best when printed on A4-sized sheets, AND we’ve added an area on the sheet where you can attach your business card! 🙂 )
Download Printable Version – REBGV December 2018 Data Infographics

(Image Source: REBGV Facebook)
Last Updated on July 25, 2022 by myRealPage
