INFOGRAPHICS: November 2018 REBGV Greater Vancouver Market Reports

Here are the latest housing market stats for areas covered by the Real Estate Board of Greater Vancouver (REBGV)!
According to their most recent press release, home buyer demand within the Metro Vancouver housing market still remains below long-term historical averages. November 2018 sales was the lowest sales for the month since 2008, and were also 34.7% below the 10-year November sales average.
REBGV president, Phil Moore has noted,
“Home buyers have been taking a wait-and-see approach for most of 2018. This has allowed the number of homes available for sale in the region to return to more typical historical levels. This activity is helping home prices edge down, across all property types, from the record highs we’ve experienced over the last year.”
He also adds,
“Home prices have declined between four and seven per cent over the last six months depending on property type. We’ll watch conditions in the first quarter of 2019 to see if home buyer demand picks up ahead of the traditionally more active spring market.”
REBGV has also released their commercial real estate numbers, which also show a decline in sales.
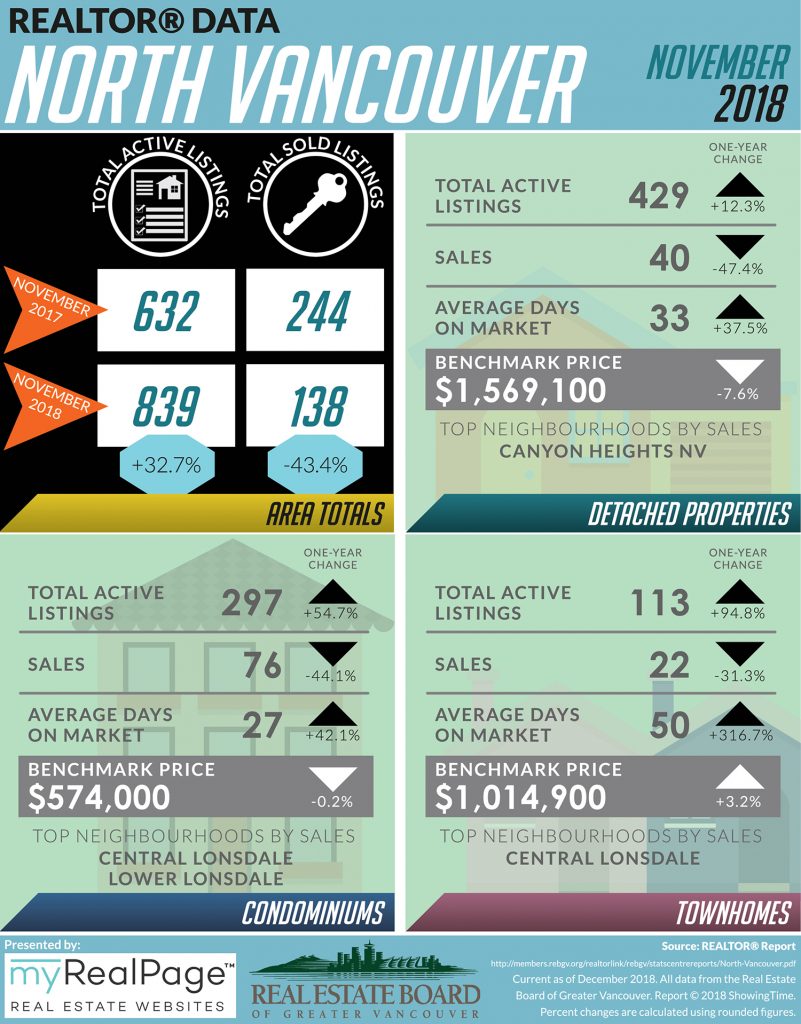
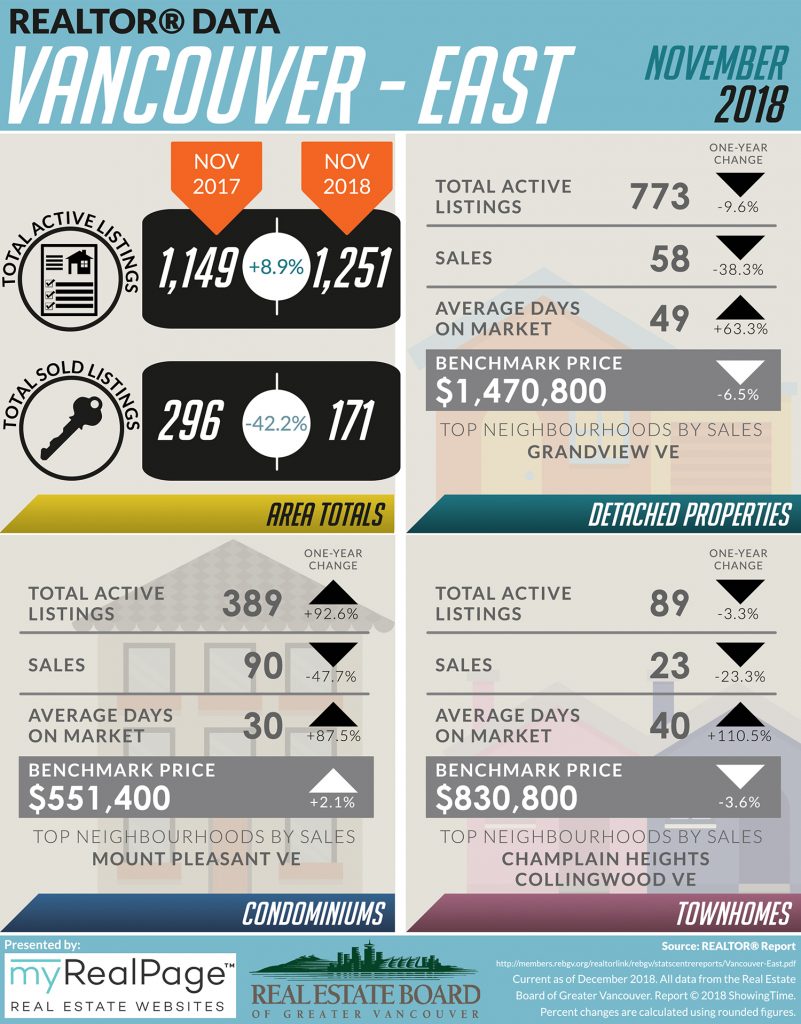
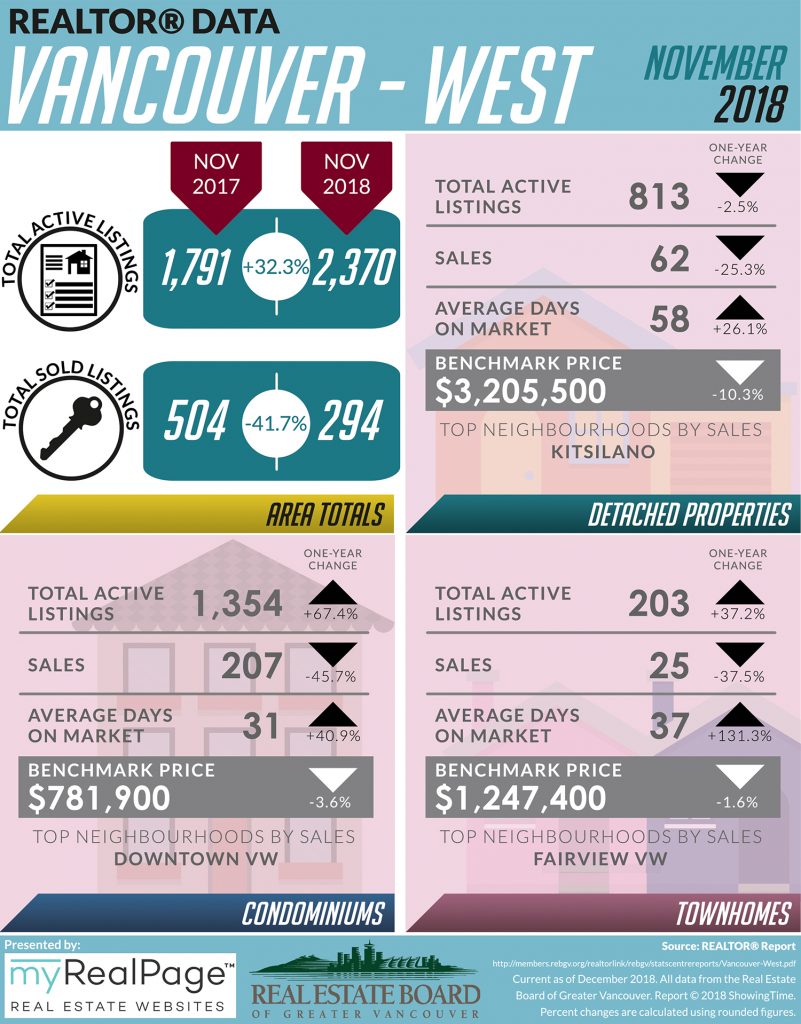
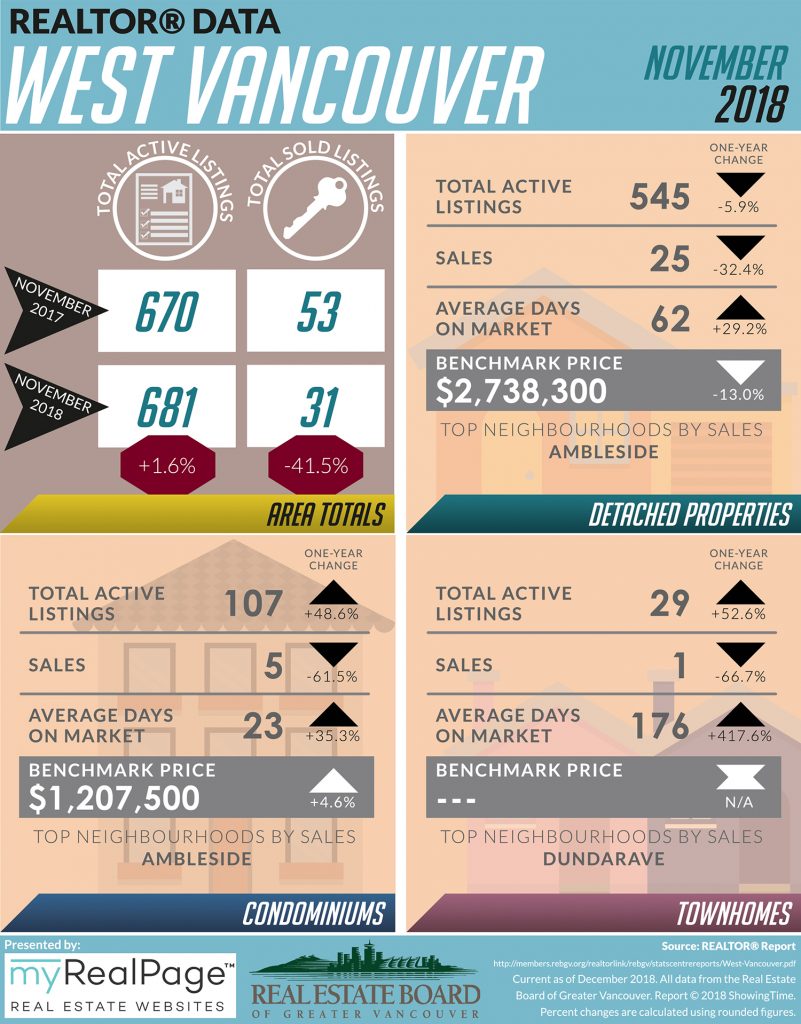
The following data is a comparison between November 2017 and November 2018 numbers, and is current as of December 2018. For last month’s update, you can check out our previous post for October 2018 data.
Or follow this link for all our REBGV Infographics!
These infographics cover current trends in North Vancouver, West Vancouver, Vancouver East, and Vancouver West.
Click on the images for a larger view!
(Protip: Make sure to grab the printable PDF versions, too! It fits best when printed on A4-sized sheets, AND we’ve added an area on the sheet where you can attach your business card! 🙂 )
Download Printable Version – REBGV November 2018 Data Infographics
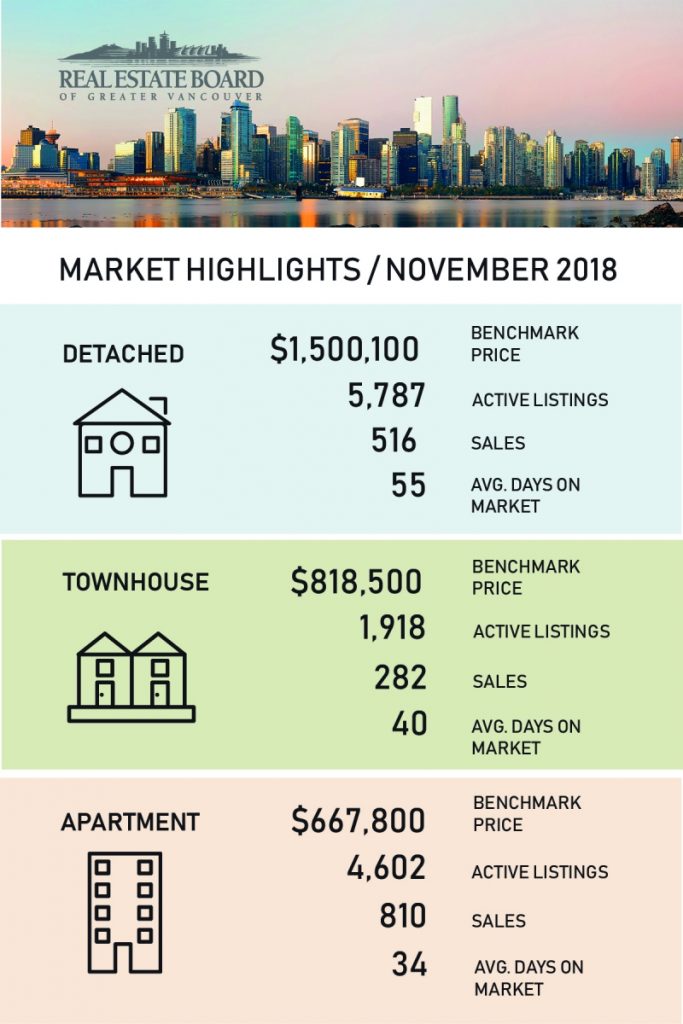
(Image Source: REBGV.org)
Last Updated on July 25, 2022 by myRealPage


