INFOGRAPHICS: October 2018 REBGV Greater Vancouver Market Reports

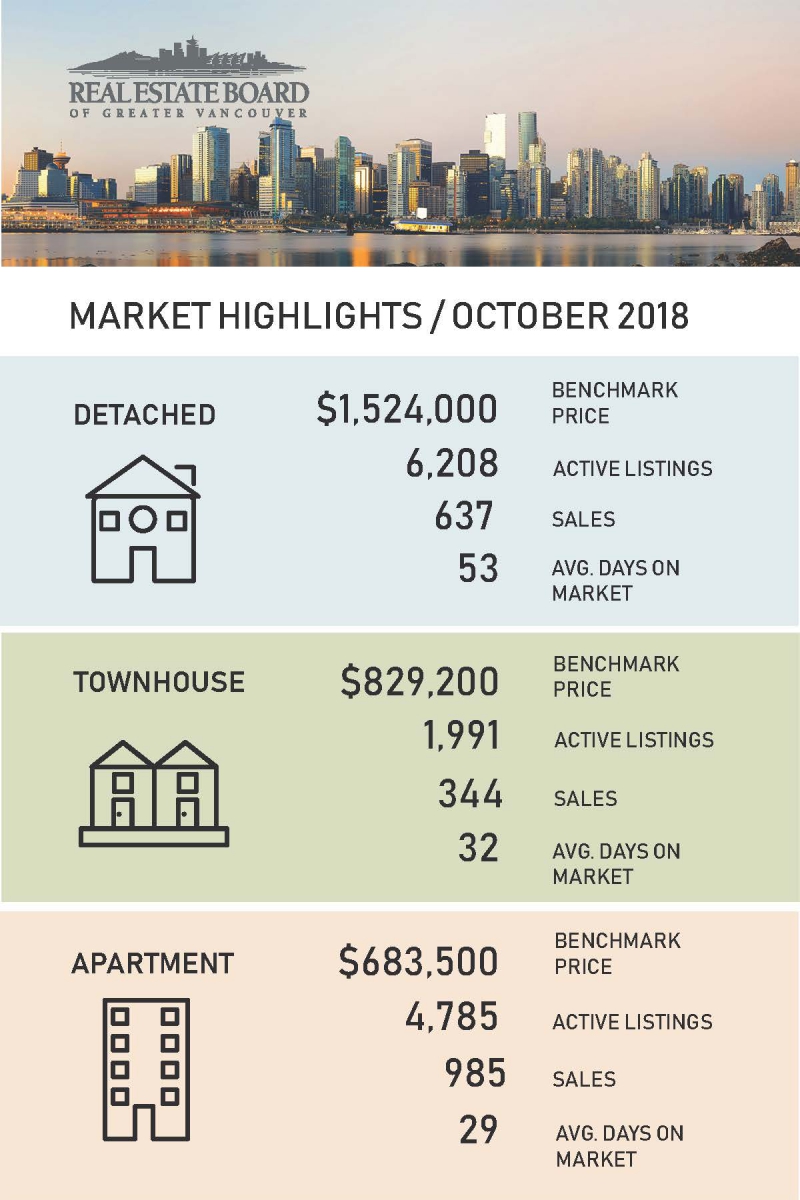
As we approach the last several weeks of the year, the Real Estate Board of Greater Vancouver (REBGV) has reported that home sales across Metro Vancouver is still below long-term historical averages during October 2018.
In their most recent press release, Phil Moore, REBGV president, stated:
“The supply of homes for sale today is beginning to return to levels that we haven’t seen in our market in about four years. For home buyers, this means you have more selection to choose from. For sellers, it means your home may face more competition, from other listings, in the marketplace.”
He has also noted that home prices for different housing types have been edging down between 3% to 5% since June. According to him, this is “providing a little relief for those looking to buy compared to the all-time highs we’ve experienced over the last year.”
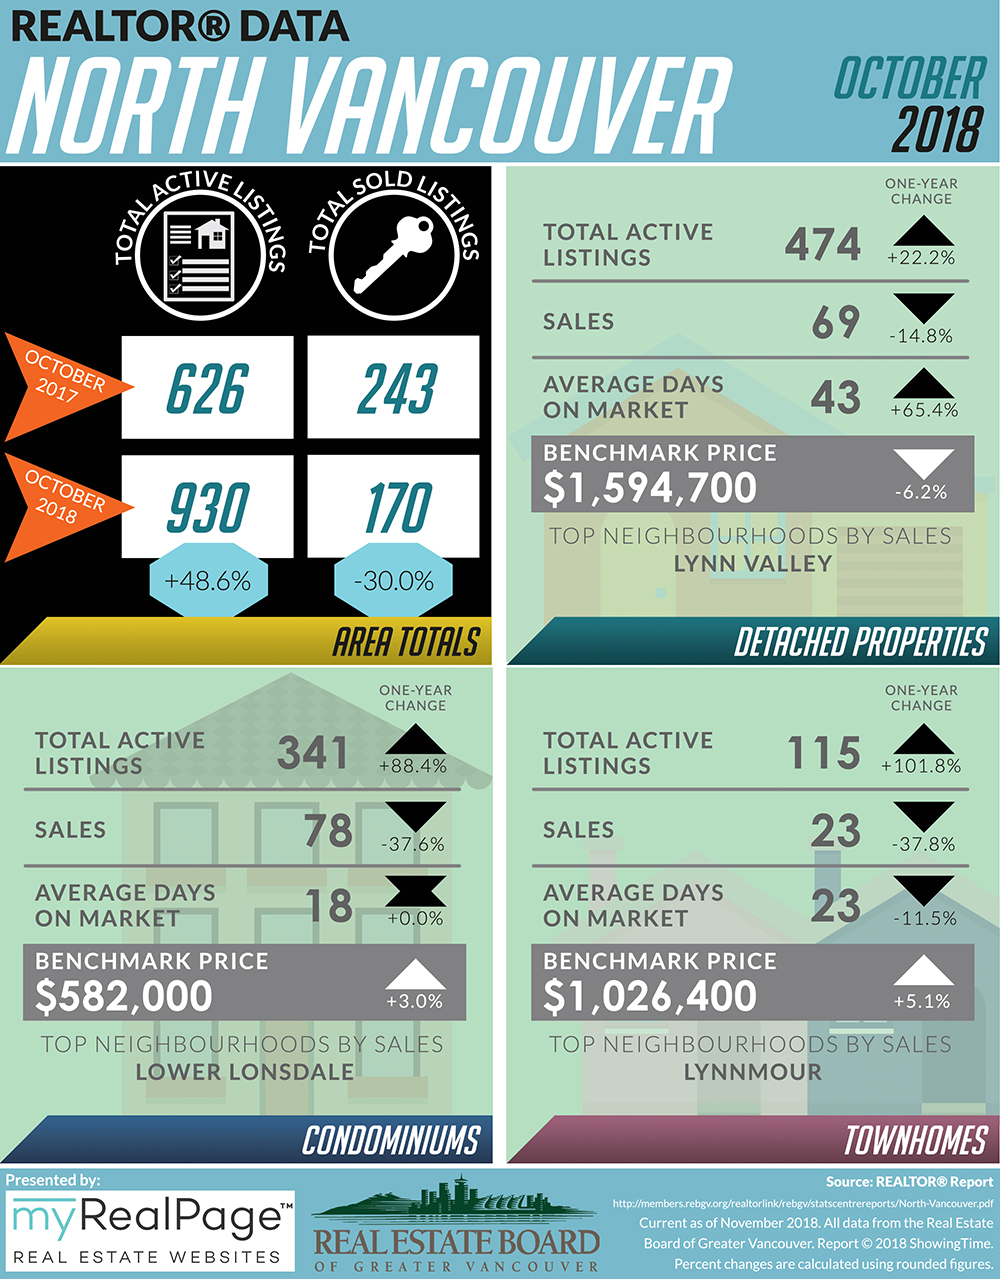
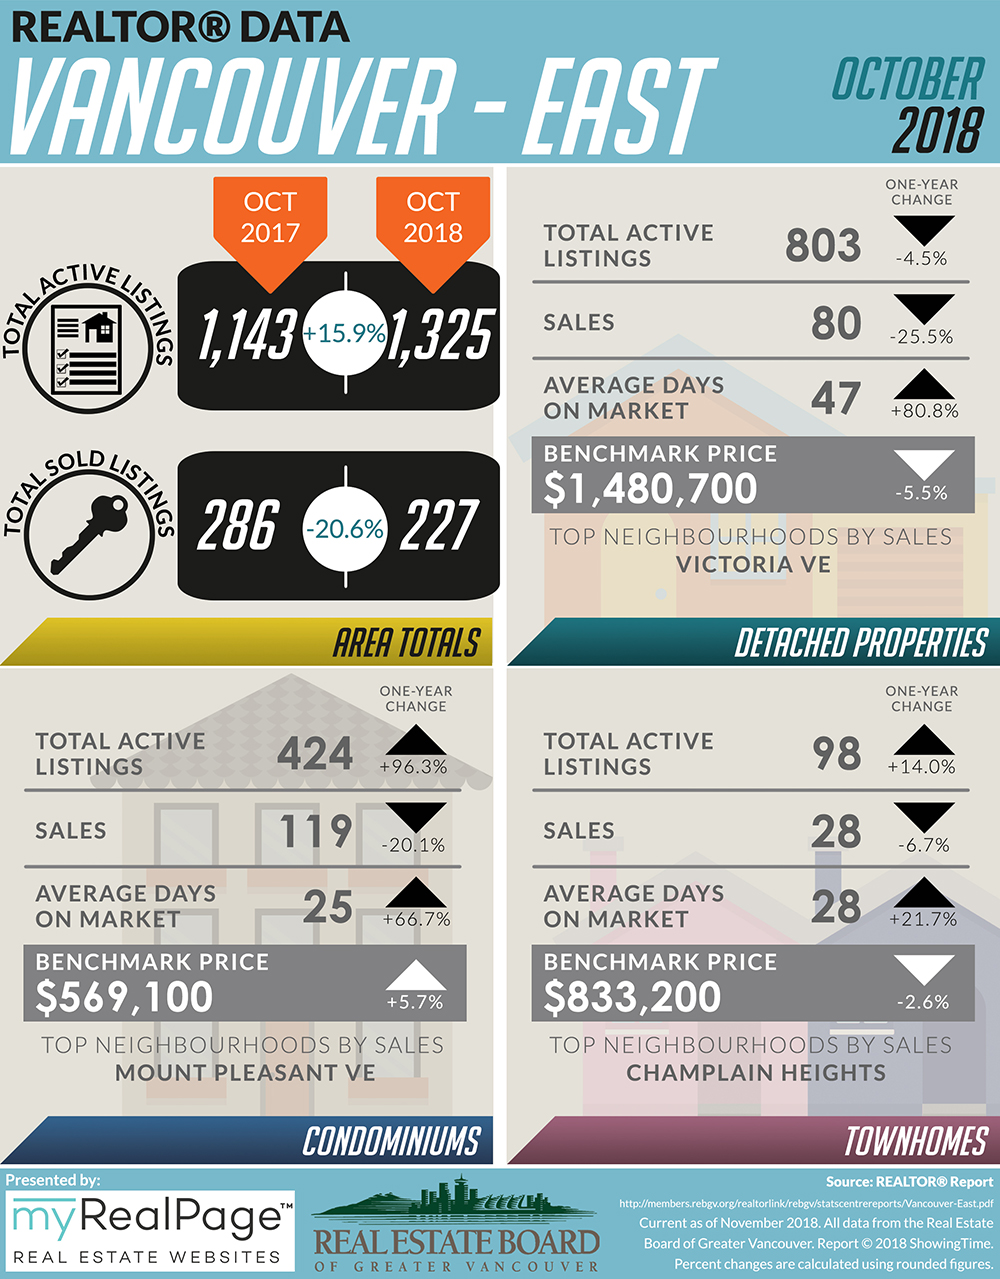
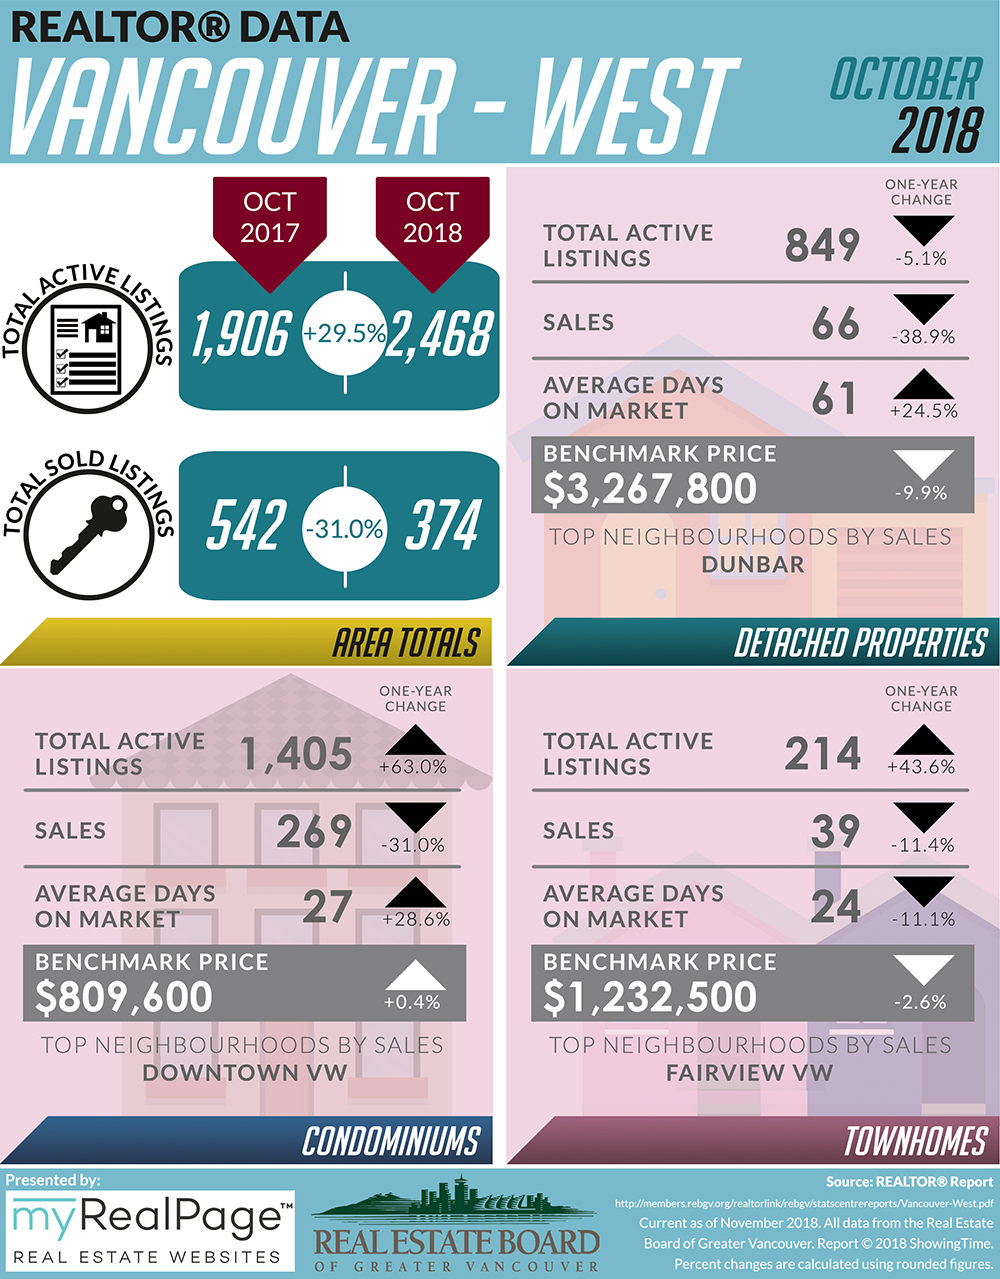
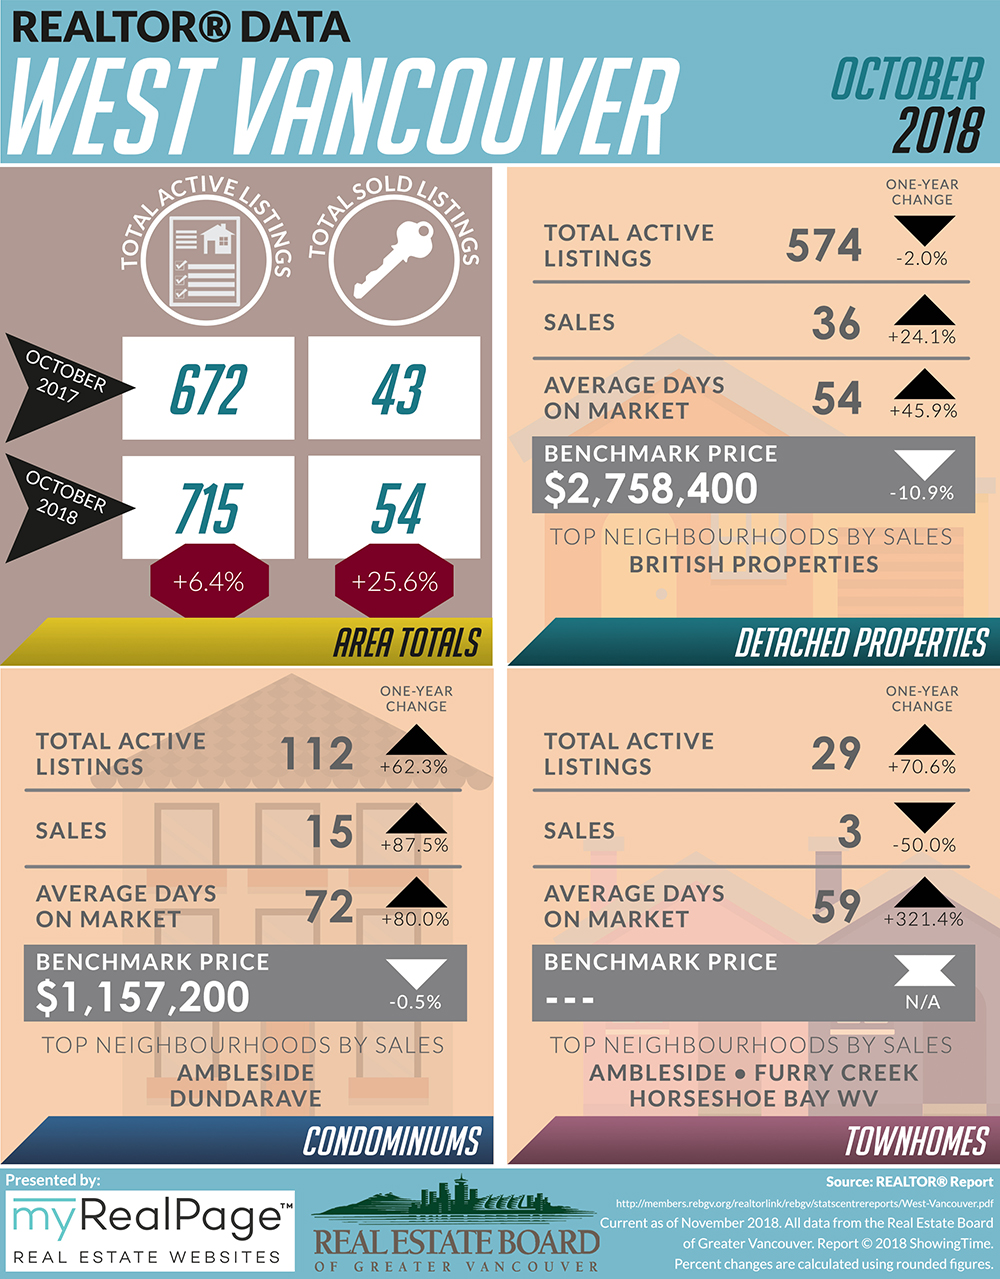
The following data is a comparison between October 2017 and October 2018 numbers, and is current as of November 2018. For last month’s update, you can check out our previous post for September 2018 data.
Or follow this link for all our REBGV Infographics!
These infographics cover current trends in North Vancouver, West Vancouver, Vancouver East, and Vancouver West.
Click on the images for a larger view!
(Protip: Make sure to grab the printable PDF versions, too! It fits best when printed on A4-sized sheets, AND we’ve added an area on the sheet where you can attach your business card! 🙂 )
Download Printable Version – REBGV October 2018 Data Infographics
(Image Source: https://twitter.com/REBGV)
Last Updated on July 25, 2022 by myRealPage
